. 2021 Dec 3;11(12):1335.
doi: 10.3390/life11121335.

Protein Receptors Evolved from Homologous Cohesion Modules That Self-Associated and Are Encoded by Interactive Networked Genes

Affiliations

Protein Receptors Evolved from Homologous Cohesion Modules That Self-Associated and Are Encoded by Interactive Networked Genes

Donard S Dwyer. Life (Basel). .

Abstract

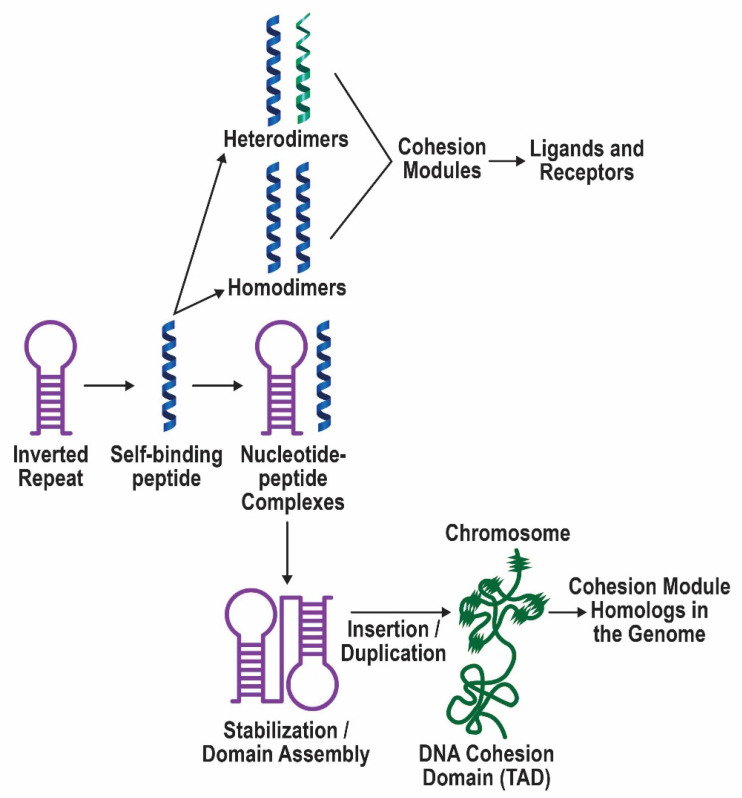
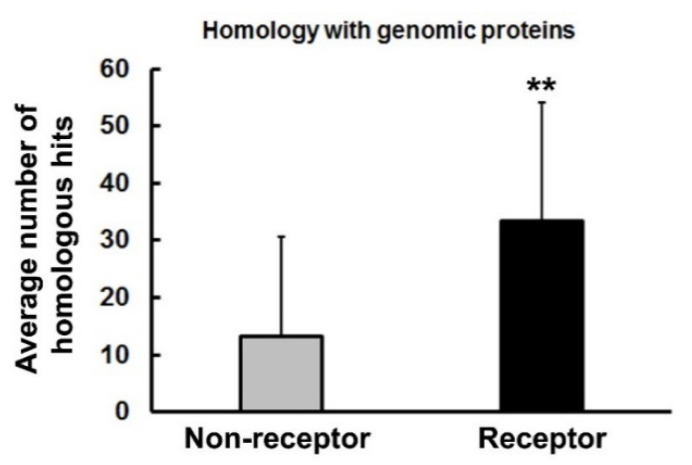
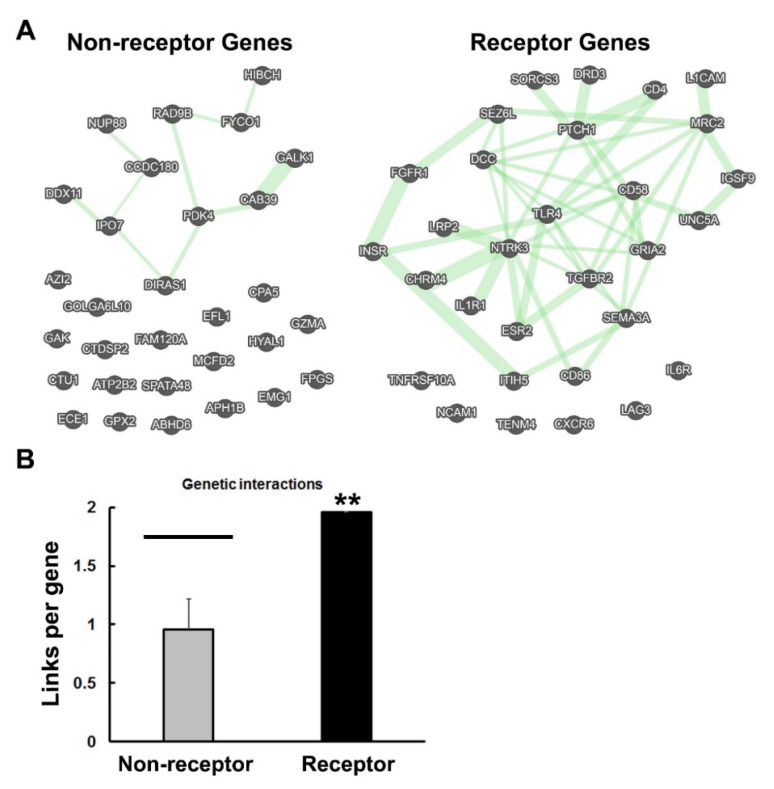
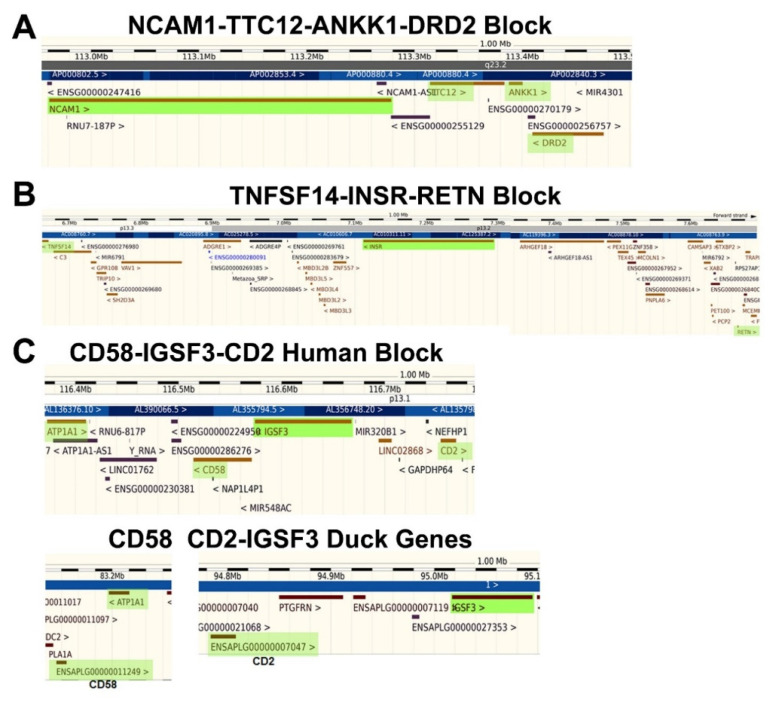
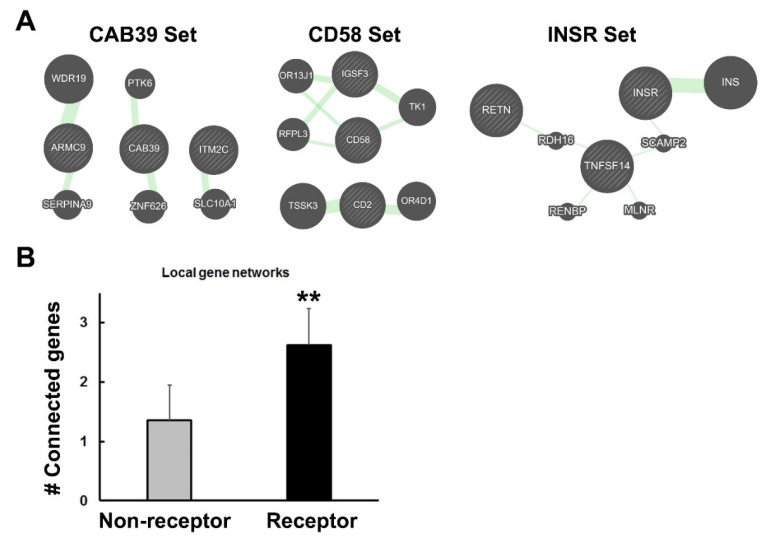
Previously, it was proposed that protein receptors evolved from self-binding peptides that were encoded by self-interacting gene segments (inverted repeats) widely dispersed in the genome. In addition, self-association of the peptides was thought to be mediated by regions of amino acid sequence similarity. To extend these ideas, special features of receptors have been explored, such as their degree of homology to other proteins, and the arrangement of their genes for clues about their evolutionary origins and dynamics in the genome. As predicted, BLASTP searches for homologous proteins detected a greater number of unique hits for queries with receptor sequences than for sequences of randomly-selected, non-receptor proteins. This suggested that the building blocks (cohesion modules) for receptors were duplicated, dispersed, and maintained in the genome, due to structure/function relationships discussed here. Furthermore, the genes coding for a representative panel of receptors participated in a larger number of gene-gene interactions than for randomly-selected genes. This could conceivably reflect a greater evolutionary conservation of the receptor genes, with their more extensive integration into networks along with inherent properties of the genes themselves. In support of the latter possibility, some receptor genes were located in active areas of adaptive gene relocation/amalgamation to form functional blocks of related genes. It is suggested that adaptive relocation might allow for their joint regulation by common promoters and enhancers, and affect local chromatin structural domains to facilitate or repress gene expression. Speculation is included about the nature of the coordinated communication between receptors and the genes that encode them.

Keywords: cohesion modules; gene interaction networks; receptor evolution; self-organization; syntenic blocks of genes.


Conflict of interest statement

The authors declare no conflict of interest.

Figures

Figure 1
Figure 1
Depiction of the self-associating peptide model of the evolution of protein ligand–receptor pairs. Inverted repeats encoded self-binding peptides that formed homodimers and eventually heterodimers. Evidence for this part of the model has been presented previously [3]. These self-binding peptides/cohesion modules provided the building blocks for ligands and receptors. When the peptides also bound to the sequence that encoded them, this interaction promoted the survival of that sequence. Such inverted repeats were favored for insertion, duplication, and merging to produce more complex domain structures. While gene duplications often remain in the vicinity of the original gene, they may also disperse in the genome, as has been observed for large superfamilies of receptor proteins. Homologous regions in the genome are indicated by wavy lines on the chromosome and comprise cohesion modules in receptor proteins and diverged ancestors. Based on retained similarities, these special regions of DNA may interact within and between chromosomes giving rise to gene–gene interactions and topologically associated domains (TADs). Furthermore, distinctive features of the replicated DNA sequences may have facilitated adaptive gene relocation, which, during evolution, brought together genes that function in the same biological process. It is speculated that the creation of these syntenic blocks of genes may have then allowed their joint regulation by enhancers/promoters, and coordinated their expression via shared chromatin accessibility.
Figure 2
Figure 2
Self-binding peptide segments mediate binding to receptors. (A) The amino acid sequences of duplication units or regions of α-BGT and insulin were previously predicted to bind to their respective receptors (see refs. [1,3]) and are aligned with receptor sequences involved in binding. (Note: in the original discovery of regions of homology between α-BGT and the AChR [1], the α1 subunit sequence was used in the search.) The numbers refer to the locations of reference amino acids in the sequences associated with the three-dimensional structures [33,34]. Amino acids in the red font mediate binding, as seen in (B,C). (B) Co-crystal structure of α-BGT (light green ribbon and lime green side chains) and the α7 subunit of the nicotinic receptor (turquoise ribbon and dark blue side chains). The sequences in (A) have been highlighted in yellow in α-BGT and orange in the nAChR. Side chains involved in binding are displayed and numbered as in (A). (C) Cryo-EM structure of insulin (light green ribbon and lime green side chains) and the insulin receptor (turquoise ribbon and dark blue side chains) reveals amino acids involved in binding (numbered as in (A)). Again, the sequences depicted in (A) are highlighted in yellow (insulin) and orange (insulin receptor).
Figure 3
Figure 3
Comparison of BLASTP homology searches performed with 30 receptor and 30 non-receptor sequences. Unique matches with the query sequences were quantified and the data are expressed here as the average number of homologous hits in the genome for each protein analyzed. The error bars represent the standard deviations of the group data. Significant differences between groups are indicated with asterisks: ** p < 0.01.
Figure 4
Figure 4
Comparison of genetic interactions among non-receptor and receptor genes. (A) The results of the GeneMANIA analysis are depicted with green lines indicating gene–gene interactions. The thickness of the green lines reflects the number of interactions in the dataset of Lin et al. [32] associated with the connected genes. The gene designations are shown and are compiled in Supplementary Table S1. The genes depicted at the bottom of the networks in (A) were ones that failed to connect with other members of the panel, despite the capability to interact with other genes in the genome, as determined by GeneMANIA. (B) The total number of links connecting the genes in each set was calculated automatically by GeneMANIA and the average links per gene was plotted. For comparison, four 30-member lists of randomly-selected genes (120 total) were analyzed in the same way, as described in the Methods section. This allowed for the calculation of a mean, SD and a 3 X SD confidence interval (black bar). Asterisks indicate significant differences with ** p < 0.01.
Figure 5
Figure 5
Syntenic blocks of receptor genes. (A) NCAM1 was selected for this study and happens to lie in a functional block described previously [30]. (B) INSR is located in a second block (highlighted in green in the center). It is flanked on the left by TNFSF14 and on the right by RETN (both highlighted in green). (C) CD58, IGSF3 and CD2 lie in close proximity in the human genome. In contrast, there is a gap of 11.6 Mb between CD58 and CD2 in the duck genome, and CD2 is slightly farther away from IGSF3. ATP1A1 has been included as a shared location marker.
Figure 6
Figure 6
Analysis of gene-set genetic interactions. (A) Several 3-gene sets are depicted here as examples of the analysis. They were evaluated with GeneMANIA to determine if they connected into networks, as described in the Methods section. The thickness of the green lines and size of the added network genes (indicated by circles with solid fill) reflect the number of interactions associated with that pair as determined by GeneMANIA. On the left, a non-receptor gene, CAB39 and two nearby genes, ARMC9 and ITMC2 were tested. Although they connected to other genes, they did not connect to one another, even indirectly. This set received a score of 1 for singlet interactions. In the middle, the CD58 3-gene set showed indirect connections between CD58 and IGSF3 but not to CD2. This set was scored as a 2. At the right, the INSR set showed that all three genes connected with each other indirectly through intermediates. This set received a score of 3 for statistical analysis. (B) The number of connected genes for the 3-gene sets was calculated for non-receptor and receptor gene blocks (Supplementary Table S2). A t-test revealed significantly more connections among the receptor panel of genes with p < 0.01 **.

Similar articles

References

    1. Dwyer D.S. Amino acid sequence homology between ligands and their receptors: Potential identification of binding sites. Life Sci. 1989;45:421–429. doi: 10.1016/0024-3205(89)90628-0. - DOI - PubMed
    1. Moyle W.R., Campbell R.K., Myers R.V., Bernard M.P., Han Y., Wang X. Co-evolution of ligand-receptor pairs. Nature. 1994;368:251–255. doi: 10.1038/368251a0. - DOI - PubMed
    1. Dwyer D.S. Assembly of exons from unitary transposable genetic elements: Implications for the evolution of protein-protein interactions. J. Theor. Biol. 1998;194:11–27. doi: 10.1006/jtbi.1998.0676. - DOI - PubMed
    1. Root-Bernstein R. Molecular complementarity III. Peptide complementarity as a basis for peptide receptor evolution: A bioinformatic case study of insulin, glucagon and gastrin. J. Theor. Biol. 2002;218:71–84. doi: 10.1006/jtbi.2002.3056. - DOI - PubMed
    1. Darlison M.G., Richter D. Multiple genes for neuropeptides and their receptors: Co-evolution and physiology. Trends Neurosci. 1999;22:81–88. doi: 10.1016/S0166-2236(98)01333-2. - DOI - PubMed