. 2021 Dec 18;11(12):989.
doi: 10.3390/membranes11120989.

A Stochastic Spatiotemporal Model of Rat Ventricular Myocyte Calcium Dynamics Demonstrated Necessary Features for Calcium Wave Propagation

Affiliations

A Stochastic Spatiotemporal Model of Rat Ventricular Myocyte Calcium Dynamics Demonstrated Necessary Features for Calcium Wave Propagation

Tuan Minh Hoang-Trong et al. Membranes (Basel). .

Abstract

Calcium (Ca2+) plays a central role in the excitation and contraction of cardiac myocytes. Experiments have indicated that calcium release is stochastic and regulated locally suggesting the possibility of spatially heterogeneous calcium levels in the cells. This spatial heterogeneity might be important in mediating different signaling pathways. During more than 50 years of computational cell biology, the computational models have been advanced to incorporate more ionic currents, going from deterministic models to stochastic models. While periodic increases in cytoplasmic Ca2+ concentration drive cardiac contraction, aberrant Ca2+ release can underly cardiac arrhythmia. However, the study of the spatial role of calcium ions has been limited due to the computational expense of using a three-dimensional stochastic computational model. In this paper, we introduce a three-dimensional stochastic computational model for rat ventricular myocytes at the whole-cell level that incorporate detailed calcium dynamics, with (1) non-uniform release site placement, (2) non-uniform membrane ionic currents and membrane buffers, (3) stochastic calcium-leak dynamics and (4) non-junctional or rogue ryanodine receptors. The model simulates spark-induced spark activation and spark-induced Ca2+ wave initiation and propagation that occur under conditions of calcium overload at the closed-cell condition, but not when Ca2+ levels are normal. This is considered important since the presence of Ca2+ waves contribute to the activation of arrhythmogenic currents.

Keywords: arrhythmia; calcium waves; computational model; heart.


Conflict of interest statement

The authors declare that there is no conflict of interest.

Figures
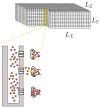
Figure 1
Figure 1
A schematic diagram of ventricular myocytes modeled as a rectangular solid.
Figure 2
Figure 2
The placement of calcium release sites (A) at one Z-depth, and (B) at one Z-disc. The inset in (A) shows the CRUs on two T-tubules at two adjacent Z-discs. The distribution of inter-CRU distance is derived based on the experimental data.
Figure 3
Figure 3
The schematic diagram shows a grid point as a cube of size 200 nm on each dimension in the 3-dimensional space. In this cube, we put a single dyad. Assuming that the width of the dyad is 300 nm, we model the efflux of calcium flowing into 4 adjacent grid points, and it is equally split into 4 parts. The grid location is given by the coordinate (i,j,k).
Figure 4
Figure 4
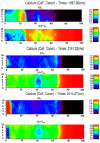
Using the simulation data, a multitude of information can be extracted. Apart from a snapshot of a pseudo-line scan calcium transient during Ca2+ transient along the longitudinal direction, as shown in (A), we are able to show (B) the dynamics of free calcium content, (C) the dynamics of calcium-bound fluorescent, (D) the dynamics of total calcium content.
Figure 4
Figure 4
Using the simulation data, a multitude of information can be extracted. Apart from a snapshot of a pseudo-line scan calcium transient during Ca2+ transient along the longitudinal direction, as shown in (A), we are able to show (B) the dynamics of free calcium content, (C) the dynamics of calcium-bound fluorescent, (D) the dynamics of total calcium content.
Figure 5
Figure 5
The probability of one CRU triggering the neighboring one at different distance and the delay. (A) The probability of triggering a Ca2+ spark under normal diastolic conditions ([Ca2+]myo = 0.096 µM, and [Ca2+]nsr = 1.02 mM). (B) The Ca2+ spark triggering delay under normal conditions. (C) The probability of triggering a Ca2+ spark under high cytosolic calcium ([Ca2+]myo = 0.4 µM, and [Ca2+]nsr = 1.02 mM). (D) The Ca2+ spark triggering delay under high cytosolic calcium.
Figure 6
Figure 6
The probability of one CRU triggering the neighboring one at different distances and the delay. (A) The probability of triggering a spark at the second CRU at different distances from an activated CRU under the high overload condition ([Ca2+] = 0.156 µM, and [Ca2+]nsr = 1.70 mM). (B) The delay in triggering the second CRU under that high overload condition. (C) The probability of triggering a spark at the second CRU at different distances from an activated CRU under the low overload condition ([Ca2+]myo = 0.156 µM, and [Ca2+]nsr = 1.30 mM). (D) The delay in triggering the second CRU under that low overload condition.
Figure 6
Figure 6
The probability of one CRU triggering the neighboring one at different distances and the delay. (A) The probability of triggering a spark at the second CRU at different distances from an activated CRU under the high overload condition ([Ca2+] = 0.156 µM, and [Ca2+]nsr = 1.70 mM). (B) The delay in triggering the second CRU under that high overload condition. (C) The probability of triggering a spark at the second CRU at different distances from an activated CRU under the low overload condition ([Ca2+]myo = 0.156 µM, and [Ca2+]nsr = 1.30 mM). (D) The delay in triggering the second CRU under that low overload condition.
Figure 7
Figure 7
(A) A simulated calcium spark. (B) Free calcium shows the underlying structure of the release site (the delayed activation of the two satellite clusters are invisible under fluorescence profile. (C) The profile of a calcium spark giving FWHM = 1.85 um (each color represents the snapshot at different time points after the peak (e.g., bk = 0 means the black line at 0 ms is delayed). (D) The free calcium profile using back-calculation method agrees with experimental estimates, however, it underestimates the real free myoplasmic calcium amplitude.
Figure 8
Figure 8
The probability of one CRU triggering the neighboring CRU at (A) different distance and (B) the delay. The overload conditions ([Ca2+]myo = 0.156 µM, and [Ca2+]nsr = 1.30 mM) where each CRU has 3 satellite clusters of 10 RyR2s, each at distance 0.2 µm were used.
Figure 9
Figure 9
(A) Simulation geometry to study spark-induced waves (X = CRU location). Black X = the activated CRU, Blue X = the CRU to be activated by diffusing Ca2+. (B) The proposed simulation geometry with an intermediate cluster (Green X = intermediate RyR2 cluster).
Figure 10
Figure 10
(A) The Po,trigger of Ca2+ release from 9 activated CRUs on one Z-line on the CRU at different distances. (B) The time delay for the activation at different distances.
Figure 11
Figure 11
(A) The Po,trigger of Ca2+ release from 9 activated CRUs on one Z-line, with 1 intermediate RyR2 cluster in the middle, on the CRU at the next Z-line of different distance. (B) The time delay for the activation at different distances.
Figure 12
Figure 12
(A) Calcium overload ([Ca]nsr = 1.7 mM, [Ca]i = 0.15 μM), this computational model of the rat ventricular myocyte can reproduce a repetitive sustained calcium wave which typically initiates at one end of the cell. The initiation site typically occurs where release sites are closer together or at a boundary. (B) Calcium waves in the rat ventricular myocyte under [Ca]o = 5 mM overload experimental conditions, the repetitive waves occur at a particular site for each cell. This suggests that there are more density of release sites surrounding the region that allows mass calcium release high enough to trigger the wave. Some waves can sustain to the next end, while some decay and stop in between, which suggests a stochastic nature of the waves (personal communication from Brian Hagen).
Figure 13
Figure 13
Given the initial [Ca]nsr = 1.7 mM, to derive the triggering of the wave, the simulation suggested that an overload of 1.5 mM is enough to trigger the repetitive calcium waves.
Figure 14
Figure 14
Effect of SERCA on the probability of a Ca2+ triggering a Ca2+ wave. (A) uniform SERCA distribution; (B) 90% reduction in SERCA flux.

Similar articles

Cited by

References

    1. Cheng H., Lederer W.J., Cannell M.B. Calcium Sparks: Elementary Events Underlying Excitation-Contraction Coupling in Heart Muscle. Science. 1993;262:740–744. doi: 10.1126/science.8235594. - DOI - PubMed
    1. Cheng H., Lederer M.R., Lederer W.J., Cannell M.B. Calcium sparks and [Ca2+]i waves in cardiac myocytes. Am. J. Physiol. 1996;270:C148–C159. doi: 10.1152/ajpcell.1996.270.1.C148. - DOI - PubMed
    1. Wier W.G., ter Keurs H.E., Marban E., Gao W.D., Balke C.W. Ca2+ ‘sparks’ and waves in intact ventricular muscle resolved by confocal imaging. Circ. Res. 1997;81:462–469. doi: 10.1161/01.RES.81.4.462. - DOI - PubMed
    1. Lukyanenko V., Gyorke S. Ca2+ sparks and Ca2+ waves in saponin-permeabilized rat ventricular myocytes. J. Physiol. 1999;521:575–585. doi: 10.1111/j.1469-7793.1999.00575.x. - DOI - PMC - PubMed
    1. Diaz M.E., Eisner D.A., O’Neill S.C. Depressed ryanodine receptor activity increases variability and duration of the systolic Ca2+ transient in rat ventricular myocytes. Circ. Res. 2002;91:585–593. doi: 10.1161/01.RES.0000035527.53514.C2. - DOI - PubMed

LinkOut - more resources