

Copy number profiling of circulating free DNA predicts transarterial chemoembolization response in advanced hepatocellular carcinoma
- PMID: 34939323
- PMCID: PMC9120881
- DOI: 10.1002/1878-0261.13170
Copy number profiling of circulating free DNA predicts transarterial chemoembolization response in advanced hepatocellular carcinoma
Abstract
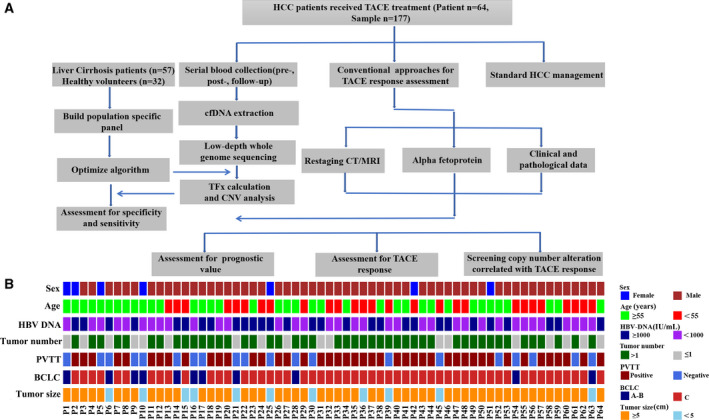
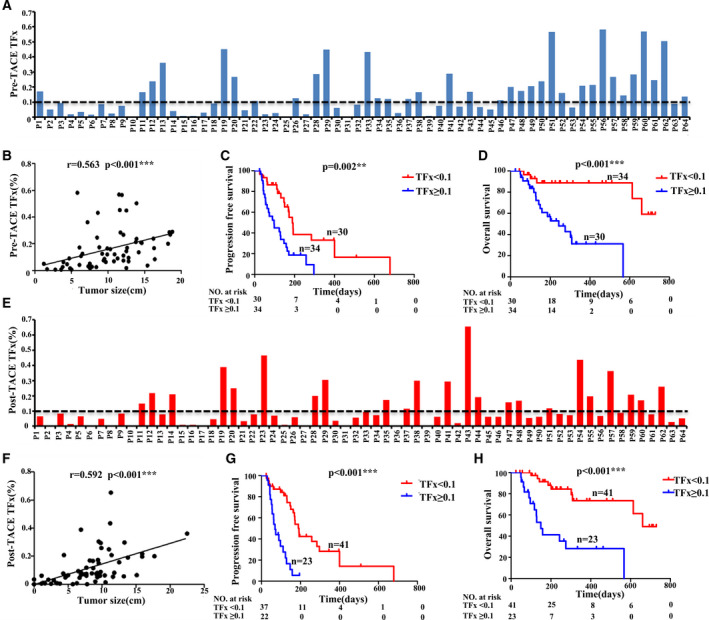
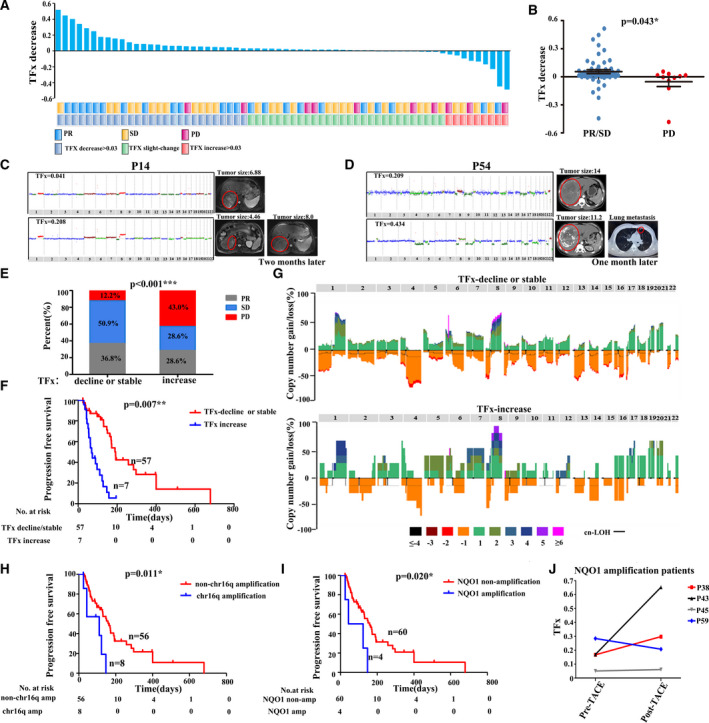
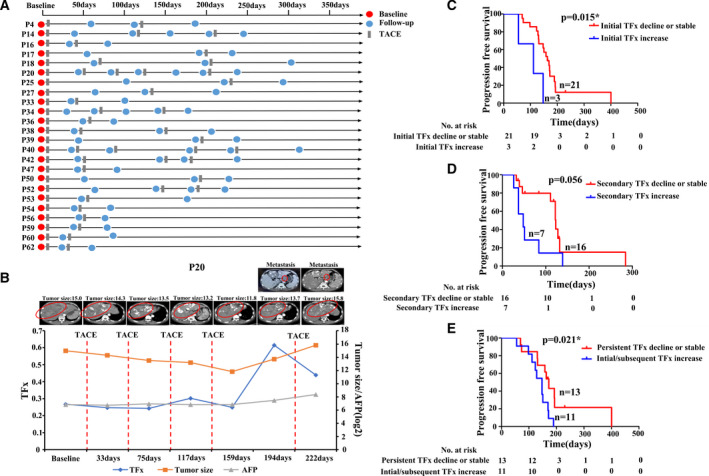
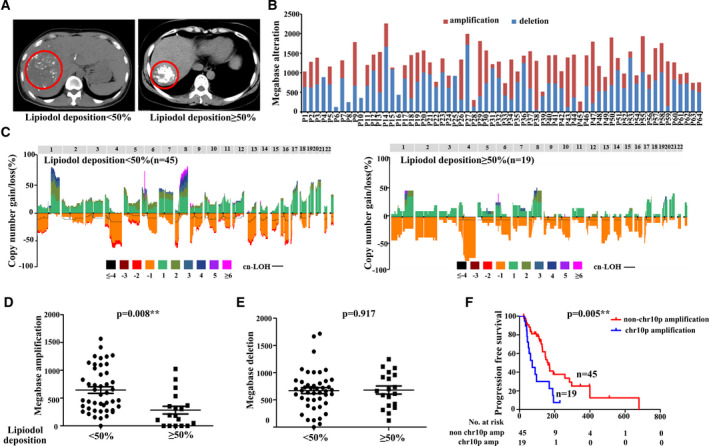
Transarterial chemoembolization (TACE) is the most commonly used treatment for advanced hepatocellular carcinoma (HCC), but still lacks accurate real-time biomarkers for monitoring its therapeutic efficacy. Here, we explored whether copy number profiling of circulating free DNA (cfDNA) could be utilized to predict responses and prognosis in HCC patients with TACE treatment. In total, 266 plasma cfDNA samples were collected from 64 HCC patients, 57 liver cirrhosis (LC) patients and 32 healthy volunteers. We performed low-depth whole-genome sequencing (LD-WGS) on cfDNA samples to conduct copy number variant (CNV) analysis and tumour fraction (TFx) quantification. Then, the correlation between TFx/CNVs and therapeutic efficacy, treatment outcomes and lipiodol deposition were explored. The change in TFx during TACE treatment was associated with patients' tumour burden, and could accurately and earlier predict treatment response and prognosis, providing an alternative strategy other than mRECIST. Meanwhile, the chromosomal 16q/NQO1 amplification indicated worse therapeutic response; in patients who underwent multiple TACE sessions, TFx change during their first TACE treatment reflected the long-term survival; additionally, the copy number amplification of chromosome 1q, 3p, 6p, 8q, 10p, 12q, 18p or 18q affected lipiodol deposition. Overall, we have provided a new liquid biopsy approach for future TACE management of HCC patients.
Keywords: circulating free DNA; copy number variants; hepatocellular carcinoma; transarterial chemoembolization; tumour fraction.
© 2021 The Authors. Molecular Oncology published by John Wiley & Sons Ltd on behalf of Federation of European Biochemical Societies.
Conflict of interest statement
The authors declare no potential conflicts of interest.
Figures
Similar articles
-
Multiple-level copy number variations in cell-free DNA for prognostic prediction of HCC with radical treatments.Cancer Sci. 2021 Nov;112(11):4772-4784. doi: 10.1111/cas.15128. Epub 2021 Sep 14. Cancer Sci. 2021. PMID: 34490703 Free PMC article.
-
Tumor vascularity and lipiodol deposition as early radiological markers for predicting risk of disease progression in patients with unresectable hepatocellular carcinoma after transarterial chemoembolization.Oncotarget. 2016 Feb 9;7(6):7241-52. doi: 10.18632/oncotarget.6892. Oncotarget. 2016. PMID: 26769845 Free PMC article. Clinical Trial.
-
Lipiodol deposition in portal vein tumour thrombus predicts treatment outcome in HCC patients after transarterial chemoembolisation.Eur Radiol. 2019 Nov;29(11):5752-5762. doi: 10.1007/s00330-019-06157-0. Epub 2019 Apr 16. Eur Radiol. 2019. PMID: 30993438
-
Transarterial chemoembolization using drug eluting beads for the treatment of hepatocellular carcinoma: Now and future.Clin Mol Hepatol. 2015 Dec;21(4):344-8. doi: 10.3350/cmh.2015.21.4.344. Epub 2015 Dec 24. Clin Mol Hepatol. 2015. PMID: 26770921 Free PMC article. Review.
-
Transarterial chemoembolization of hepatocellular carcinoma. Agents and drugs: an overview. Part 1.Expert Opin Drug Deliv. 2013 May;10(5):679-90. doi: 10.1517/17425247.2013.770733. Epub 2013 Feb 13. Expert Opin Drug Deliv. 2013. PMID: 23406440 Review.
Cited by
-
Vessels That Encapsulate Tumor Clusters (VETC) Predict cTACE Response in Hepatocellular Carcinoma.J Hepatocell Carcinoma. 2023 Mar 7;10:383-397. doi: 10.2147/JHC.S395903. eCollection 2023. J Hepatocell Carcinoma. 2023. PMID: 36915392 Free PMC article.
-
Enhanced interactions within microenvironment accelerates dismal prognosis in HBV-related HCC after TACE.Hepatol Commun. 2024 Oct 3;8(10):e0548. doi: 10.1097/HC9.0000000000000548. eCollection 2024 Oct 1. Hepatol Commun. 2024. PMID: 39365124 Free PMC article.
-
Prognostic Role of Molecular and Imaging Biomarkers for Predicting Advanced Hepatocellular Carcinoma Treatment Efficacy.Cancers (Basel). 2022 Sep 24;14(19):4647. doi: 10.3390/cancers14194647. Cancers (Basel). 2022. PMID: 36230569 Free PMC article. Review.
-
Prognostic value of ultra-low-pass whole-genome sequencing of circulating tumor DNA in hepatocellular carcinoma under systemic treatment.Clin Mol Hepatol. 2024 Apr;30(2):177-190. doi: 10.3350/cmh.2023.0426. Epub 2023 Dec 29. Clin Mol Hepatol. 2024. PMID: 38163441 Free PMC article.
-
Circulating Virus-Host Chimera DNAs in the Clinical Monitoring of Virus-Related Cancers.Cancers (Basel). 2022 May 20;14(10):2531. doi: 10.3390/cancers14102531. Cancers (Basel). 2022. PMID: 35626135 Free PMC article. Review.
References
-
- Bray F, Ferlay J, Soerjomataram I, Siegel R, Torre L, Jemal A. Erratum: Global cancer statistics 2018: GLOBOCAN estimates of incidence and mortality worldwide for 36 cancers in 185 countries. CA Cancer J Clin. 2020;70:313. - PubMed
-
- Jiang P, Chan KA, Lo YD. Liver‐derived cell‐free nucleic acids in plasma: Biology and applications in liquid biopsies. J Hepatol. 2019;71:409–21. - PubMed
Publication types
MeSH terms
Substances
LinkOut - more resources
Full Text Sources
Medical
Research Materials
Miscellaneous
