. 2021 Dec 21;5(3):e202101185.
doi: 10.26508/lsa.202101185. Print 2022 Mar.

Amyloid-like aggregating proteins cause lysosomal defects in neurons via gain-of-function toxicity

Affiliations

Amyloid-like aggregating proteins cause lysosomal defects in neurons via gain-of-function toxicity

Irene Riera-Tur et al. Life Sci Alliance. .

Abstract

The autophagy-lysosomal pathway is impaired in many neurodegenerative diseases characterized by protein aggregation, but the link between aggregation and lysosomal dysfunction remains poorly understood. Here, we combine cryo-electron tomography, proteomics, and cell biology studies to investigate the effects of protein aggregates in primary neurons. We use artificial amyloid-like β-sheet proteins (β proteins) to focus on the gain-of-function aspect of aggregation. These proteins form fibrillar aggregates and cause neurotoxicity. We show that late stages of autophagy are impaired by the aggregates, resulting in lysosomal alterations reminiscent of lysosomal storage disorders. Mechanistically, β proteins interact with and sequester AP-3 μ1, a subunit of the AP-3 adaptor complex involved in protein trafficking to lysosomal organelles. This leads to destabilization of the AP-3 complex, missorting of AP-3 cargo, and lysosomal defects. Restoring AP-3μ1 expression ameliorates neurotoxicity caused by β proteins. Altogether, our results highlight the link between protein aggregation, lysosomal impairments, and neurotoxicity.


Conflict of interest statement

The authors declare that they have no conflict of interest.

Figures
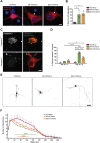
Figure 1.
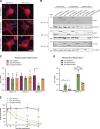
Figure 1.. β proteins aggregate and cause toxicity in transfected primary neurons.
(A) Transfected cortical neurons at DIV 10+1. Arrowheads point to β protein aggregates. (B) Percentage of transfected neurons bearing aggregates at DIV 10+1 (n = 3 independent experiments, 25–45 cells/condition/experiment; one-way ANOVA with Dunnett’s post hoc test). (C) Examples of DIV 10+1 β23-mCherry neurons positive (top) and negative (bottom) for cleaved caspase-3. (D) Percentage of transfected neurons positive for cleaved caspase-3 (n = 3 independent experiments, 25–45 cells/condition/experiment; two-way ANOVA with Tukey’s post hoc test). (E) Examples of DIV 10+2 primary hippocampal neurons transfected with mCherry (left), β4-mCherry (middle), or β23-mCherry (right). Images are colour-inverted with mCherry fluorescence shown in black. Note that the β protein cells have fewer primary dendrites. (F) Sholl analysis reveals reduced dendritic complexity in the presence of β proteins (n = 3 independent experiments, 10–30 cells/condition/experiment; two-way ANOVA with Tukey’s post hoc test). Scale bars, 5 μm in (A and C); 50 μm in (E). Data information: Data are presented as mean ± SD. *P < 0.05; ***P < 0.001; ****P < 0.0001.
Figure S1.
Figure S1.. Lentiviral transduction of β proteins leads to aggregation and toxicity in primary neurons.
(A) Primary cortical neurons transduced with mCherry or with β proteins at indicated time points. Transduced proteins were visualized by myc staining. Insets show examples of β protein aggregates. (B) Western blot showing mCherry and β proteins in the whole cell extract, soluble, and insoluble fraction of lentivirally transduced neurons at DIV 10+3 (top), DIV 10+4 (middle), and DIV 10+6 (bottom). Tubulin was used as a loading control. (C, D) Quantification of mCherry, β4-mCherry, and β23-mCherry levels in the soluble (C) and insoluble (D) fraction (n = 3 independent DIV 10+3 cultures, four independent DIV 10+4 cultures, and three independent DIV 10+6 cultures; (C), one-way ANOVA with Dunnett’s post hoc test; (D), two-way ANOVA with Sidak’s post hoc test). (E) Quantification of neuronal survival determined by MTT assay at the indicated time points (n = 4 independent experiments; two-way ANOVA with Tukey’s post hoc test). Scale bar in (A), 5 μm. Data information: Data are presented as mean ± SD. *P < 0.05; **P < 0.01; ***P < 0.001; ****P < 0.0001.
Figure S2.
Figure S2.. Cryo-electron tomography sample preparation workflow.
(A) Vitrified cells on EM grids are imaged by cryo-light microscopy and cells of interest are identified. (B) Grids are transferred to a cryo-FIB/scanning electron microscope and positions of cells of interest are found via cryo-light microscopy/cryo-scanning electron microscopy correlation. (C, D) Cells are thinned to a thickness of max. 200 nm by means of FIB milling. (E) Grids are transferred to a cryo-transmission electron microscope and regions of interest are identified via cryo-light microscopy/cryo-transmission electron microscopy correlation. (F) Regions of interest are imaged by cryo-electron tomography. IC, ice contamination; Pt, platinum coating. Scale bars in (A), 500 μm; (B), 50 μm; (C, D), 10 μm; (E), 3 μm; (F), 200 nm.
Figure 2.
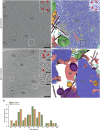
Figure 2.. Ultrastructure of β protein aggregates in primary neurons.
(A) Tomographic slice of a β4-mCherry aggregate in transfected DIV 6+1 cortical neurons. (B) 3D rendering of the tomogram shown in (A). (C) Tomographic slice of two β23-mCherry aggregates in neurons. (D) 3D rendering of the tomogram shown in (C). The areas marked by the boxes are magnified in the insets. Red arrowheads point to β protein fibrils. White arrowheads point to intracellular membranes. Note that intracellular membranes in contact with β protein fibrils (middle inset in C) are not deformed and do not differ from membranes that are not in direct contact with aggregates (lower inset in C). Agg, β protein aggregate; En, endosome; ER, endoplasmic reticulum; Lys, lysosome; Mit, mitochondrion. Black arrow in (D) indicates ER - mitochondria contact site. β protein fibrils, blue; mitochondria, green; ER membranes, salmon; endosome, gold; vesicles, cyan; ribosomes, yellow; microtubules, brown. (E) Histogram of β4-mCherry and β23-mCherry fibril diameters (n = 30 β4-mCherry fibrils and 30 β23-mCherry fibrils, from three tomograms each). Scale bars in (A, C), 200 and 50 nm (insets).
Figure S3.
Figure S3.. Aggregate morphology and cellular interactions in HeLa cells.
(A) Tomogram of a β23-mCherry aggregate in a HeLa cell 24 h after transfection. Red arrowheads point to β23 fibrils (insets). White arrowhead points to intracellular membranes (lower inset). Agg, β protein aggregate; ER, endoplasmic reticulum; Lys, lysosome; Mit, mitochondrion. (B) 3D rendering of the tomogram shown in (A). ER membranes are found in close proximity to both aggregates and mitochondrial and lysosomal membranes. Black arrows indicate ER–mitochondria contact sites. β23-mCherry fibrils, blue; mitochondria, green; ER membranes, salmon; lysosomes, purple; vesicles, cyan; microtubules, brown. Scale bars in (A), 200 and 50 nm (insets).
Figure S4.
Figure S4.. Gallery of lysosomal morphologies.
(A, B, C, D, E, F, G, H, I) Tomograms from neurons transfected with mCherry (A, B, C), β4-mCherry (D, E, F), and β23-mCherry (G, H, I). Note that in cells with β protein aggregates (D, E, F, G, H, I), lysosomes often contain extensive stacks of membranes. Inset in (E) shows an example of an early autophagosome. Agg, β protein aggregate; AS, autophagosome; En, endosome; ER, endoplasmic reticulum; LD, lipid droplet; LE, late endosome; Lys, lysosome; Mit, mitochondrion; PM, plasma membrane. Scale bars in (A, B, C, D, E, F, G, H, I) 200 nm; inset in (E), 100 nm.
Figure 3.
Figure 3.. Aberrant lysosomal ultrastructure in β protein–expressing neurons.
(A) Example of a lysosome in a tomogram from a DIV 6+1 cortical neuron transfected with mCherry. (B) 3D rendering of the tomogram shown in (A). (C) Example of a lysosome in a neuron transfected with β4-mCherry. Note the presence of abundant membrane stacks and electron-dense material within the lysosome. (D) 3D rendering of the tomogram shown (C). En, endosome; ER, endoplasmic reticulum; LE, late endosome; Lys, lysosome; Mit, mitochondrion; PM, plasma membrane. Lysosomal membrane, purple; membrane stacks within the lysosomes, green; intraluminal vesicles, gold; other cellular membranes, grey. For additional examples see Fig S4. Scale bars in (A, C), 200 nm.
Figure 4.
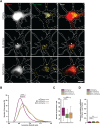
Figure 4.. Defects of lysosomal morphology in the presence of β proteins.
(A) Fluorescence images of DIV 6+1 primary cortical neurons transfected with mCherry (top), β4-mCherry (middle), or β23-mCherry (bottom) and incubated with LysoTracker Green. White dashed lines show the contours of the neurons. Arrowheads point to β protein aggregates. Yellow circles outline lysosomes. (B) Distribution of the lysosomal size in control and β protein–expressing neurons (mCherry, n = 2,148 lysosomes from 36 cells; β4-mCherry, n = 1,595 lysosomes from 44 cells; β23-mCherry, n = 1,838 lysosomes from 46 cells; from four independent experiments; two-tailed Mann–Whitney test). (C) Box plot showing the number of lysosomes per neuron (mCherry, n = 36 cells; β4-mCherry, n = 44 cells; β23-mCherry, n = 46 cells; from four independent experiments; two-tailed Mann–Whitney test). (D) Quantification of Person’s correlation coefficient between the mCherry and LysoTracker signal (n = 36 mCherry cells, 39 β4-mCherry cells, 36 β23-mCherry cells; one-way ANOVA with Tukey’s post hoc test). Scale bar in (A), 10 μm. Data information: Data in (C) are presented as box plots with whiskers indicating minimal and maximal values. Data in (D) are presented as mean ± SD. **P < 0.01; ***P < 0.001; n.s., not significant.
Figure S5.
Figure S5.. Expression of β23-mCherry in HeLa cells and myc-β4 in primary neurons.
(A) HeLa cells transfected with mCherry or β23-mCherry. Nuclei were labelled with DAPI. Arrows point to β23-mCherry aggregates. (B) Examples of DIV 10+1 cortical neurons transfected with the indicated constructs and stained against myc. Nuclei were labelled with DAPI. Arrow points to aggregated myc-β4. (C) Quantification of the fraction of transfected neurons positive for cleaved caspase-3 at the indicated time points (n = 2 independent cultures at DIV 10+1 and three independent cultures at DIV 10+3; 15–50 cells/condition/experiment; two-way ANOVA with Bonferroni post hoc test). Scale bars: 50 μm in (A); 10 μm in (B). Data information: Data are presented as mean ± SD. **P < 0.01.
Figure 5.
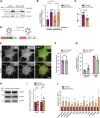
Figure 5.. β proteins impair autophagy.
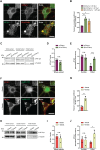
(A) Western blot for LC3B-II in HeLa cell lysates under control conditions and upon treatment with 50 μM chloroquine. Tubulin was used as a loading control. (B) Quantification of LC3B-II levels. All conditions were normalized to mCherry (n = 6 independent experiments; one-way ANOVA with Tukey’s multiple-comparisons test). (C) Quantification of the ratio of LC3B-II levels in cells treated or not treated with chloroquine. Same data were analyzed as shown in (B) (n = 6 independent experiments; two-tailed t test with Welch’s correction). (D) mCherry-GFP-LC3 reporter appears yellow in non-acidic and red in acidic organelles due to quenching of GFP fluorescence at low pH. (E) Single plane images of the reporter signal in DIV 10+3 neuronal cultures transfected with myc-α-S824 (top) and myc-β4 (bottom). Examples of non-acidic and acidic organelles are indicated with white and blue boxes, respectively, and shown at higher magnification in the insets. (F) Quantification of the total number of reporter puncta per cell (n = 4 independent experiments; 15–45 cells/condition/experiment; two-tailed t test with Welch correction). (G) Quantification of the fraction of non-acidic (yellow) and acidic (red only) puncta. Same cells were analyzed as in (F) (two-way ANOVA with Sidak’s post hoc test). (H) Western blots for early autophagy markers in lysates of HeLa cells transfected with mCherry or β23-mCherry. HPRT was used as a loading control. (I) Western blot quantification (n = 5 independent experiments; two-tailed t test). (J) Transcript levels of lysosomal genes in mCherry or β23-mCherry HeLa cells determined with RT-PCR (n = 6 experiments; two-tailed t test). Scale bar in (E), 5 μm. Data information: Data are presented as mean ± SD. *P < 0.05; **P < 0.01; ***P < 0.001; n.s., not significant.
Figure 6.
Figure 6.. β protein interactome in primary neurons.
(A) Venn diagram depicting numbers and overlap of interactors for the three β proteins investigated. (B, C, D) Volcano plots depicting proteins significantly enriched in β protein immunoprecipitates. Red dots denote proteins that pass 5% permutation-based false discovery rate (curved line on the right; proteins significantly associated with mCherry are not highlighted for the interactomes). (E) Heat map of common interactors of all three β proteins. (F, G, H) Pie charts showing the quantitative composition of β protein–interacting complexes.
Figure S6.
Figure S6.. GO annotations and bioinformatic characterization of β protein interactors.
(A, B, C) Pathway enrichment analysis of interactors of β4-mCherry (A), β17-mCherry (B) and β23-mCherry (C). (D) Box plots of low-complexity regions content in all identified proteins and in β protein interactors (n = 4 independent experiments; two-sample Wilcoxon test). aa, amino acids. Data information: Data in (D) are presented as box plots with whiskers indicating ± 1.5 interquartile range. **P < 0.01; ****P < 0.0001; n.s., not significant.
Figure S7.
Figure S7.. Total proteome of β protein–expressing neurons.
(A) Numbers of identified proteins in all conditions together, and in neurons transduced with the indicated constructs (n = 4 independent experiments). (B, C, D) Volcano plots of the total proteome of β protein compared to mCherry neurons. Significantly regulated proteins are shown in red; Interactors of the respective β protein in black; AP-3μ1 is highlighted in green. (E) Co-immunoprecipitation of β proteins with endogenous AP-3μ1. Lanes on the blot between input and IP were digitally removed. Asterisk marks IgG heavy chain band. (F) Abundance ranking of all identified proteins in the whole proteome. AP-3μ1 (indicated in green) is at position 1,296. Hsp90 (red) is shown as an example of a highly abundant protein. (G) Western blot of endogenous Lamp1 in lysates of primary neuronal cultures transduced with the indicated constructs. Tubulin was used as a loading control. β4-mCherry, 105.25 ± 37.2% of control; β4-mCherry, 104.8 ± 22.8% of control; n = 2 independent experiments. Data information: Data in (A) are presented as mean ± SD.
Figure 7.
Figure 7.. AP-3μ1 is sequestered by aggregates, leading to defects of AP-3 complex.
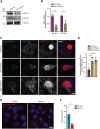
(A) Single confocal plane images of DIV 10+2 cortical neurons co-transfected with Flag-AP-3μ1 and either mCherry (top), or β4-mCherry (bottom). Anti-Flag staining was used to detect AP-3μ1. Areas marked by the boxes are magnified in the insets. (B) Quantification of Pearson’s correlation coefficient between the AP-3μ1 and mCherry signal (n = 3 independent experiments, 20–30 cells/condition/experiment; one-way ANOVA with Tukey’s post hoc test). (C) Western blots for AP-3μ1 in whole lysates (left), Triton X–soluble fraction (middle), and pellet fraction (right) of DIV 10+6 primary neurons transduced with mCherry or β4-mCherry. Tubulin was used as a loading control. (D, E) Quantification of (C). Levels of AP-3μ1 in the whole extract were normalized to tubulin. Levels of AP-3μ1 in the soluble and pellet fractions were normalized to its levels in the whole extract (n = 4 independent cultures; (D), two-tailed t test with Welch’s correction; (E), two-way ANOVA with Sidak’s post hoc test). (F) Single confocal plane images of DIV 10+7 cortical neurons transduced with TauRD-EYFP, and treated with TauRD seeds (bottom) or PBS (top) on DIV 10+3. Areas marked by the boxes are magnified in the insets. (G) Quantification of Pearson’s correlation coefficient between endogenous AP-3μ1 and TauRD-EYFP (n = 3 independent experiments, 20–30 cells/condition/experiment; two-tailed t test with Welch’s correction). (H) Western blots for AP-3μ1 in whole lysates (left), Triton X–soluble fraction (middle) and pellet fraction (right) of DIV 10+7 cortical neurons transduced with TauRD-EYFP and treated or not treated with TauRD seeds. Tubulin was used as a loading control. (I, J) Quantification of (H). Levels of AP-3μ1 in the whole extract were normalized to tubulin. Levels of AP-3μ1 in the soluble and pellet fractions were normalized to its levels in the whole extract (n = 3 independent cultures; (I), two-tailed t test with Welch’s correction; (J), two-way ANOVA with Sidak’s post hoc test). Scale bars in (A, F), 10 μm. Data information: Data are presented as mean ± SD. *P < 0.05, **P < 0.01, ***P < 0.001, n.s., not significant.
Figure 8.
Figure 8.. Dysfunction of the AP-3 complex causes missorting of Lamp1 and lysosomal defects.
(A) Western blots for AP-3δ1 and AP-3σ1 in whole lysates of DIV 10+6 primary neurons transduced with mCherry or β4-mCherry. Asterisk marks an unspecific band. Tubulin was used as a loading control. (B) Quantification of (A) (n = 3 independent cultures; two-tailed t test with Welch’s correction). (C) Maximum intensity projections of DIV 10+4 neurons transduced with mCherry (top), β4-mCherry (middle), or β23-mCherry (bottom) and stained for surface (green) and total (blue) Lamp1. (D) Quantification of Pearson’s correlation coefficient between surface and total Lamp1 signal (n = 6 independent experiments at DIV 10+4 and DIV 10+5, 25 cells/condition/experiment; one-way ANOVA with Dunnett’s post hoc test). (E) Fluorescent images of control (left) and mocha cells (right) incubated with LysoTracker Red. Nuclei were labelled with DAPI (blue). (F) Quantification of lysosome numbers per cell (n = 4 independent experiments; at least 100 cells/condition/experiment; two-tailed t test with Welch’s correction). Scale bars; (C), 10 μm; (E), 20 μm. Data information: Data are presented as mean ± SD. *P < 0.05, **P < 0.01, ***P < 0.001.
Figure S8.
Figure S8.. AP-3μ1 levels are reduced in mocha cells, and overexpression of AP-3μ1 rescues β protein toxicity in neurons.
(A) Fluorescent images of control (left) and mocha cells (right) immunostained for AP-3μ1. Nuclei were labelled with DAPI. (B) Western blots for the indicated AP-3 subunits. Tubulin was used as loading control. (C) Quantification of AP-3μ1 protein levels in mocha cells. Values were normalized to control cells (n = 3 independent experiments). (D) Examples of cleaved caspase-3 staining in DIV 6+1 cortical neurons co-transfected with β23-mCherry and either EGFP (top) or Flag-AP-3μ1 (bottom). Anti-Flag staining was used to detect AP-3μ1. Arrows point to cleaved caspase-3–positive cells. (E) Percentage of double-transfected neurons positive for cleaved caspase-3 (n = 3 independent experiments; 10–60 cells/condition/experiment; two-tailed t test). Scale bars: (A), 20 μm; (D), 50 μm. Data information: Data are presented as mean ± SD. *P < 0.05.

Similar articles

Cited by

References

    1. Abeliovich A, Gitler AD (2016) Defects in trafficking bridge Parkinson's disease pathology and genetics. Nature 539: 207–216. 10.1038/nature20414 - DOI - PubMed
    1. Abraham R, Hendy R, Grasso P (1968) Formation of myeloid bodies in rat liver lysosomes after chloroquine administration. Exp Mol Pathol 9: 212–229. 10.1016/0014-4800(68)90037-3 - DOI - PubMed
    1. Armstrong L, Biancheri R, Shyr C, Rossi A, Sinclair G, Ross CJ, Tarailo-Graovac M, Wasserman WW, van Karnebeek CD (2014) AIMP1 deficiency presents as a cortical neurodegenerative disease with infantile onset. Neurogenetics 15: 157–159. 10.1007/s10048-014-0411-3 - DOI - PubMed
    1. Arrasate M, Finkbeiner S (2012) Protein aggregates in Huntington's disease. Exp Neurol 238: 1–11. 10.1016/j.expneurol.2011.12.013 - DOI - PMC - PubMed
    1. Bäuerlein FJB, Saha I, Mishra A, Kalemanov M, Martínez-Sánchez A, Klein R, Dudanova I, Hipp MS, Hartl FU, Baumeister W, et al. (2017) In situ architecture and cellular interactions of polyQ inclusions. Cell 171: 179–187.e10. 10.1016/j.cell.2017.08.009 - DOI - PubMed

Publication types

MeSH terms

Associated data

LinkOut - more resources