. 2021 Dec 3:9:760369.
doi: 10.3389/fcell.2021.760369. eCollection 2021.

DNA Methylation Modification Map to Predict Tumor Molecular Subtypes and Efficacy of Immunotherapy in Bladder Cancer

Affiliations

DNA Methylation Modification Map to Predict Tumor Molecular Subtypes and Efficacy of Immunotherapy in Bladder Cancer

Fangdie Ye et al. Front Cell Dev Biol. .

Abstract

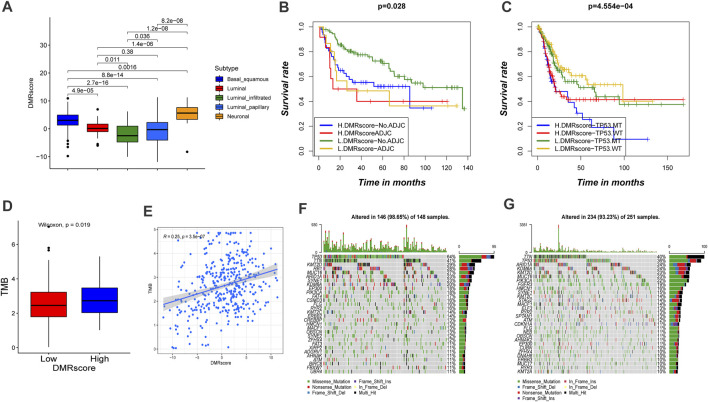
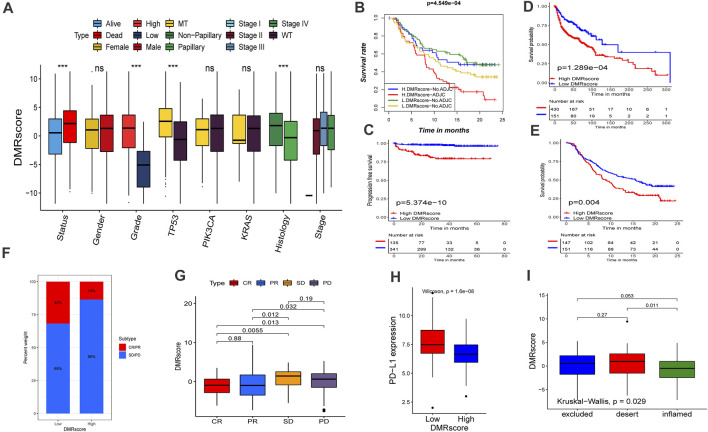
Background: Considering the heterogeneity and complexity of epigenetic regulation in bladder cancer, the underlying mechanisms of global DNA methylation modification in the immune microenvironment must be investigated to predict the prognosis outcomes and clinical response to immunotherapy. Methods: We systematically assessed the DNA methylation modes of 985 integrated bladder cancer samples with the unsupervised clustering algorithm. Subsequently, these DNA methylation modes were analyzed for their correlations with features of the immune microenvironment. The principal analysis algorithm was performed to calculate the DMRscores of each samples for qualification analysis. Findings: Three DNA methylation modes were revealed among 985 bladder cancer samples, and these modes are related to diverse clinical outcomes and several immune microenvironment phenotypes, e.g., immune-desert, immune-inflamed, and immune-excluded ones. Then patients were classified into high- and low-DMRscore subgroups according to the DMRscore, which was calculated based on the expression of DNA methylation related genes (DMRGs). Patients with the low-DMRscore subgroup presented a prominent survival advantage that was significantly correlated to the immune-inflamed phenotype. Further analysis revealed that patients with low DMRscores exhibited less TP53 wild mutation, lower cancer stage and molecular subtypes were mainly papillary subtypes. In addition, an independent immunotherapy cohort confirmed that DMRscore could serve as a signature to predict prognosis outcomes and immune responses. Conclusion: Global DNA methylation modes can be used to predict the immunophenotypes, aggressiveness, and immune responses of bladder cancer. DNA methylation status assessments will strengthen our insights into the features of the immune microenvironment and promote the development of more effective treatment strategies.

Keywords: DNA methylation regulators; bladder cancer; immunotherapy; prognostic model; tumor microenvironment.


Conflict of interest statement

The authors declare that the research was conducted in the absence of any commercial or financial relationships that could be construed as a potential conflict of interest.

Figures

FIGURE 1
FIGURE 1
Landscape of genetic alteration and transcriptome variation of DNA methylation regulators in bladder cancer. (A) The alteration frequency of 15 DNA methylation regulators in 412 bladder cancer samples (TCGA-BLCA). the annotation of each variant types was displayed by the bagplots right barplots. Each cohort represented an individual sample. The stacked barplot below displayed conversion ratio for each sample. (B) The location of CNV alteration of DNA methylation regulators on 23 chromosomes was displayed by circular plot. (C) Principal component analysis (PCA) for the transcriptome characteristics of 15 DNA methylation regulators to distinguish tumors from normal samples in GSE13507 cohort. Tumor samples were labeled with blue color and normal samples were labeled with yellow. (D) The frequency of copy number variation in TCGA-BLCA cohort. Deletion frequency: the green dot and amplification frequency: red dot. The number represented the variation frequency. (E) The transcriptome characteristics of 15 DNA methylation regulators between normal and bladder cancer tissues. Tumor: red box; Normal: blue box. The median value: black lines in boxes, the outliers: black dots out boxes. The asterisks represented the statistical p value (*p < 0.05; **p < 0.01; ***p < 0.001).
FIGURE 2
FIGURE 2
Clusters of DNA methylation modes and biological profiles of each cluster. A Kaplan-Meier curve with p value 0.032 displayed a remarkable difference among three DNA methylation modes, the DMRcluster B presented a remarkable poor clinical outcome. DMRcluster (A): 306 samples, DMRcluster (B): 348 samples and DMRcluster (C): 331 samples. The meta cohort including 985 samples (GSE13507, GSE31684, GSE32548, GSE48075, GSE48476, GSE80691 and TCGA-BLCA). (B) The interplay among DNA methylation regulators in bladder cancer. Red and gary represented readers and writers respectively. The size of circles displayed the influence of each regulator on clinical outcomes. The lines connecting regulators represented their interactions, and thickness represented the correlation strength. Negative correlation was labeled with blue and positive correlation was labeled with red. Risk factor: purple, favorable factor: green. (C) The proportion of molecular subtypes in the three DNA methylation modes (TCGA-BLCA). Basal squamous subtype, green; Luminal subtype, blue; luminal infiltrated subtype, red; luminal papillary subtype, yellow; and Neuronal subtype, olivedrab. (D) Principal component analysis (PCA) for the transcriptome characteristics of three DMRclusters. DMRcluster A was labeled with blue color, DMRcluster (B) was labeled with red color and DMRcluster (C) was labeled with green. (E,F) Gene set variant analysis displayed the activation status of biological pathways in diverse DMRclusters. The heatmap help us to observe the difference of biology pathway activity among three DMRclusters. Blue represented inhibited pathways and red represented activated pathway. (E) DMRcluster (A) vs. DMRcluster (B); F DMRcluster (B) vs. DMRcluster (C).
FIGURE 3
FIGURE 3
Tumor microenvironment characteristics and transcriptome profile in three DNA methylation modification modes. (A) stromal activation pathways among three different DNA methylation modification modes include EMT, angiogenesis and Pan-F-TBRS. (B) The content of each tumor microenvironment immune infiltrating cells in three DNA methylation modification modes. The median value: black lines in boxes, the outliers: black dots out boxes. (C) The heatmap help us to observe the expression level of DNA methylation regulators among different DMRclusters (TCGA-BLCA cohort). DMRcluster subtypes, Molecular subtypes, Histology, Grade, Stage, Gender, Age and Survival status were used as patient annotations. Red represented high expression level of DNA methylation regulators and blue represented low expression level. (D) Functional annotation for DNA methylation-related genes. Red represented more enriched genes and blue represented a small number of enriched genes.
FIGURE 4
FIGURE 4
Construction of DNA methylation signatures for individual sample. (A) The heatmap help us to observe the transcriptome landscape among different Gene.clusters (TCGA-BLCA cohort). Gene.cluster subtypes, Molecular subtypes, Histology, Grade, Stage, Gender, Age and Survival status were used as patient annotations. Red represented high expression level and blue represented low expression level. B-C Differences in DMRscore among three DMRclusters (B) or Gene.clusters (C) in TCGA-BLCA cohort (Kruskal-Wallis test, p < 0.001). D-E Kaplan-Meier curve displayed a remarkable difference among three Gene. clusters ((D), p < 0.001) or DMRscore subgroups ((E), p < 0.001) in TCGA-BLCA cohort. (F) Sankey diagram displayed the alteration of DMRclusters, molecular subtypes, Gene.cluster and DMRscore. (G) The transcriptome characteristics of 15 DNA methylation regulators among Gene.clusters. Gene.cluster (A): blue box; Gene.cluster (B): red box. Gene.cluster C: green box. The median value: black lines in boxes, the outliers: black dots out boxes. (H) Differences in the known gene signatures between high DMRscore and low DMRscore subgroups. APC: antigen-presenting cells. The asterisks represented the statistical p value (*p < 0.05; **p < 0.01; ***p < 0.001).
FIGURE5
FIGURE5
Characteristics of DMRscore in TCGA molecular subtypes and tumor mutation burden. (A) Differences in DMRscore among diverse bladder cancer molecular subtypes. Basal squamous subtype, blue; Luminal subtype, red; luminal infiltrated subtype, green; luminal papillary subtype, sapphire; and Neuronal subtype, yellow. (B) Kaplan-Meier curve showed the clinical prognosis of patients with combination of DMRscore and adjuvant chemotherapy stratification. H, high. L, low. ADJC, adjuvant chemotherapy (p = 0.028). (C) Kaplan-Meier curve showed the clinical prognosis of patients with combination of DMRscore and TP53 stratification. H, high. L, low. MT, mutation type; WT, wild type (p < 0.001). (D) Difference in tumor mutation burden between high DMRscore and low DMRscore (p = 0.019). (E) Correlation between DMRscore and tumor mutation burden. (R = 0.25, p < 0.001) (F,G) The landscape of tumor somatic mutation in TCGA-BLCA established by high (F) and low DMRscore (G). Each column represented individual patients. The upper barplot displayed tumor mutation burden.
FIGURE 6
FIGURE 6
Role of DNA methylation modification in clinical prediction. (A) Differences in DMRscore among different clinical status. The median value: black lines in boxes, the outliers: black dots out boxes. MT, mutation type; WT, wild type. (B) Kaplan-Meier curve showed the clinical prognosis of patients with combination of DMRscore and NEO stratification. H, high. L, low. NEO, Newantigen burden (p < 0.001). (C) Survival analyses for high (135 samples) and low (341 samples) DMRscore subgroups in the E-MTAB-4321 cohort using Kaplan-Meier curves (p < 0.001). (D) Survival analyses for high (430 samples) and low (151 samples) DMRscore subgroups in the GEO-metacohort cohort using Kaplan-Meier curves (p < 0.001). (E) Survival analyses for high (147 samples) and low (151 samples) DMRscore subgroups in the anti-PD-L1 cohort (IMvigor210 cohort) using Kaplan-Meier curves (p = 0.004). (F,G) The proportion of patients with response to PD-L1 blockade immunotherapy in low or high DMRscore subgroups. SD, stable disease; PD, progressive disease; CR, complete response; PR, partial response. Responser/Nonresponer: 32%/68% in the low m6Ascore groups and 14%/86% in the high m6Ascore groups. H Differences in PD-L1 expression between low and high m6Ascore groups (p < 0.0001). L Differences in DMRscore among distinct tumor immune phenotypes in IMvigor210 cohort. (p = 0.029).

Similar articles

Cited by

References

    1. Barbie D. A., Tamayo P., Boehm J. S., Kim S. Y., Moody S. E., Dunn I. F., et al. (2009). Systematic RNA Interference Reveals that Oncogenic KRAS-Driven Cancers Require TBK1. Nature 462 (7269), 108–112. 10.1038/nature08460 - DOI - PMC - PubMed
    1. Charoentong P., Finotello F., Angelova M., Mayer C., Efremova M., Rieder D., et al. (2017). Pan-cancer Immunogenomic Analyses Reveal Genotype-Immunophenotype Relationships and Predictors of Response to Checkpoint Blockade. Cel Rep. 18 (1), 248–262. 10.1016/j.celrep.2016.12.019 - DOI - PubMed
    1. Chen X., Pan X., Zhang W., Guo H., Cheng S., He Q., et al. (2020). Epigenetic Strategies Synergize with PD-L1/pd-1 Targeted Cancer Immunotherapies to Enhance Antitumor Responses. Acta pharmaceutica Sinica B 10 (5), 723–733. 10.1016/j.apsb.2019.09.006 - DOI - PMC - PubMed
    1. Craig A. J., von Felden J., Garcia-Lezana T., Sarcognato S., Villanueva A. (2020). Tumour Evolution in Hepatocellular Carcinoma. Nat. Rev. Gastroenterol. Hepatol. 17 (3), 139–152. 10.1038/s41575-019-0229-4 - DOI - PubMed
    1. da Rocha S. T., Gendrel A.-V. (2019). The Influence of DNA Methylation on Monoallelic Expression. Essays Biochem. 63 (6), 663–676. 10.1042/ebc20190034 - DOI - PMC - PubMed