. 2021 Dec 2:12:744573.
doi: 10.3389/fimmu.2021.744573. eCollection 2021.

Committed Human CD23-Negative Light-Zone Germinal Center B Cells Delineate Transcriptional Program Supporting Plasma Cell Differentiation

Affiliations

Committed Human CD23-Negative Light-Zone Germinal Center B Cells Delineate Transcriptional Program Supporting Plasma Cell Differentiation

Kathleen Santamaria et al. Front Immunol. .

Abstract

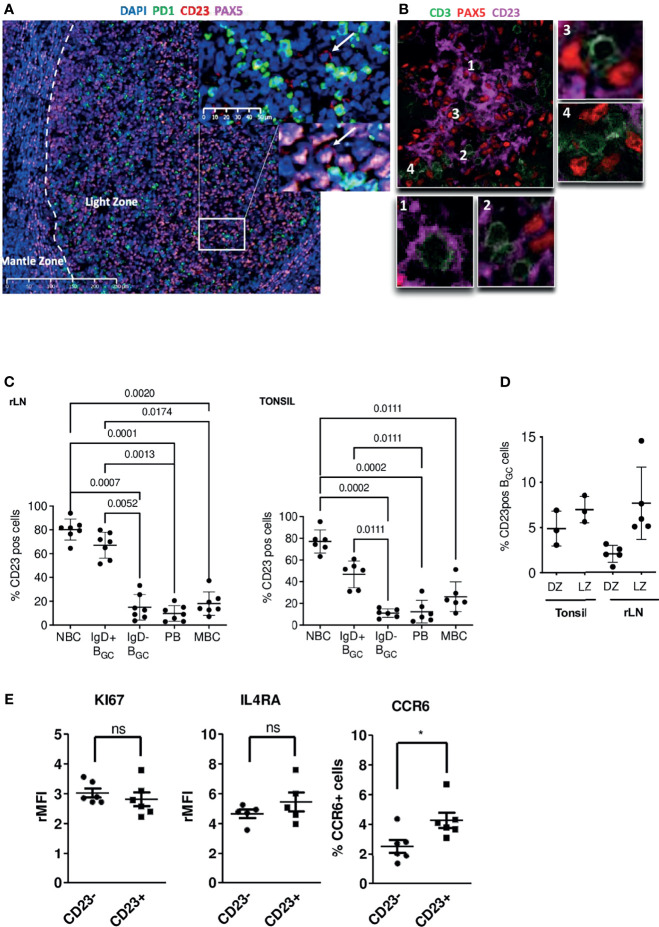
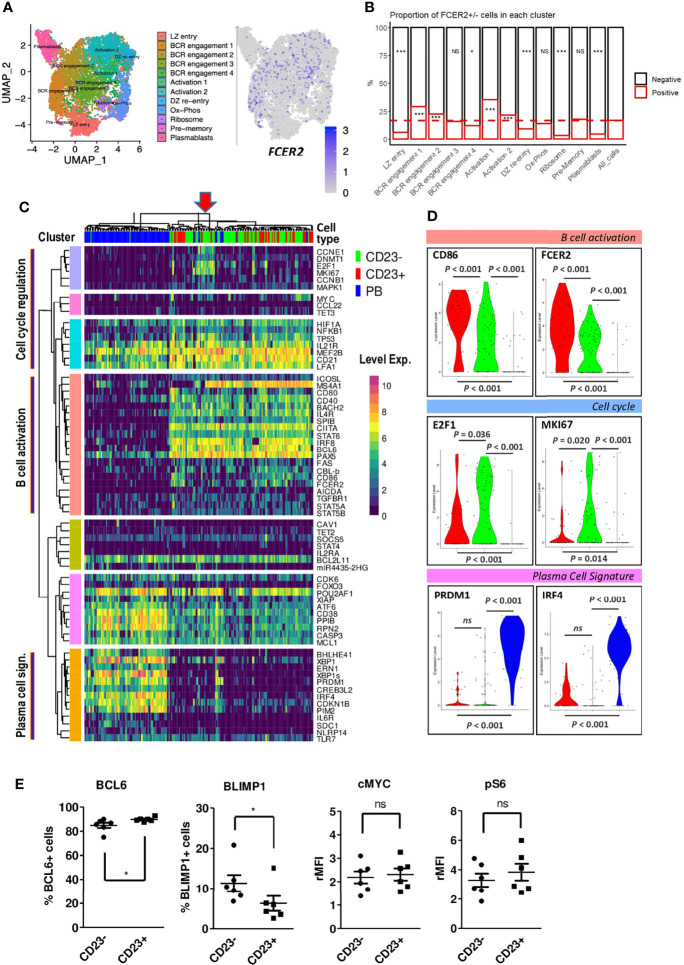
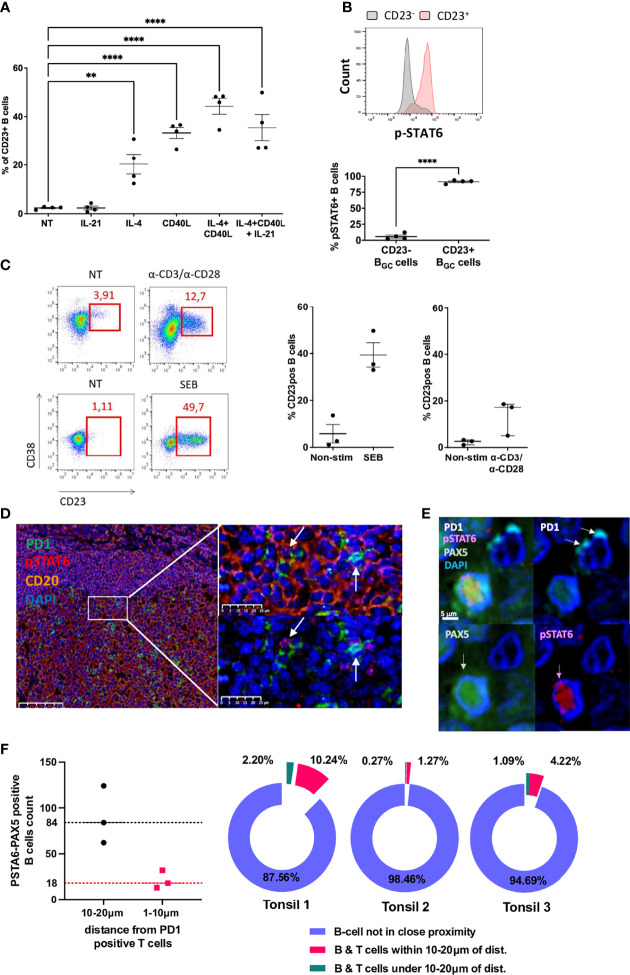
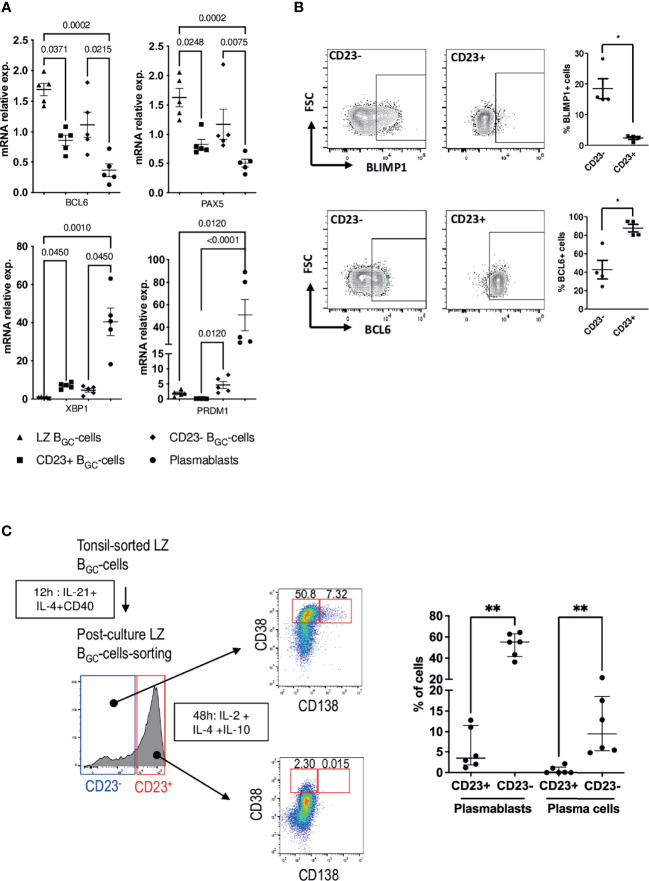
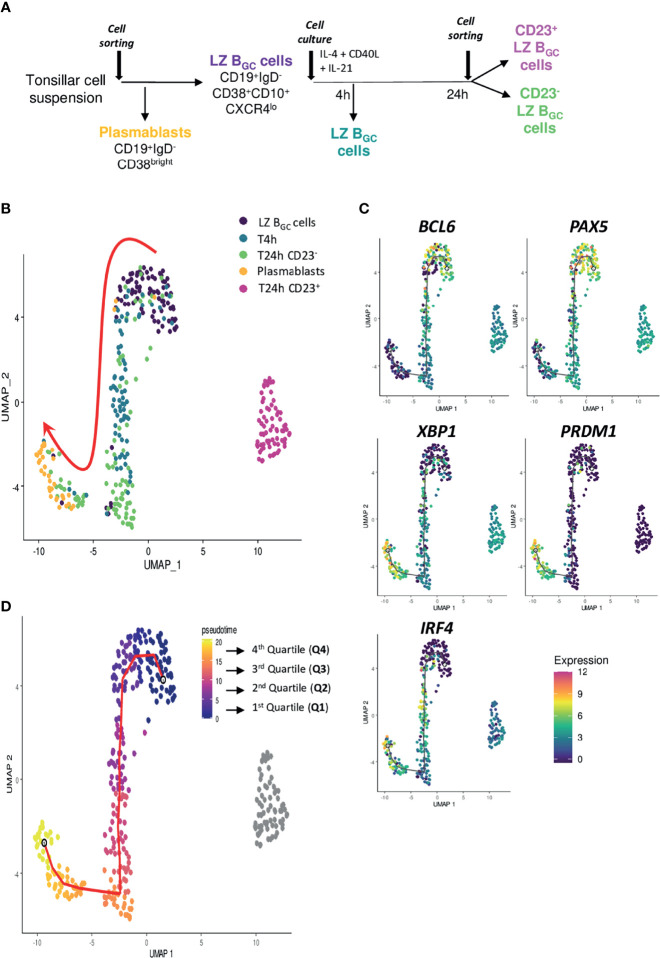
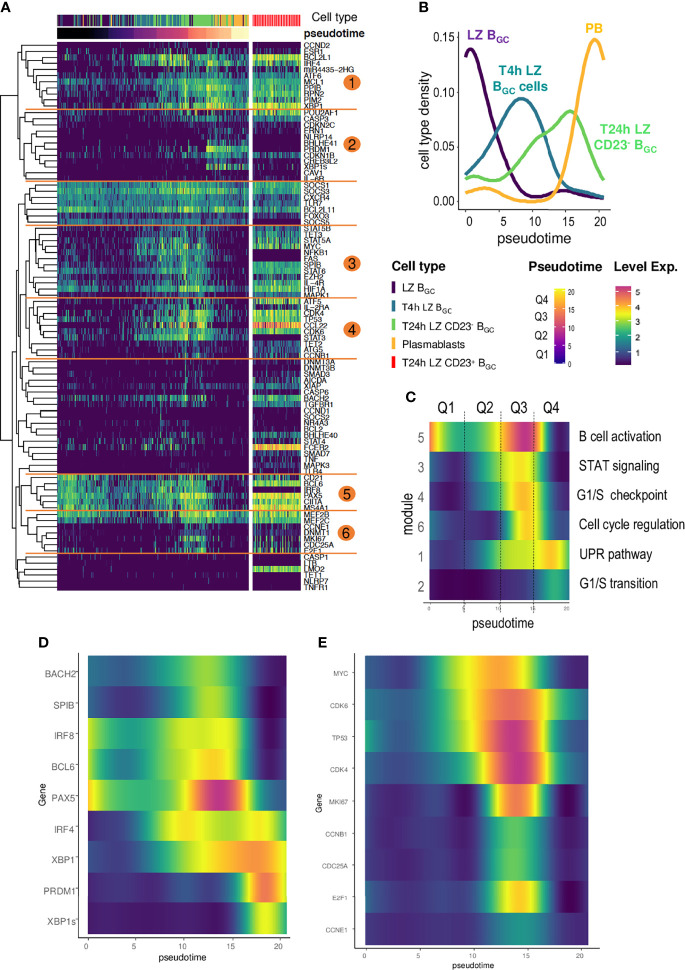
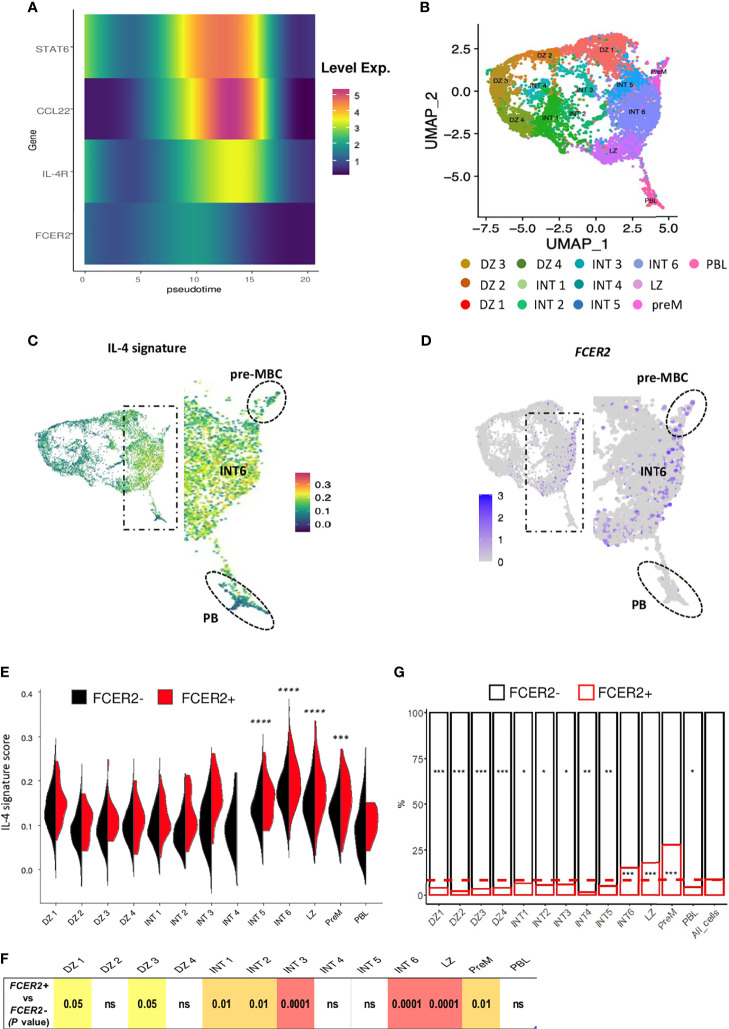
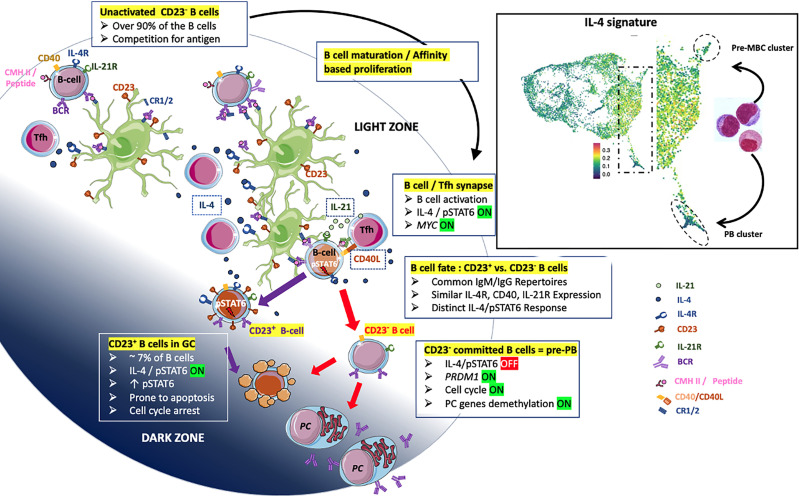
B cell affinity maturation occurs in the germinal center (GC). Light-zone (LZ) GC B cells (BGC-cells) interact with follicular dendritic cells (FDCs) and compete for the limited, sequential help from T follicular helper cells needed to escape from apoptosis and complete their differentiation. The highest-affinity LZ BGC-cells enter the cell cycle and differentiate into PCs, following a dramatic epigenetic reorganization that induces transcriptome changes in general and the expression of the PRDM1 gene in particular. Human PC precursors are characterized by the loss of IL-4/STAT6 signaling and the absence of CD23 expression. Here, we studied the fate of human LZ BGC-cells as a function of their CD23 expression. We first showed that CD23 expression was restricted to the GC LZ, where it was primarily expressed by FDCs; less than 10% of tonsil LZ BGC-cells were positive. Sorted LZ BGC-cells left in culture and stimulated upregulated CD23 expression but were unable to differentiate into PCs - in contrast to cells that did not upregulate CD23 expression. An in-depth analysis (including single-cell gene expression) showed that stimulated CD23-negative LZ BGC-cells differentiated into plasmablasts and time course of gene expression changes delineates the transcriptional program that sustains PC differentiation. In particular, we identified a B cell proliferation signature supported by a transient MYC gene expression. Overall, the CD23 marker might be of value in answering questions about the differentiation of normal BGC-cells and allowed us to propose an instructive LZ BGC-cells maturation and fate model.

Keywords: B cell differentiation; CD23+ B cells; GC Light-Zone B cells; germinal center (GC); germinal center (GC) B cells; plasmablasts/plasma cells.


Conflict of interest statement

The authors declare that the research was conducted in the absence of any commercial or financial relationships that could be construed as a potential conflict of interest.

Figures

Figure 1
Figure 1
In the GC, CD23 is expressed in the LZ, mainly by FDCs but also by some B cells. (A) Immunofluorescence staining of CD23 (red), PAX5 (pink) and PD1 (green) in paraffin-embedded tonsil tissues; the white arrow shows a CD23+ B cell located in front of a PD1+ Tfh cell. (B) Immunofluorescence staining of CD23 (pink), PAX5 (red) and CD3 (green) on frozen tonsil tissues; the PAX5 staining pattern for B cells does not really match the CD23 marker; panels 1 & 2 show T cells surrounded by CD23+ dendritic extensions, and panels 3 & 4 show T cells in the vicinity of CD23- B cells. (C) The proportion of CD23-expressing B cells was determined by flow cytometry in different B cell populations in tonsils (Right panel) and rLNs (Left panel): CD19+CD38-IgD+ naïve B cells (NBCs), CD19+CD38+IgD+ & IgD- BGC-cells, CD19+CD38++IgD- plasmablasts (PBs), and CD19+CD38-IgD-CD27+ memory B cells (MBCs) (one-way Anova & Kruskal-Wallis multiple comparisons test). (D) The proportion of CD23-positive cells in CXCR4hiCD83lo DZ BGC-cells and CXCR4loCD83hi LZ BGC-cells in tonsils and rLNs. (E) Flow cytometry analysis of KI67, IL4RA and CCR6 in tonsil CD23+ and CD23- LZ BGC-cells. Results are expressed as the relative mean fluorescence intensity (rMFI) or the percentage of positive cells (*P ≤ .05; "ns" for non significant; Mann-Whitney test).
Figure 2
Figure 2
FCER2/CD23 expression delineates specific LZ BGC-cell subsets. (A, B) Single-cell RNA-seq data for human tonsil-derived CXCR4loCD83hi LZ BGC-cells in the G0-G1 phase of the cell cycle, from Holmes et al., 2020. (A) UMAP of the 12 specific clusters defined by Holmes et al. and expression of FCER2 in these clusters. (B) Distribution of FCER2 + (red) and FCER2 - (black) non-proliferating LZ BGC-cells, in the 12 clusters. Dotted line represent the mean value of positive cells for all clusters (last barplot named All_cells) (Chi2 test for each population vs. total cells (*P < 0.05, ***P < 0.001; significant test are indicated in the barplot of enriched CD23-negative or -positive populations accordingly). (C) Selected view of the heatmap with unsupervised clustering of single-cell RT-qPCR data comparing paired cell-sorted CD23+ and CD23- LZ BGC-cells (CD19+IgD-CD10+CD38+CXCR4lo) and PBs (CD19+IgD-CD38bright). Annotation of three clusters of genes linked to specific cell functions identified with GeneMANIA related to PCs, B cell activation and cell proliferation. The red arrow on the top of the heatmap indicate in cluster of cycling cells, mostly CD23- LZ BGC-cells, that are positive for MYC expression represented in the Y-axis pink cluster. (D) Violin plot comparisons of the expression of few selected genes in CD23+, CD23- LZ BGC-cells and PBs. (E) Flow cytometry analysis of BCL6, BLIMP1, c-MYC and pS6 in tonsil CD23+ and CD23- LZ BGC-cells. Results are expressed as the percentage of positive cells or the relative mean fluorescence intensity (rMFI) (*P ≤ .05; "ns" for non significant; Mann-Whitney test).
Figure 3
Figure 3
CD23 expression of LZ BGC-cells depends on response to Tfh-driven stimulation. (A) Flow cytometry analysis of CD23+ LZ BGC-cells obtained after 12 h of culture with IL-4, CD40L and IL-21 alone or in combinations (**P < .01; ****P < .0001; one-way multiple comparisons test). (B) Flow cytometry analysis of pSTAT6 induction on post-stimulation CD23+ and CD23- LZ BGC-cells, in four independent experiments: Upper panel, a representative flow histogram; Lower panel, quantitative and statistically significant analysis. (C) LZ BGC-cells and Tfh cells were co-cultured without treatment (NT) or with aCD3/aCD28 or staphylococcal enterotoxin B (SEB) protein for 24 h and subsequently analyzed for CD23 and CD38 expression, using flow cytometry: left panel, representative flow graphs; right panel, results of three independent experiments. (D) GC immunohistostaining on paraffin-embedded tonsil sections with DAPI (blue), CD20 (yellow), PD1 (green), and pSTAT6 (red) presenting two high magnification views, showing pSTAT6+ B cells in the proximity of PD1+ Tfh cells (white arrows). (E) An image compatible with a cognate B cell-Tfh cell contact characterized by pSTAT6+ B cell in contact with PD1+ Tfh cell; immunohistostaining on paraffin-embedded tonsil sections with DAPI (blue), PAX5 (green), PD1 (white), and pSTAT6 (red). (F) Number of pSTAT6-PAX5 positive cells in three tonsils in the vicinity of PD1-positive T cells (left panel) and proportion of B cells closed to T cells among total of pSTAT6/PAX5-positive cells (right panel) in each tonsil.
Figure 4
Figure 4
CD23- LZ BGC-cells contain PB precursors. (A) BCL6, PAX5, XBP1 and PRDM1 gene expression after 12 h culture in the presence of IL-4, CD40L and IL-21 for LZ BGC-cells vs. freshly sorted, paired LZ BGC-cells and PBs (one-way Anova & Kruskal-Wallis multiple comparisons test). (B) Flow cytometry analysis of BLIMP1 and BCL6 expression in post-culture CD23+ and CD23- LZ BGC-cells: Left panel, representative flow graphs; Right panel, results of four independent experiments (*P ≤ .05; Mann-Whitney test. (C) Post-culture CD23+ and CD23- LZ BGC-cells were subsequently maintained for 48 h in the presence of IL-2, IL-4 and IL-10 prior to flow cytometry analysis, in order to detect CD38brightCD138- PBs and CD38brightCD138+ PCs. Left panel, graphical representation of the experiment and right panel, detected percentages of PBs and PCs for six independent experiments (**P ≤ .01; Mann-Whitney test).
Figure 5
Figure 5
Cell destiny of human LZ BGC-cells after Tfh-like stimulation. (A) The experimental plan, with five different cell populations (colored script) analyzed using sc-RTqPCR. (B) The UMAP representation (colored according to the experimental conditions) highlighted two different fates as a function of CD23 expression. (C) Projection of B cell identity genes (BCL6 and PAX5) and PC identity genes (PRDM1, XBP1, and IRF4) onto the UMAP representation. (D) The UMAP representation (colored according to the Monocle pseudotime), showing an ordered, progression in four quadrants from LZ BGC-cells to PBs.
Figure 6
Figure 6
The time course of gene analysis during LZ BGC-cell differentiation. (A) A heatmap computed for Monocle-ordered cells (LZ BGC-cells, PBs, T4h LZ BGC-cells, T24h CD23+ LZ BGC-cells, and CD23- LZ BGC-cells), showing six different gene modules annotated with GeneMANIA. The pseudotime scale was calculated from the gene expression data. (B) Density of cell subsets in each quadrant of the pseudotime. (C) Smooth analysis of the time course of each module by pseudotime quadrant (Q1 to Q4) for all cell subsets except T24h CD23+ LZ BGC-cells. (D) The time course of gene expression during B cell activation and differentiation into PCs showing (i) a bimodal expression of IRF4, (ii) a striking peak for PAX5, (iii) PRDM1 elevation synchronized with PAX5 decline, and (iv) the specific expression of XBP1s in the last quadrant of the pseudotime compared to XBP1. (E) Gene expression during the differentiation of CD23- LZ BGC-cells for Monocle-ordered cells showing a sequential transition from LZ BGC-cells to PBs for MYC expression, MYC-target genes and gene involved in cell cycle re-entry.
Figure 7
Figure 7
Overview of the IL-4 signature in LZ BGC-cells. (A) The time course of expression of IL-4-induced genes by quadrant showing a difference between the almost flat FCER2 expression and the strong CCL22 expression. (B–G) Single-cell RNA-seq data for human tonsil-derived total BGC-cells, from Holmes et al., 2020. (B) UMAP representation of the 13 specific clusters defined by Holmes et al. (C) UMAP showing cell expression of the IL-4 signature, noteworthy that positive cells are located in the right part of the map mainly in intermediate 6 (INT6) cluster (enlarged view) with an expression maintained in pre-MBCs (Top, dotted circle) while PBs are negative (Bottom, dotted circle). (D) UMAP showing FCER2 + cells; the enlarged view shows the preferential enrichment of these cells on the far right of the map depicting a ridge line extending from the INT6 cluster to the pre-MBC cluster (top, dotted line circle). (E) Violin plots comparing IL-4 signature expression in each of the 13 GC B cell clusters for FCER2+ (red) and FCER2- (black) cells (Pairwise t-test for IL-4 signature comparison between clusters is indicated above the plot; ***P < .001; ****P < .0001). (F) Table of P values of Wilcox test comparing FCER2+ and FCER2- BGC-cells for IL-4 signature in each of the 13 clusters. (G) Percentage of FCER2+ and FCER2- BGC-cells in the 13 clusters. Dotted line represent the mean value of positive cells for all clusters (last barplot named All_cells). Chi2 test for each population compared to total cells (*p < 0.05, **p < 0.01, ***p < 0.001, "ns" for non significant); significant test are indicated in the barplot of enriched FCER2 neg or pos populations accordingly.
Figure 8
Figure 8
Proposal of an instructive differentiation model of LZ BGC-cells integrating the expression of the CD23 marker. BGC-cells are predominantly CD23- compete for antigen (Ag) when only limited amount of Ag is available (top-left B cells). Fit cells proliferate, retrieve Ag deposited on follicular dendritic cells (FDCs) and receive survival signals from stromal cells (top-middle part). Note that FDCs express IL-4R and may take available IL-4 cytokine - in a non-directed manner [IL-4 broadcasting as called in (24)] – produced by Tfh. Both, high and low-affinity cells process Ag and present - in proportion to its affinity - peptide-MHC complex which supports the interaction with cognate Tfh and the delivery of crucial molecules including IL-21, CD40L and IL-4 leading to pSTAT6 expression (right-middle part). The split of the B cell fate depends on the integration of sufficient signals which impacts the maintenance or extinction of the IL-4/pSTAT6 signaling pathway. B cells that have quenched the IL-4/STAT6 signal are unable to express the CD23 marker and progress further to the PB axis of differentiation (bottom-right). These CD23- LZ BGC-cells correspond to pre-PB described previously (19) which express transiently MYC leading to cell cycle and the committal step of differentiation described elsewhere (14). In contrast, CD23+ LZ BGC-cells which have maintained IL-4/STAT6 signaling are prone to apoptosis or give rise to pre-MBCs; the maintenance of CD23 expression depends on the presence of IL-4 and CD40 stimuli (bottom-middle). In the right square, a view of the Figure 7C concerning scRNA-seq data for BGC-cells representing the fate of activated LZ BGC-cells between pre-MBC or PB outputs.

Similar articles

Cited by

References

    1. Caron G, Gallou SL, Lamy T, Tarte K, Fest T. CXCR4 Expression Functionally Discriminates Centroblasts Versus Centrocytes Within Human Germinal Center B Cells. J Immunol (2009) 182(12):7595–602. doi: 10.4049/jimmunol.0804272 - DOI - PubMed
    1. MacLennan IC. Germinal Centers. Annu Rev Immunol (1994) 12:117–39. doi: 10.1146/annurev.iy.12.040194.001001 - DOI - PubMed
    1. Vinuesa CG, Linterman MA, Yu D, MacLennan ICM. Follicular Helper T Cells. Annu Rev Immunol (2016) 34(1):335–68. doi: 10.1146/annurev-immunol-041015-055605 - DOI - PubMed
    1. Victora GD, Schwickert TA, Fooksman DR, Kamphorst AO, Meyer-Hermann M, Dustin ML, et al. . Germinal Center Dynamics Revealed by Multiphoton Microscopy With&Nbsp;a Photoactivatable Fluorescent Reporter. Cell (2010) 143(4):592–605. doi: 10.1016/j.cell.2010.10.032 - DOI - PMC - PubMed
    1. Kräutler NJ, Suan D, Butt D, Bourne K, Hermes JR, Chan TD, et al. . Differentiation of Germinal Center B Cells Into Plasma Cells Is Initiated by High-Affinity Antigen and Completed by Tfh Cells. J Exp Med (2017) 214(5):1259–67. doi: 10.1084/jem.20161533 - DOI - PMC - PubMed

Publication types