Brown Adipose Transplantation Improves Polycystic Ovary Syndrome-Involved Metabolome Remodeling
- PMID: 34912296
- PMCID: PMC8667175
- DOI: 10.3389/fendo.2021.747944
Brown Adipose Transplantation Improves Polycystic Ovary Syndrome-Involved Metabolome Remodeling
Abstract
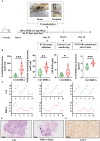
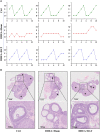
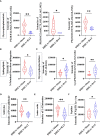
Polycystic ovary syndrome (PCOS) is a complex reproductive, endocrine, and metabolic disorder in reproductive-age women. In order to explore the active metabolites of brown adipose tissue (BAT) transplantation in improving the reproductive and metabolic phenotypes in a PCOS rat model, the metabolites in the recipient's BAT were explored using the liquid chromatography-mass spectrometry technique. In total, 9 upregulated and 13 downregulated metabolites were identified. They were roughly categorized into 12 distinct classes, mainly including glycerophosphoinositols, glycerophosphocholines, and sphingolipids. Ingenuity pathway analysis predicted that these differentially metabolites mainly target the PI3K/AKT, MAPK, and Wnt signaling pathways, which are closely associated with PCOS. Furthermore, one of these differential metabolites, sphingosine belonging to sphingolipids, was randomly selected for further experiments on a human granulosa-like tumor cell line (KGN). It significantly accelerated the apoptosis of KGN cells induced by dihydrotestosterone. Based on these findings, we speculated that metabolome changes are an important process for BAT transplantation in improving PCOS. It might be a novel therapeutic target for PCOS treatment.
Keywords: LC-MS; PCOS; brown adipose tissue; metabolites; sphingosine.
Copyright © 2021 Yao, Wang, Zhang, Wang, Liu, Di, Song and Xu.
Conflict of interest statement
The authors declare that the research was conducted in the absence of any commercial or financial relationships that could be construed as a potential conflict of interest.
Figures


Similar articles
-
Brown adipose tissue transplantation ameliorates polycystic ovary syndrome.Proc Natl Acad Sci U S A. 2016 Mar 8;113(10):2708-13. doi: 10.1073/pnas.1523236113. Epub 2016 Feb 22. Proc Natl Acad Sci U S A. 2016. PMID: 26903641 Free PMC article.
-
Brown adipose tissue-derived exosomes improve polycystic ovary syndrome in mice via STAT3/GPX4 signaling pathway.FASEB J. 2024 Sep 30;38(18):e70062. doi: 10.1096/fj.202401346R. FASEB J. 2024. PMID: 39305125
-
Brown Adipose Tissue and Novel Management Strategies for Polycystic Ovary Syndrome Therapy.Front Endocrinol (Lausanne). 2022 May 19;13:847249. doi: 10.3389/fendo.2022.847249. eCollection 2022. Front Endocrinol (Lausanne). 2022. PMID: 35663310 Free PMC article. Review.
-
Differences in metabonomic profiles of abdominal subcutaneous adipose tissue in women with polycystic ovary syndrome.Front Endocrinol (Lausanne). 2023 Feb 24;14:1077604. doi: 10.3389/fendo.2023.1077604. eCollection 2023. Front Endocrinol (Lausanne). 2023. PMID: 36909330 Free PMC article.
-
White-brown adipose tissue interplay in polycystic ovary syndrome: Therapeutic avenues.Biochem Pharmacol. 2024 Feb;220:116012. doi: 10.1016/j.bcp.2023.116012. Epub 2023 Dec 29. Biochem Pharmacol. 2024. PMID: 38159686 Review.
Cited by
-
Signaling pathways and targeted therapeutic strategies for polycystic ovary syndrome.Front Endocrinol (Lausanne). 2023 Oct 19;14:1191759. doi: 10.3389/fendo.2023.1191759. eCollection 2023. Front Endocrinol (Lausanne). 2023. PMID: 37929034 Free PMC article. Review.
-
MicroRNA-21 modulates brown adipose tissue adipogenesis and thermogenesis in a mouse model of polycystic ovary syndrome.Biol Sex Differ. 2024 Jul 10;15(1):53. doi: 10.1186/s13293-024-00630-2. Biol Sex Differ. 2024. PMID: 38987854 Free PMC article.
-
Regenerative Medicine for Polycystic Ovary Syndrome: Stem Cell-Based Therapies and Brown Adipose Tissue Activation.Stem Cell Rev Rep. 2023 May;19(4):853-865. doi: 10.1007/s12015-023-10505-5. Epub 2023 Jan 12. Stem Cell Rev Rep. 2023. PMID: 36633783 Review.
-
Low-dose spironolactone ameliorates adipose tissue inflammation and apoptosis in letrozole-induced PCOS rat model.BMC Endocr Disord. 2022 Sep 7;22(1):224. doi: 10.1186/s12902-022-01143-y. BMC Endocr Disord. 2022. PMID: 36071485 Free PMC article.
-
Shared diagnostic genes and potential mechanisms between polycystic ovary syndrome and recurrent miscarriage revealed by integrated transcriptomics analysis and machine learning.Front Endocrinol (Lausanne). 2024 Sep 27;15:1335106. doi: 10.3389/fendo.2024.1335106. eCollection 2024. Front Endocrinol (Lausanne). 2024. PMID: 39398336 Free PMC article.
References
-
- Forslund M, Landin-Wilhelmsen K, Trimpou P, Schmidt J, Brännström M, Dahlgren E. Type 2 Diabetes Mellitus in Women With Polycystic Ovary Syndrome During a 24-Year Period: Importance of Obesity and Abdominal Fat Distribution. Hum Reprod Open (2020) 2020(1):hoz042. doi: 10.1093/hropen/hoz042 - DOI - PMC - PubMed
Publication types
MeSH terms
LinkOut - more resources
Full Text Sources
Medical

