Lunapark-dependent formation of a virus-induced ER exit site contains multi-tubular ER junctions that promote viral ER-to-cytosol escape
- PMID: 34879280
- PMCID: PMC8759150
- DOI: 10.1016/j.celrep.2021.110077
Lunapark-dependent formation of a virus-induced ER exit site contains multi-tubular ER junctions that promote viral ER-to-cytosol escape
Abstract
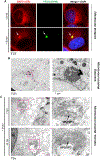
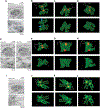
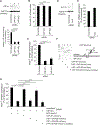
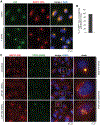
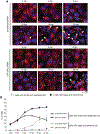
Viruses rearrange host membranes to support different entry steps. Polyomavirus simian virus 40 (SV40) reorganizes the endoplasmic reticulum (ER) membrane to generate focus structures that enable virus ER-to-cytosol escape, a decisive infection step. The molecular architecture of the ER exit site that might illuminate why it is ideally suited for membrane penetration is unknown. Here 3D focused ion beam scanning electron microscopy (FIB-SEM) reconstruction reveals that the ER focus structure consists of multi-tubular ER junctions where SV40 preferentially localizes, suggesting that tubular branch points are virus ER-to-cytosol penetration sites. Functional analysis demonstrates that lunapark-an ER membrane protein that typically stabilizes three-way ER junctions-relocates to the ER foci, where it supports focus formation, leading to SV40 ER escape and infection. Our results reveal how a virus repurposes the activity of an ER membrane protein to form a virus-induced ER substructure required for membrane escape and suggest that ER tubular junctions are vulnerable sites exploited by viruses for membrane penetration.
Keywords: Endoplasmid reticulum; FIB-SEM; Lunapark; Membrane trafficking; Non-enveloped virus; Polyomavirus; SV40.
Copyright © 2021 The Author(s). Published by Elsevier Inc. All rights reserved.
Conflict of interest statement
Declaration of interests The authors declare no competing interests.
Figures

Similar articles
-
The atlastin ER morphogenic proteins promote formation of a membrane penetration site during non-enveloped virus entry.J Virol. 2023 Aug 31;97(8):e0075623. doi: 10.1128/jvi.00756-23. Epub 2023 Aug 14. J Virol. 2023. PMID: 37578227 Free PMC article.
-
The endoplasmic reticulum membrane J protein C18 executes a distinct role in promoting simian virus 40 membrane penetration.J Virol. 2015 Apr;89(8):4058-68. doi: 10.1128/JVI.03574-14. Epub 2015 Jan 28. J Virol. 2015. PMID: 25631089 Free PMC article.
-
SGTA-Dependent Regulation of Hsc70 Promotes Cytosol Entry of Simian Virus 40 from the Endoplasmic Reticulum.J Virol. 2017 May 26;91(12):e00232-17. doi: 10.1128/JVI.00232-17. Print 2017 Jun 15. J Virol. 2017. PMID: 28356524 Free PMC article.
-
SV40 Hijacks Cellular Transport, Membrane Penetration, and Disassembly Machineries to Promote Infection.Viruses. 2019 Oct 5;11(10):917. doi: 10.3390/v11100917. Viruses. 2019. PMID: 31590347 Free PMC article. Review.
-
How DNA and RNA Viruses Exploit Host Chaperones to Promote Infection.Viruses. 2021 May 21;13(6):958. doi: 10.3390/v13060958. Viruses. 2021. PMID: 34064125 Free PMC article. Review.
Cited by
-
Components of the LINC and NPC complexes coordinately target and translocate a virus into the nucleus to promote infection.PLoS Pathog. 2022 Sep 6;18(9):e1010824. doi: 10.1371/journal.ppat.1010824. eCollection 2022 Sep. PLoS Pathog. 2022. PMID: 36067270 Free PMC article.
-
Host Subcellular Organelles: Targets of Viral Manipulation.Int J Mol Sci. 2024 Jan 29;25(3):1638. doi: 10.3390/ijms25031638. Int J Mol Sci. 2024. PMID: 38338917 Free PMC article. Review.
-
How host ER membrane chaperones and morphogenic proteins support virus infection.J Cell Sci. 2023 Jul 1;136(13):jcs261121. doi: 10.1242/jcs.261121. Epub 2023 Jul 4. J Cell Sci. 2023. PMID: 37401530 Free PMC article.
-
Non-enveloped virus membrane penetration: New advances leading to new insights.PLoS Pathog. 2022 Dec 8;18(12):e1010948. doi: 10.1371/journal.ppat.1010948. eCollection 2022 Dec. PLoS Pathog. 2022. PMID: 36480535 Free PMC article.
-
The atlastin ER morphogenic proteins promote formation of a membrane penetration site during non-enveloped virus entry.J Virol. 2023 Aug 31;97(8):e0075623. doi: 10.1128/jvi.00756-23. Epub 2023 Aug 14. J Virol. 2023. PMID: 37578227 Free PMC article.
References
-
- Baena V, Conrad R, Friday P, Fitzgerald E, Kim T, Bernbaum J, Berensmann H, Harned A, Nagashima K, and Narayan K (2021). FIB-SEM as a Volume Electron Microscopy Approach to Study Cellular Architectures in SARS-CoV-2 and Other Viral Infections: A Practical Primer for a Virologist. Viruses 13, 611. - PMC - PubMed
Publication types
MeSH terms
Substances
Grants and funding
LinkOut - more resources
Full Text Sources
Molecular Biology Databases
Miscellaneous

