. 2021 Dec 7;12(12):1135.
doi: 10.1038/s41419-021-04429-6.

TTK inhibition increases cisplatin sensitivity in high-grade serous ovarian carcinoma through the mTOR/autophagy pathway

Affiliations

TTK inhibition increases cisplatin sensitivity in high-grade serous ovarian carcinoma through the mTOR/autophagy pathway

Gonghua Qi et al. Cell Death Dis. .

Abstract

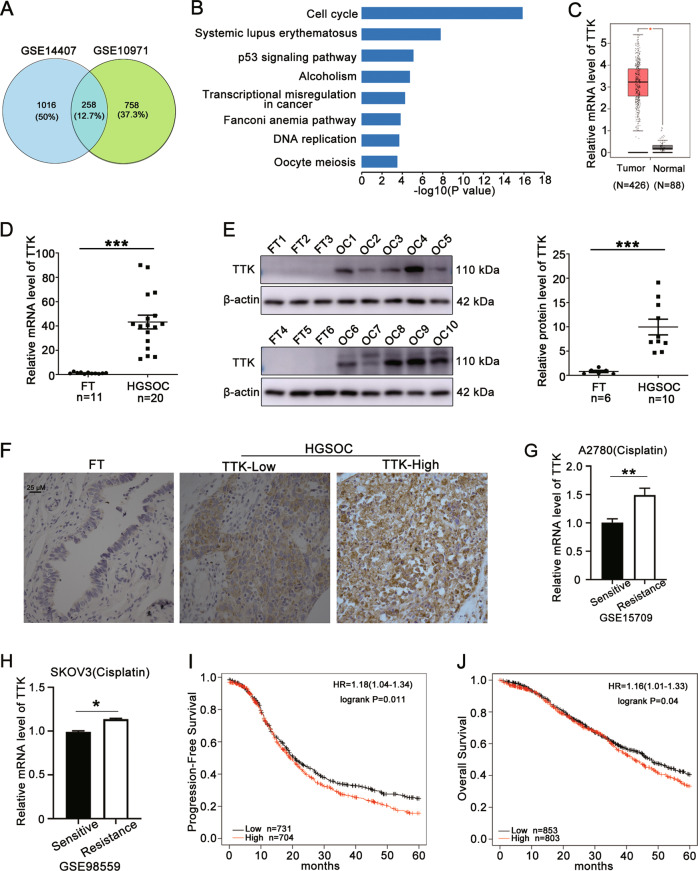
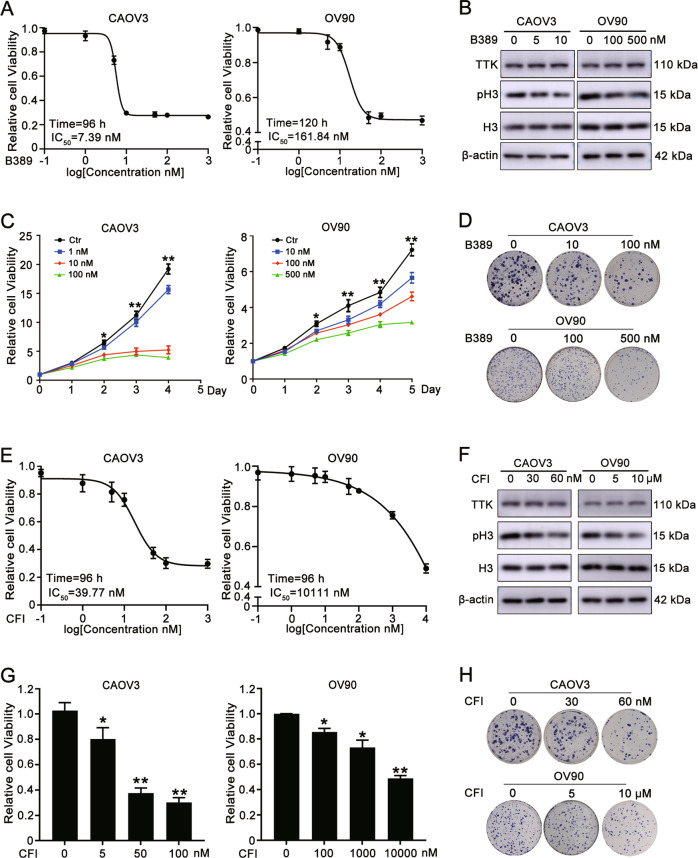
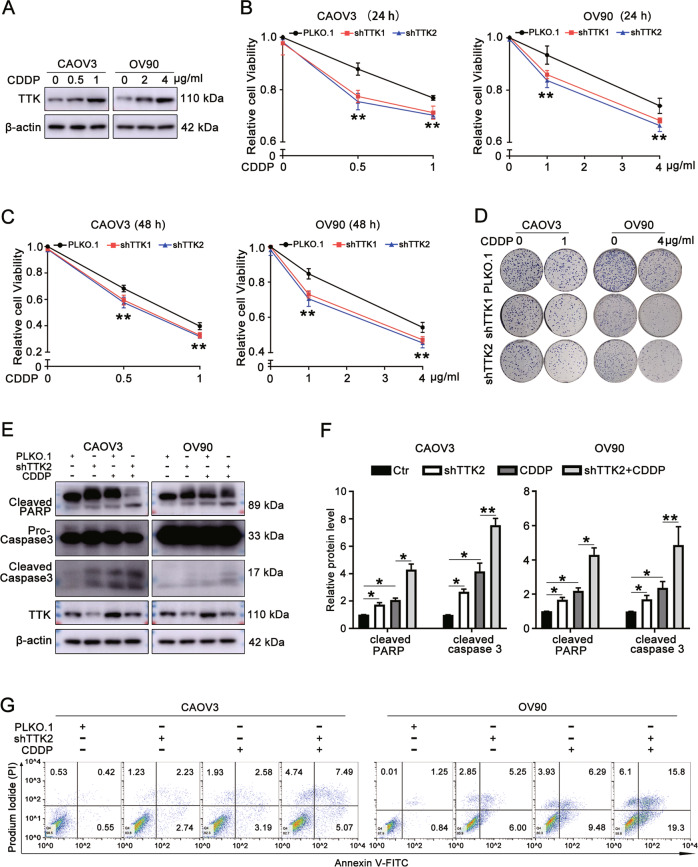
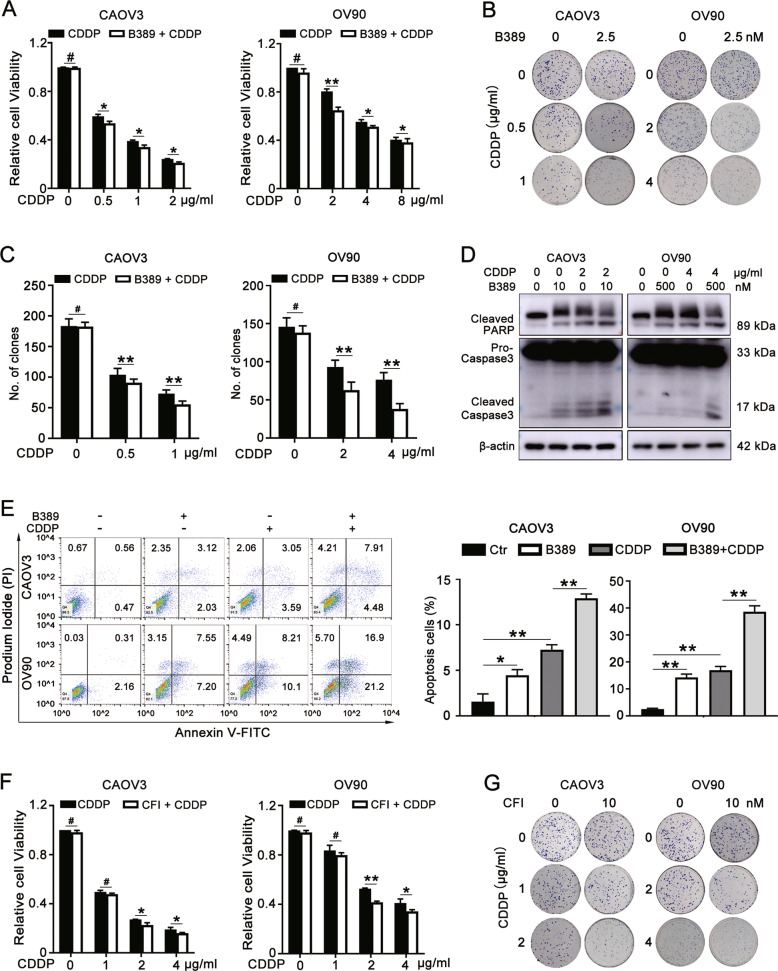
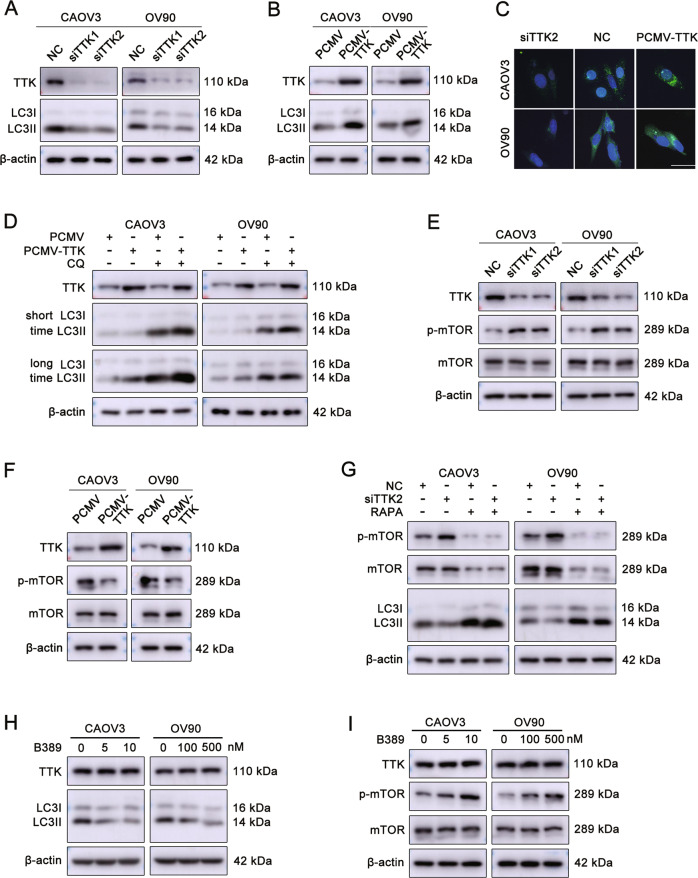
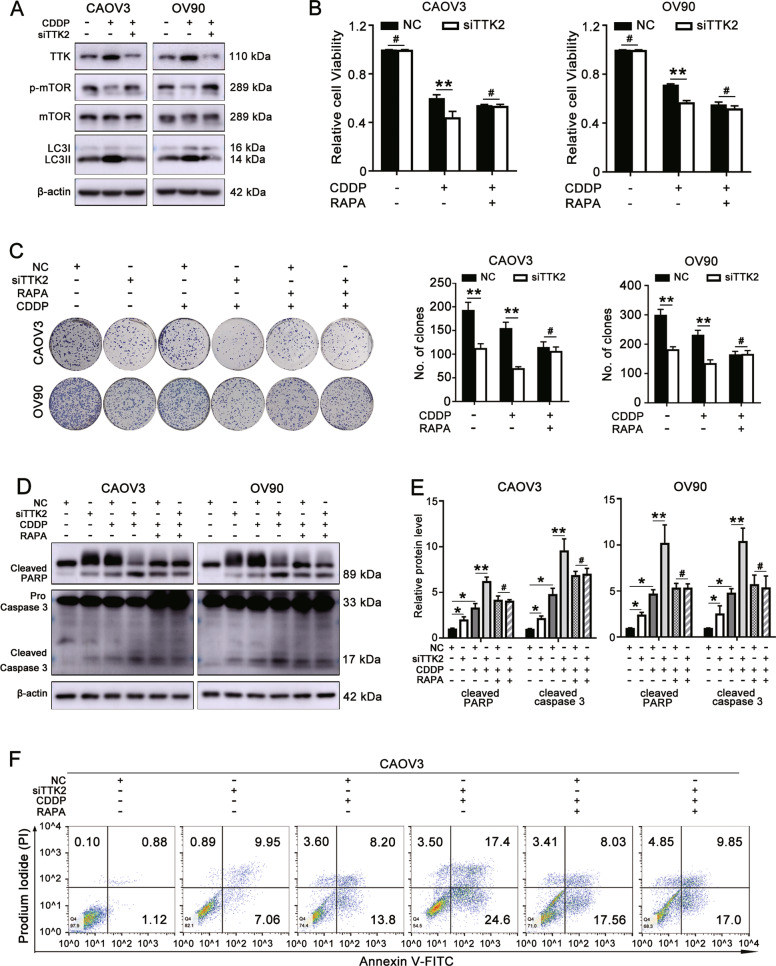
High-grade serous ovarian cancer (HGSOC) is the most lethal gynecological malignancy. However, the molecular mechanisms underlying HGSOC development, progression, chemotherapy insensitivity and resistance remain unclear. Two independent GEO datasets, including the gene expression profile of primary ovarian carcinoma and normal controls, were analyzed to identify genes related to HGSOC development and progression. A KEGG pathway analysis of the differentially expressed genes (DEGs) revealed that the cell cycle pathway was the most enriched pathway, among which TTK protein kinase (TTK) was the only gene with a clinical-grade inhibitor that has been investigated in a clinical trial but had not been studied in HGSOC. TTK was also upregulated in cisplatin-resistant ovarian cancer cells from two other datasets. TTK is a regulator of spindle assembly checkpoint signaling, playing an important role in cell cycle control and tumorigenesis in various cancers. However, the function and regulatory mechanism of TTK in HGSOC remain to be determined. In this study, we observed TTK upregulation in patients with HGSOC. High TTK expression was related to a poor prognosis. Genetic and pharmacological inhibition of TTK impeded the proliferation of ovarian cancer cells by disturbing cell cycle progression and increasing apoptosis. TTK silencing increased cisplatin sensitivity by activating the mammalian target of rapamycin (mTOR) complex to further suppress cisplatin-induced autophagy in vitro. In addition, the enhanced sensitivity was partially diminished by rapamycin-mediated inhibition of mTOR in TTK knockdown cells. Furthermore, TTK knockdown increased the toxicity of cisplatin in vivo by decreasing autophagy. These findings suggest that the administration of TTK inhibitors in combination with cisplatin may lead to improved response rates to cisplatin in patients with HGSOC presenting high TTK expression. In summary, our study may provide a theoretical foundation for using the combination therapy of cisplatin and TTK inhibitors as a treatment for HGSOC in the future.


Conflict of interest statement

The authors declare no competing interests.

Figures

Fig. 1
Fig. 1. TTK is a key gene regulating the cell cycle pathway that contributes to the oncogenesis and chemoresistance of HGSOC.
A Two GEO datasets (GSE14407 and GSE10971) were used to distinguish genes related to the oncogenesis of serous ovarian carcinoma (log2 FC > 1; P < 0.001). B The KEGG pathway analysis of overlapping genes in (A). C The mRNA expression of TTK in ovarian cancer (n = 426) and normal control tissues (n = 88) from the GEPIA database. D RT–qPCR analysis showing the TTK mRNA level in HGSOC and the comparison to FT tissues (FT, n = 11; HGSOC, n = 20). E The level of the TTK protein in HGSOC and FT tissues was detected using western blot assays (FT, FT1-FT6; HGSOC, OC1-OC10). F Representative IHC images of TTK staining in HGSOC and FT tissues (×400), scale bar: 25 µm. G, H The TTK mRNA level in cisplatin-resistant A2780 (GSE15709) and SKOV3 (GSE98559) cells. I, J PFS (I) and OS (J) analyses using the K−M plotter database based on TTK expression (data are mean ± SEM, *P < 0.05, **P < 0.01, ***P < 0.001, n = 3).
Fig. 2
Fig. 2. TTK depletion inhibits ovarian cancer cell proliferation by disturbing cell cycle progression.
CAOV3 and OV90 cells were stably transfected with PLKO.1 or the TTK shRNA (shTTK1 and shTTK2) A The TTK protein level in CAOV3 and OV90 cells after TTK knockdown. B MTT assays showed the effect of TTK knockdown on the proliferation of CAOV3 and OV90 cells. C The effect of TTK inhibition on the colony formation ability of CAOV3 and OV90 cells. D Cell cycle analysis of CAOV3 and OV90 cells after TTK knockdown. The TTK overexpression plasmid (PCMV-TTK) was transiently transfected into CAOV3 and OV90 cells stably transfected with shTTK2. E Western blot assay was used to assess the expression of the TTK protein 48 h after the transfection of the PCMV-TTK plasmid. F The effect of TTK overexpression on the proliferation of TTK-silenced CAOV3 and OV90 cells was detected using the MTT assay. G Colony formation assays were performed to assess the colony formation capacity when TTK was overexpressed in TTK knockdown ovarian cancer cells (data are mean ± SEM, #P > 0.05, *P < 0.05, **P < 0.01, n = 3).
Fig. 3
Fig. 3. TTK inhibitors impede ovarian cancer proliferation in vitro.
A CAOV3 and OV90 cells (3 × 103 cells per well of a 96-well plate) were incubated with a series of B389 concentrations (0, 0.1, 1, 5, 10, 50, 100, or 1000 nM) for 96 and 120 h, respectively. MTT assays were performed to determine the IC50 of B389 in CAOV3 (IC50 = 7.39 nM, 96 h) and OV90 (IC50 = 161.84 nM, 120 h) cells. B CAOV3 and OV90 cells were treated with different concentrations of B389 (0, 5, or 10 nM for CAOV3 cells and 0, 100, or 500 nM for OV90 cells) for 96 h. The dose-dependent effect of B389 on protein levels of TTK, H3, pH3 (ser10) and β-actin was detected using western blotting. C CAOV3 and OV90 cells (1.5 × 103 cells per well of a 96-well plate) were cultured with different concentrations of B389 (0, 1, 10, or 100 nM for CAOV3 cells and 0, 10, 100, or 500 nM for OV90 cells). Dose- and time-dependent effects of B389 on the proliferation of CAOV3 and OV90 cells were detected using MTT assays. D First, 1.5 × 103 cells were seeded in each well of a six-well plate, different concentrations of B389 (0, 10, or 100 nM for CAOV3 cells and 0, 100, or 500 nM for OV90 cells) were added after 10 days culture, and cells were treated for 4 days. The effect of B389 on the colony formation ability of ovarian cancer cells was detected. E. CAOV3 and OV90 cells were incubated with series concentrations of CFI (0, 0.1, 1, 5, 10, 50, 100, 1000, or 10,000 nM) for 96 h. MTT assays were performed to determine the IC50 of CFI in CAOV3 (IC50 = 39.77 nM) and OV90 (IC50 = 10111 nM) cells. F CAOV3 and OV90 cells were treated with different concentrations of CFI (0, 30, or 60 nM for CAOV3 cells and 0, 5, or 10 μM for OV90 cells) for 96 h. Levels of the TTK, H3, pH3 (ser10) and β-actin proteins were detected using western blotting after CFI treatment. G The antiproliferative effect of CFI (0, 5, 50, or 100 nM for CAOV3 cells and 0, 100, 1000, or 10,000 nM for OV90 cells) on CAOV3 and OV90 cells was detected using MTT assays. H CFI treatment (0, 30, or 60 nM for CAOV3 cells and 0, 5, or 10 μM for OV90 cells) inhibited the colony formation ability of ovarian cancer cells (data are mean ± SEM, *P < 0.05, **P < 0.01, n = 3).
Fig. 4
Fig. 4. TTK silencing enhances cisplatin sensitivity in ovarian cancer cells.
A Western blotting was performed to detect the TTK protein level in CAOV3 and OV90 cells treated with different concentrations of cisplatin (0, 0.5, or 1 μg/ml for CAOV3 and 0, 2, or 4 μg/ml for OV90) for 48 h. BD CAOV3 and OV90 cells stably transfected with PLKO.1 or the TTK shRNA (shTTK1 and shTTK2) were treated with different concentrations of CDDP (0, 0.5, or 1 μg/ml for CAOV3 and 0, 1, or 4 μg/ml for OV90). The MTT assay was performed at 24 h (B) and 48 h (C) and the colony formation assay (D) was performed to evaluate the effect of TTK on CDDP sensitivity. EG CAOV3 and OV90 cells stably transfected with PLKO.1 or shTTK2 were treated with 2 or 4 μg/ml CDDP for 48 h. E, F Western blot assays were conducted to assess the relative protein levels of cleaved PARP, cleaved caspase-3, and TTK normalized to β-actin. G Flow cytometry was used to detect apoptotic cells (data are mean ± SEM, *P < 0.05, **P < 0.01, n = 3).
Fig. 5
Fig. 5. TTK inhibitors render CAOV3 and OV90 cells more sensitive to cisplatin.
AC CAOV3 and OV90 cells were treated with the indicated concentrations of CDDP (0, 0.5, 1, or 2 μg/ml for CAOV3 cells and 0, 2, 4, or 8 μg/ml for OV90 cells) in combination with or without B389 (2.5 nM) for 48 h. A The MTT assay was conducted to determine cell viability. B, C The cotreatment efficiency of B389 and CDDP was assessed using the colony formation assay. D, E CAOV3 and OV90 cells were treated with DMSO, B389 (10 nM for CAOV3 and 500 nM for OV90), or CDDP (2 μg/ml for CAOV3 and 4 μg/ml for OV90) alone or in combination with B389 and CDDP. D The protein levels of cleaved PARP, cleaved caspase-3, and TTK were evaluated using western blotting. β-actin served as an endogenous control. E Apoptotic cells in different groups were detected using flow cytometry. F, G The MTT assay (F) and colony formation assay (G) were evaluated after treatment with 0, 1, 2, 4 μg/ml cisplatin and/or 10 nM CFI (data are mean ± SEM, #P > 0.05, *P < 0.05, **P < 0.01, n = 3).
Fig. 6
Fig. 6. TTK depletion inhibits autophagy by activating the mTOR signaling pathway in ovarian cancer cells.
A CAOV3 and OV90 cells were transiently transfected with NC or siTTK for 48 h. Protein levels of LC3-I, LC3-II, TTK, and β-actin were assessed using western blotting. B Western blot assays were conducted to detect the LC3-I, LC3-II, TTK and β-actin protein levels in CAOV3 and OV90 cells after transfection with PCMV or PCMV-TTK. C Representative images of immunofluorescence staining for LC3B in ovarian cancer cells transfected with siTTK, NC, and PCMV-TTK for 48 h (×400). Scale bar: 15 µm. D CAOV3 and OV90 cells transfected with PCMV or PCMV-TTK were treated with or without CQ (50 μM) for 24 h. Levels of the LC3-I, LC3-II, TTK and β-actin proteins were analyzed using western blotting. E CAOV3 and OV90 cells were transfected with NC or siTTK for 48 h. Levels of the p-mTOR, mTOR, TTK, and β-actin proteins were evaluated using western blotting. F Western blot assays were performed to show the levels of the p-mTOR, mTOR, TTK and β-actin proteins in CAOV3 and OV90 cells transfected with PCMV or PCMV-TTK for 48 h. G CAOV3 and OV90 cells transfected with NC or siTTK were treated with or without 100 nM rapamycin for 24 h. The levels of p-mTOR, mTOR, LC3-I/II, TTK, and β-actin were measured using western blotting. H Levels of the LC3-I, LC3-II, TTK, and β-actin proteins in CAOV3 and OV90 cells treated with B389 for 48 h. I Western blot analysis was performed to detect the levels of the p-mTOR, mTOR, TTK and β-actin proteins in CAOV3 and OV90 cells treated with B389 for 48 h (data are mean ± SEM, n = 3).
Fig. 7
Fig. 7. TTK silencing increases the sensitivity of ovarian cancer to cisplatin through the mTOR/autophagy pathway.
A CAOV3 and OV90 cells transfected with NC or siTTK2 were treated with 1 or 2 μg/ml CDDP for 48 h. The relative protein levels of p-mTOR, mTOR, LC3-I/II and TTK were detected using western blotting. B, C CAOV3 and OV90 cells with or without TTK knockdown were treated with 1 or 2 μg/ml CDDP alone or in combination with 100 nM rapamycin. Cell viability (B) and the colony formation ability (C) were detected. DF CAOV3 and OV90 cells transfected with NC or siTTK2 were treated with 2 or 4 μg/ml CDDP for 24 h and then treated in combination with or without 100 nM rapamycin for 24 h. D, E The protein levels of cleaved PARP and cleaved caspase-3 were evaluated using western blotting. F Flow cytometry was performed to detect apoptotic cells (data are mean ± SEM, #P > 0.05, *P < 0.05, **P < 0.01, n = 3).
Fig. 8
Fig. 8. Knockdown of TTK increases cisplatin sensitivity by inhibiting autophagy in vivo.
CAOV3 cells transfected with shTTK2 or PLKO.1 were subcutaneously injected into the left armpit of each 5-week-old female mouse. When the tumor volumes were approximately 100 mm3, each group of mice was randomly divided into two subgroups and treated with or without CDDP (2 mg/kg) for 14 days. A Photographs of tumors from each group. B The tumor weights in each group. C The bodyweight of each group in (A). D Representative images of IHC staining of TTK, Ki67, LC3B, and cleaved caspase-3 in tumor tissues (×400). Scale bar: 50 µm (data are mean ± SEM, #P > 0.05, *P < 0.05, **P < 0.01, ***P < 0.001, n = 6).

Similar articles

Cited by

References

    1. Armstrong D, Alvarez R, Bakkum-Gamez J, Barroilhet L, Behbakht K, Berchuck A, et al. Ovarian cancer, version 2.2020, NCCN clinical practice guidelines in oncology. J Natl Compr Cancer Netw. 2021;19:191–226. - PubMed
    1. Bookman M. Optimal primary therapy of ovarian cancer. Ann Oncol. 2016;27:i58–i62. - PubMed
    1. Vaughan S, Coward J, Bast R, Berchuck A, Berek J, Brenton J, et al. Rethinking ovarian cancer: recommendations for improving outcomes. Nat Rev Cancer. 2011;11:719–25. - PMC - PubMed
    1. Tompkins J, Wu X, Her C. MutS homologue hMSH5: role in cisplatin-induced DNA damage response. Mol Cancer. 2012;11:10. - PMC - PubMed
    1. Ummat A, Rechkoblit O, Jain R, Roy Choudhury J, Johnson R, Silverstein T, et al. Structural basis for cisplatin DNA damage tolerance by human polymerase η during cancer chemotherapy. Nat Struct Mol Biol. 2012;19:628–32. - PMC - PubMed

Publication types

MeSH terms