. 2021 Dec 21;12(6):e0298021.
doi: 10.1128/mBio.02980-21. Epub 2021 Dec 7.

A Two-Color Haploid Genetic Screen Identifies Novel Host Factors Involved in HIV-1 Latency

Affiliations

A Two-Color Haploid Genetic Screen Identifies Novel Host Factors Involved in HIV-1 Latency

Michael Röling et al. mBio. .

Abstract

To identify novel host factors as putative targets to reverse HIV-1 latency, we performed an insertional mutagenesis genetic screen in a latent HIV-1 infected pseudohaploid KBM7 cell line (Hap-Lat). Following mutagenesis, insertions were mapped to the genome, and bioinformatic analysis resulted in the identification of 69 candidate host genes involved in maintaining HIV-1 latency. A select set of candidate genes was functionally validated using short hairpin RNA (shRNA)-mediated depletion in latent HIV-1 infected J-Lat A2 and 11.1 T cell lines. We confirmed ADK, CHD9, CMSS1, EVI2B, EXOSC8, FAM19A, GRIK5, IRF2BP2, NF1, and USP15 as novel host factors involved in the maintenance of HIV-1 latency. Chromatin immunoprecipitation assays indicated that CHD9, a chromodomain helicase DNA-binding protein, maintains HIV-1 latency via direct association with the HIV-1 5' long terminal repeat (LTR), and its depletion results in increased histone acetylation at the HIV-1 promoter, concomitant with HIV-1 latency reversal. FDA-approved inhibitors 5-iodotubercidin, trametinib, and topiramate, targeting ADK, NF1, and GRIK5, respectively, were characterized for their latency reversal potential. While 5-iodotubercidin exhibited significant cytotoxicity in both J-Lat and primary CD4+ T cells, trametinib reversed latency in J-Lat cells but not in latent HIV-1 infected primary CD4+ T cells. Importantly, topiramate reversed latency in cell line models, in latently infected primary CD4+ T cells, and crucially in CD4+ T cells from three people living with HIV-1 (PLWH) under suppressive antiretroviral therapy, without inducing T cell activation or significant toxicity. Thus, using an adaptation of a haploid forward genetic screen, we identified novel and druggable host factors contributing to HIV-1 latency. IMPORTANCE A reservoir of latent HIV-1 infected cells persists in the presence of combination antiretroviral therapy (cART), representing a major obstacle for viral eradication. Reactivation of the latent HIV-1 provirus is part of curative strategies which aim to promote clearance of the infected cells. Using a two-color haploid screen, we identified 69 candidate genes as latency-maintaining host factors and functionally validated a subset of 10 of those in additional T-cell-based cell line models of HIV-1 latency. We further demonstrated that CHD9 is associated with HIV-1's promoter, the 5' LTR, while this association is lost upon reactivation. Additionally, we characterized the latency reversal potential of FDA compounds targeting ADK, NF1, and GRIK5 and identify the GRIK5 inhibitor topiramate as a viable latency reversal agent with clinical potential.

Keywords: haploid forward genetic screen; host factor; human immunodeficiency virus; latency.


Conflict of interest statement

The authors declare no conflict of interest.

Figures

FIG 1
FIG 1
Schematic representation of the two-color haploid screening strategy for identification of novel host factors and cellular pathways involved in the maintenance of HIV-1 latency. (A) Scheme depicting the generation of a clonal latent haploid KBM7 cell line. To this end, haploid KBM7 cells were infected with a minimal HIV-1 virus harboring GFP (HIV-1 658). After stimulation, reactivated cells were sorted and left to expand and revert to a latent state. (B) FACS plots depicting the establishment of haploid latent HIV-1 infected KBM7 cell line (Hap-Lat). Parental KBM7 cells were infected with a minimal HIV-1 virus carrying a GFP reporter (HIV-1 658). GFP-negative cells, consisting of uninfected and latently infected cells, were sorted by FACS. The polyclonal cell pool was stimulated with a cocktail of latency reversal agents (LRAs), and reactivated cells were clonally sorted by FACS and expanded to generate haploid latent cell lines. WT, wild type. (C) Hap-Lat #1 displays low basal activity (GFP expression) but is effectively reactivated using LRAs. (D) Hap-Lat cells were mutagenized by infection with a gene-trap (GT) virus harboring an mCherry reporter. Cells infected with the GT reporter will be mCherry positive (red asterisk). Latently infected KBM7 cells that reactivate following GT mutagenesis will be double positive for GFP and mCherry (green cells, red asterisk). (E) Representative FACS plots demonstrating gating strategy for sorting double-positive cells (GFP, mCherry). (F) Double-positive cells (GFP, mCherry) are sorted in multiple rounds to eliminate cells stochastically reverting to a GFP-negative state. During these rounds of sorting, a stable and distinct double-positive subpopulation (GFP Sub) appears which was sorted separately.
FIG 2
FIG 2
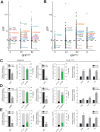
Identification and validation of candidate host factors. (A) LOF scores of genes in the GFPStable population (samples A, B1, and B2); validated candidates are indicated. Genes with LOF scores of >3 are in large font, and underlined genes comply with our candidate gene selection criteria and have a LOF score of >3 in at least two biological replicates within either the GFPStable or GFPTotal population, while genes with a LOF score of <3 but complying with our selection criteria based on other samples are depicted in small font and italics. (B) LOF scores of genes in the GFPTotal population (samples C, D1, D2, and E); markings are as in panel A. (C to E) Functional validation of candidate hits ADK (C), GRIK5 (D), and NF1 (E) by shRNA-mediated depletion followed by determination of latency reversal by flow cytometry and RT-PCR in latently infected J-Lat A2 (left panels) and 11.1 (right panels) cells. Flow cytometry bar plots: green bars show the percentage of GFP-positive cells after knockdown over control (black bar), left y axis, whereas gray bars show cell viability, right y axis. Viral reactivation is confirmed by RT-qPCR for viral genes Tat, Gag, and Pol in J-Lat 11.1 cells. Statistical significance was calculated using ratio-paired t test and multiple-comparison t test on log2-transformed fold changes: *, P < 0.05; **, P < 0.01; ***, P < 0.001.
FIG 3
FIG 3
CHD9 regulates HIV-1 latency in J-Lat A2 and J-Lat 11.1 cells. (A) Western blot assay for CHD9 in control and CHD9 shRNA-depleted J-Lat 11.1 and A2 cells, with α-tubulin as a loading control. (B) Flow cytometry bar plots demonstrating latency reversal after CHD9 shRNA depletion in J-Lat 11.1 cells: green bars indicate the percentage of GFP-positive cells after knockdown over control (black bar), left y axis, whereas gray bars show cell viability, right y axis. (C) Latency reversal after CHD9 shRNA depletion in J-Lat A2 cells. (D) RT-qPCR data from J-Lat 11.1 cells transduced with CHD9 shRNA for the HIV-1 viral genes Tat, Gag, and Pol; housekeeping genes PPIA, B-ACT, and B2M; LRA targets ARID1A, CDK9, and NFKB; apoptosis genes BAK1, BCL2, and CASP3; T cell functionality gene TNF-α; and reactive oxygen species (ROS) genes KEAP, FOXO3, and NRF2. Data are normalized to GAPDH and represented as fold increase over sh Control. Statistical significance was calculated using ratio-paired t test and multiple-comparison t test on log2-transformed fold changes: *, P < 0.05; **, P < 0.01; ***, P < 0.001. (E) Schematic of HIV-1 genome. 5′ LTR region further segmented into the U3, R, and U5 regions. Amplicons used in ChIP-qPCR experiments are indicated. (F) ChIP-qPCR analysis of CHD9 binding to the HIV-1 5′ LTR in untreated and PMA-stimulated J-Lat 11.1 cells. Data are represented as percentage of the input. (G) ChIP-qPCR analysis of histone H3 occupancy at the HIV-1 5′ LTR in untreated and PMA-stimulated J-Lat 11.1 cells. Data are represented as percentage of the input. (H) ChIP-qPCR analysis of histone H3 acetylation at the HIV-1 5′ LTR in untreated and PMA-stimulated J-Lat 11.1 cells. (E to H) Data represent the average (±SD) from two technical replicates.
FIG 4
FIG 4
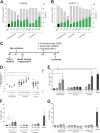
HIV-1 latency reversal by small-molecule inhibitors of three candidate genes, ADK, GRIK5, and NF1. (A) Latency reversal potential upon 48-h treatment of J-Lat A2 cells with increasing concentrations of 5-iodotubercidin (ADK inhibitor), topiramate (GRIK5 inhibitor), and trametinib (NF1 inhibitor) was evaluated by flow cytometry. Treatment with DMSO (black bar) is used as a negative control. Percentage of GFP-positive cells is indicated by green bars (left y axes), and cell viability is indicated by gray bars (right y axis). (B) Latency reversal potential upon 48-h treatment of J-Lat 11.1 cells. (C) Schematic representation of candidate LRA treatment in a primary cell model of latent HIV-1 infection. CD4+ T cells are isolated on day 0 and spin infected on day 1. On day 2 virus is removed by medium change in the presence of saquinavir. Latently infected cells are stimulated with candidate LRAs on day 5, and HIV-1 reactivation is evaluated at day 7. (D) Latency reversal as measured by luciferase activity in a primary cell model of HIV-1 latency after treatment with 5-iodotubercidin, trametinib, and topiramate in different concentrations. Plots show the fold increase in luciferase activity, measured in relative light units (RLU), after treatment with different concentrations of 5-iodotubercidin (ADK inhibitor), topiramate (GRIK5 inhibitor), and trametinib (NF1 inhibitor). Each dot represents a single measurement, and black horizontal lines show the average fold increase for each treatment. Averaged data from at least 3 independent experiments performed using each time two different donors (totaling at least 6 different donors). PMA was used as a positive control. Statistical significance was calculated using t test: *, P < 0.05; **, P < 0.005; ***, P < 0.0005. (E) Percentage of cells expressing apoptosis marker annexin V in primary CD4+ T cells upon treatment with candidate LRAs for 48 h. Treatment with a toxic concentration of gliotoxin (GTX), 200 nM, was used as a positive control. Experiments were performed in uninfected cells obtained from 6 healthy donors. Data are presented as mean ± SD from three independent experiments. The † symbol indicates low viability. (F) Percentage of cells expressing marker of cell activation CD25 in primary CD4+ T cells from 6 healthy donors; data are presented as mean ± SD from three independent experiments of 2 different healthy donors upon treatment with candidate LRAs for 48 h. Treatment with PMA/ionomycin is used as a positive control. (G) Percentage of cells expressing marker of cell activation CD69 in primary CD4+ T cells from 6 healthy donors; data are presented as mean ± SD from three independent experiments of 2 different healthy donors upon treatment with candidate LRAs for 48 h. Treatment with PMA/ionomycin is used as a positive control. Statistical significance was calculated using one-way ANOVA, multiple-comparison test. Asterisks indicate the level of significance. (**, P < 0.01; ***, P < 0.001).
FIG 5
FIG 5
The FDA-approved drug topiramate reverses HIV-1 latency ex vivo in cells obtained from cART-suppressed PLWH with limited toxicity. (A) Clinical characteristics corresponding to the aviremic HIV-1-infected study participants described in panels B and C. (B) Fold change in cell-associated unspliced HIV-1 RNA in CD4+ T cells isolated from PBMCs from aviremic HIV-1-infected donors after treatment with different concentrations of topiramate for 24 h. PMA/ionomycin was used as a positive control. Statistical significance was calculated using two-tailed t test: *, P < 0.05; **, P < 0.01; ***, P < 0.001. (C) Induction of unspliced (US) HIV-1 RNA copies per 500 ng total RNA in CD4+ T cells from HIV-1-infected individuals as presented in panel B. PMA/ionomycin was used as a positive control. Statistical significance was calculated using two-tailed t test: *, P < 0.05. (D) Viability assay in primary CD4+ T cells obtained from healthy donors after treatment with topiramate as indicated for 24, 48, and 72 h. CD4+ T cells were isolated from healthy individuals and treated as indicated for 24, 48, and 72 h. Viability was assessed by alamarBlue viability staining. Treatment readings are normalized to untreated control, represented as 100%.

Similar articles

Cited by

References

    1. Siliciano JM, Siliciano RF. 2015. The remarkable stability of the latent reservoir for HIV-1 in resting memory CD4+ T cells. J Infect Dis 212:1345–1347. doi:10.1093/infdis/jiv219. - DOI - PubMed
    1. Sengupta S, Siliciano RF. 2018. Targeting the latent reservoir for HIV-1. Immunity 48:872–895. doi:10.1016/j.immuni.2018.04.030. - DOI - PMC - PubMed
    1. Deeks SG. 2012. HIV-1: shock and kill. Nature 487:439–440. doi:10.1038/487439a. - DOI - PubMed
    1. Ne E, Palstra R-J, Mahmoudi T. 2018. Transcription: insights from the HIV-1 promoter. Int Rev Cell Mol Biol 335:191–243. doi:10.1016/bs.ircmb.2017.07.011. - DOI - PubMed
    1. Van Lint C, Bouchat S, Marcello A. 2013. HIV-1 transcription and latency: an update. Retrovirology 10:67. doi:10.1186/1742-4690-10-67. - DOI - PMC - PubMed

Publication types

MeSH terms