Modeling DNA Opening in the Eukaryotic Transcription Initiation Complexes via Coarse-Grained Models
- PMID: 34869598
- PMCID: PMC8636136
- DOI: 10.3389/fmolb.2021.772486
Modeling DNA Opening in the Eukaryotic Transcription Initiation Complexes via Coarse-Grained Models
Erratum in
-
Corrigendum: Modeling DNA Opening in the Eukaryotic Transcription Initiation Complexes via Coarse-Grained Models.Front Mol Biosci. 2021 Dec 7;8:817343. doi: 10.3389/fmolb.2021.817343. eCollection 2021. Front Mol Biosci. 2021. PMID: 34950705 Free PMC article.
Abstract
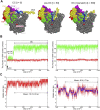
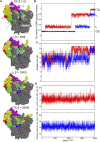
Recently, the molecular mechanisms of transcription initiation have been intensively studied. Especially, the cryo-electron microscopy revealed atomic structure details in key states in the eukaryotic transcription initiation. Yet, the dynamic processes of the promoter DNA opening in the pre-initiation complex remain obscured. In this study, based on the three cryo-electron microscopic yeast structures for the closed, open, and initially transcribing complexes, we performed multiscale molecular dynamics (MD) simulations to model structures and dynamic processes of DNA opening. Combining coarse-grained and all-atom MD simulations, we first obtained the atomic model for the DNA bubble in the open complexes. Then, in the MD simulation from the open to the initially transcribing complexes, we found a previously unidentified intermediate state which is formed by the bottleneck in the fork loop 1 of Pol II: The loop opening triggered the escape from the intermediate, serving as a gatekeeper of the promoter DNA opening. In the initially transcribing complex, the non-template DNA strand passes a groove made of the protrusion, the lobe, and the fork of Rpb2 subunit of Pol II, in which several positively charged and highly conserved residues exhibit key interactions to the non-template DNA strand. The back-mapped all-atom models provided further insights on atomistic interactions such as hydrogen bonding and can be used for future simulations.
Keywords: DNA opening; eukaryotes; molecular dynamics simulation; protein-DNA complex; transcription.
Copyright © 2021 Shino and Takada.
Conflict of interest statement
The authors declare that the research was conducted in the absence of any commercial or financial relationships that could be construed as a potential conflict of interest.
Figures


Similar articles
-
Structure of RNA polymerase II pre-initiation complex at 2.9 Å defines initial DNA opening.Cell. 2021 Jul 22;184(15):4064-4072.e28. doi: 10.1016/j.cell.2021.05.012. Epub 2021 Jun 15. Cell. 2021. PMID: 34133942
-
Crystal Structure of a Transcribing RNA Polymerase II Complex Reveals a Complete Transcription Bubble.Mol Cell. 2015 Jul 16;59(2):258-69. doi: 10.1016/j.molcel.2015.06.034. Mol Cell. 2015. PMID: 26186291 Free PMC article.
-
Structure of transcribing mammalian RNA polymerase II.Nature. 2016 Jan 28;529(7587):551-4. doi: 10.1038/nature16482. Epub 2016 Jan 20. Nature. 2016. PMID: 26789250
-
Distinct Mechanisms of Transcription Initiation by RNA Polymerases I and II.Annu Rev Biophys. 2018 May 20;47:425-446. doi: 10.1146/annurev-biophys-070317-033058. Annu Rev Biophys. 2018. PMID: 29792819 Review.
-
Eukaryotic transcription initiation machinery visualized at molecular level.Transcription. 2016 Oct 19;7(5):203-208. doi: 10.1080/21541264.2016.1237150. Transcription. 2016. PMID: 27658022 Free PMC article. Review.
Cited by
-
CHIMERA_NA: A Customizable Mutagenesis Tool for Structural Manipulations in Nucleic Acids and Their Complexes.ACS Omega. 2024 Sep 13;9(38):40061-40066. doi: 10.1021/acsomega.4c05954. eCollection 2024 Sep 24. ACS Omega. 2024. PMID: 39346815 Free PMC article.
-
Molecular dynamics analysis of biomolecular systems including nucleic acids.Biophys Physicobiol. 2022 Aug 23;19:e190027. doi: 10.2142/biophysico.bppb-v19.0027. eCollection 2022. Biophys Physicobiol. 2022. PMID: 36349319 Free PMC article.
-
DNA opening during transcription initiation by RNA polymerase II in atomic detail.Biophys J. 2022 Nov 15;121(22):4299-4310. doi: 10.1016/j.bpj.2022.10.012. Epub 2022 Oct 13. Biophys J. 2022. PMID: 36230000 Free PMC article.
References
-
- Abraham M. J., Murtola T., Schulz R., Páll S., Smith J. C., Hess B. (2015). Gromacs: High Performance Molecular Simulations through Multi-level Parallelism from Laptops to Supercomputers. SoftwareX 1-2, 19–25. 10.1016/j.softx.2015.06.001 - DOI
LinkOut - more resources
Full Text Sources
Molecular Biology Databases

