

Novel Optics-Based Approaches for Cardiac Electrophysiology: A Review
- PMID: 34867476
- PMCID: PMC8637189
- DOI: 10.3389/fphys.2021.769586
Novel Optics-Based Approaches for Cardiac Electrophysiology: A Review
Abstract
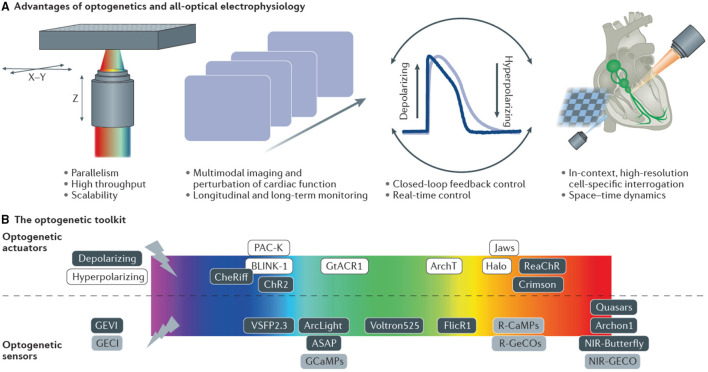
Optical techniques for recording and manipulating cellular electrophysiology have advanced rapidly in just a few decades. These developments allow for the analysis of cardiac cellular dynamics at multiple scales while largely overcoming the drawbacks associated with the use of electrodes. The recent advent of optogenetics opens up new possibilities for regional and tissue-level electrophysiological control and hold promise for future novel clinical applications. This article, which emerged from the international NOTICE workshop in 2018, reviews the state-of-the-art optical techniques used for cardiac electrophysiological research and the underlying biophysics. The design and performance of optical reporters and optogenetic actuators are reviewed along with limitations of current probes. The physics of light interaction with cardiac tissue is detailed and associated challenges with the use of optical sensors and actuators are presented. Case studies include the use of fluorescence recovery after photobleaching and super-resolution microscopy to explore the micro-structure of cardiac cells and a review of two photon and light sheet technologies applied to cardiac tissue. The emergence of cardiac optogenetics is reviewed and the current work exploring the potential clinical use of optogenetics is also described. Approaches which combine optogenetic manipulation and optical voltage measurement are discussed, in terms of platforms that allow real-time manipulation of whole heart electrophysiology in open and closed-loop systems to study optimal ways to terminate spiral arrhythmias. The design and operation of optics-based approaches that allow high-throughput cardiac electrophysiological assays is presented. Finally, emerging techniques of photo-acoustic imaging and stress sensors are described along with strategies for future development and establishment of these techniques in mainstream electrophysiological research.
Keywords: arrhythmia; electrophysiology; fluorescence; heart; optogenetics.
Copyright © 2021 Müllenbroich, Kelly, Acker, Bub, Bruegmann, Di Bona, Entcheva, Ferrantini, Kohl, Lehnart, Mongillo, Parmeggiani, Richter, Sasse, Zaglia, Sacconi and Smith.
Conflict of interest statement
CA is an owner and employee of Potentiometric Probes, which develops and sells voltage-sensitive dyes. GS is a non-salaried, founder, executive and Chief Scientific Offer of Clyde Biosciences Ltd (UK). The remaining authors declare that the research was conducted in the absence of any commercial or financial relationships that could be construed as a potential conflict of interest.
Figures
Similar articles
-
Cardiac Optogenetics and Optical Mapping - Overcoming Spectral Congestion in All-Optical Cardiac Electrophysiology.Front Physiol. 2019 Mar 7;10:182. doi: 10.3389/fphys.2019.00182. eCollection 2019. Front Physiol. 2019. PMID: 30899227 Free PMC article. Review.
-
Optical mapping and optogenetics in cardiac electrophysiology research and therapy: a state-of-the-art review.Europace. 2024 Feb 1;26(2):euae017. doi: 10.1093/europace/euae017. Europace. 2024. PMID: 38227822 Free PMC article. Review.
-
All-Optical Interrogation of Neural Circuits.J Neurosci. 2015 Oct 14;35(41):13917-26. doi: 10.1523/JNEUROSCI.2916-15.2015. J Neurosci. 2015. PMID: 26468193 Free PMC article.
-
Macromolecular crowding: chemistry and physics meet biology (Ascona, Switzerland, 10-14 June 2012).Phys Biol. 2013 Aug;10(4):040301. doi: 10.1088/1478-3975/10/4/040301. Epub 2013 Aug 2. Phys Biol. 2013. PMID: 23912807
-
Optogenetic sensors in the zebrafish heart: a novel in vivo electrophysiological tool to study cardiac arrhythmogenesis.Theranostics. 2018 Sep 9;8(17):4750-4764. doi: 10.7150/thno.26108. eCollection 2018. Theranostics. 2018. PMID: 30279735 Free PMC article.
Cited by
-
Portable low-cost macroscopic mapping system for all-optical cardiac electrophysiology.J Biomed Opt. 2023 Jan;28(1):016001. doi: 10.1117/1.JBO.28.1.016001. Epub 2023 Jan 10. J Biomed Opt. 2023. PMID: 36636698 Free PMC article.
-
Computational modeling of cardiac electrophysiology and arrhythmogenesis: toward clinical translation.Physiol Rev. 2024 Jul 1;104(3):1265-1333. doi: 10.1152/physrev.00017.2023. Epub 2023 Dec 28. Physiol Rev. 2024. PMID: 38153307 Free PMC article. Review.
-
A fully-automated low-cost cardiac monolayer optical mapping robot.Front Cardiovasc Med. 2023 May 22;10:1096884. doi: 10.3389/fcvm.2023.1096884. eCollection 2023. Front Cardiovasc Med. 2023. PMID: 37283579 Free PMC article.
-
High-throughput methods for cardiac cellular electrophysiology studies: the road to personalized medicine.Am J Physiol Heart Circ Physiol. 2024 Apr 1;326(4):H938-H949. doi: 10.1152/ajpheart.00599.2023. Epub 2024 Jan 26. Am J Physiol Heart Circ Physiol. 2024. PMID: 38276947 Review.
References
-
- Optogenetics at Stanford. Available online at: https://web.stanford.edu/group/dlab/optogenetics (accessed March 11, 2020).
Publication types
Grants and funding
LinkOut - more resources
Full Text Sources