. 2022 Oct;50(10):1396-1413.
doi: 10.1124/dmd.121.000477. Epub 2021 Dec 2.

Perfluorinated Carboxylic Acids with Increasing Carbon Chain Lengths Upregulate Amino Acid Transporters and Modulate Compensatory Response of Xenobiotic Transporters in HepaRG Cells

Affiliations

Perfluorinated Carboxylic Acids with Increasing Carbon Chain Lengths Upregulate Amino Acid Transporters and Modulate Compensatory Response of Xenobiotic Transporters in HepaRG Cells

Joe Jongpyo Lim et al. Drug Metab Dispos. 2022 Oct.

Abstract

Perfluorinated carboxylic acids (PFCAs) are widespread environmental pollutants for which human exposure has been documented. PFCAs at high doses are known to regulate xenobiotic transporters partly through peroxisome proliferator-activated receptor alpha (PPARα) and constitutive androstane receptor (CAR) in rodent models. Less is known regarding how various PFCAs at a lower concentration modulate transporters for endogenous substrates, such as amino acids in human hepatocytes. Such studies are of particular importance because amino acids are involved in chemical detoxification, and their transport system may serve as a promising therapeutic target for structurally similar xenobiotics. The focus of this study was to further elucidate how PFCAs modulate transporters involved in intermediary metabolism and xenobiotic biotransformation. We tested the hepatic transcriptomic response of HepaRG cells exposed to 45 μM of perfluorooctanoic acid, perfluorononanoic acid, or perfluorodecanoic acid in triplicates for 24 hours (vehicle: 0.1% DMSO), as well as the prototypical ligands for PPARα (WY-14643, 45 μM) and CAR (6-(4-chlorophenyl)imidazo[2,1-b][1,3]thiazole-5-carbaldehyde O-(3,4-dichlorobenzyl)oxime [CITCO], 2 μM). PFCAs with increasing carbon chain lengths (C8-C10) regulated more liver genes, with amino acid metabolism and transport ranked among the top enriched pathways and PFDA ranked as the most potent PFCA tested. Genes encoding amino acid transporters, which are essential for protein synthesis, were novel inducible targets by all three PFCAs, suggesting a potentially protective mechanism to reduce further toxic insults. None of the transporter regulations appeared to be through PPARα or CAR but potential involvement of nuclear factor erythroid 2-related factor 2 is noted for all 3 PFCAs. In conclusion, PFCAs with increasing carbon chain lengths up-regulate amino acid transporters and modulate xenobiotic transporters to limit further toxic exposures in HepaRG cells. SIGNIFICANCE STATEMENT: Little is known regarding how various perfluorinated carboxylic acids modulate the transporters for endogenous substrates in human liver cells. Using HepaRG cells, this study is among the first to show that perfluorinated carboxylic acids with increasing carbon chain lengths upregulate amino acid transporters, which are essential for protein synthesis, and modulate xenobiotic transporters to limit further toxic exposures at concentrations lower than what was used in the literature.


Figures

Fig. 1.
Fig. 1.
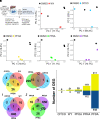
(A) Experimental design: HepaRG cells were exposed to 0.1% DMSO (vehicle control), 6-(4-chlorophenyl)imidazo[2,1-b][1,3]thiazole-5-carbaldehyde O-(3,4-dichlorobenzyl)oxime (CITCO, constitutive androstane receptor ligand), WY-14643 (WY, peroxisome proliferator-activated receptor a ligand), perfluorooctanoic acid (PFOA), perfluorooctanoic acid (PFNA), or perfluorodecanoic acid (PFDA). RNA was extracted and whole transcriptome RNA sequencing was conducted. The transcriptomic changes following each chemical exposure, as well as the predicted upstream regulators, were quantified. The mRNA levels in genes involved in liver functions, i.e., xenobiotic metabolism, transporters, bile acid metabolism, amino acid metabolism, and carbohydrate metabolism were assessed. A specific focus of the present study was to assess the regulation of various xenobiotic and endobiotic transporters by perfluorinated carboxylic acids and their predicted upstream transcription factors. PCA results showing the first two principal components comparing DMSO to WY (B), CITCO (C), PFOA (D), PFNA (E), and PFDA (F). G. Venn diagram comparing CITCO, WY, and PFOA. F. Venn diagram comparing CITCO, WY, and PFNA. H. Venn diagram comparing CITCO, WY, and PFDA. I. Venn diagram comparing PFOA, PFNA, and PFDA. K. Number of differentially regulated genes as defined by false discovery rate–Benjamini-Hochberg adjusted p-value < 0.05 and absolute fold change > 1.5 by each chemical.
Fig. 2.
Fig. 2.
(A) Volcano plot showing differentially regulated genes by perfluorooctanoic acid relative to DMSO. Top 5 up- (B) and down- (C) regulated gene ontology terms from perfluorooctanoic acid. Color gradient represents false discovery rate-adjusted p-value. Vertical line shows statistical threshold (false discovery rate–Benjamini-Hochberg adjusted p-value < 0.05). Differentially regulated genes (false discovery rate–Benjamini-Hochberg adjusted p-value < 0.05 and absolute fold change > 1.5) were used for all plots.
Fig. 3.
Fig. 3.
(A) Volcano plot showing differentially regulated genes by perfluorooctanoic acid relative to DMSO. Top 5 up- (B) and down- (C) regulated gene ontology terms from perfluorooctanoic acid. Color gradient represents false discovery rate-adjusted p-value. Vertical line shows statistical threshold (FDR-BH < 0.05). Differentially regulated genes (FDR-BH < 0.05 and absolute fold change > 1.5) were used for all plots.
Fig. 4.
Fig. 4.
(A) Volcano plot showing differentially regulated genes by perfluorodecanoic acid relative to DMSO. Top 5 up- (B) and down- (C) regulated gene ontology terms from perfluorodecanoic acid. Color gradient represents false discovery rate-adjusted p-value. Vertical line shows statistical threshold (false discovery rate–Benjamini-Hochberg adjusted p-value < 0.05). Differentially regulated genes (false discovery rate–Benjamini-Hochberg adjusted p-value < 0.05 and absolute fold change > 1.5) were used for all plots.
Fig. 5.
Fig. 5.
One-way hierarchical clustering of genes involved in phase-I and -II metabolism (A) and transporters (B) as regulated by 6-(4-chlorophenyl)imidazo[2,1-b][1,3]thiazole-5-carbaldehyde O-(3,4-dichlorobenzyl)oxime, WY-14643, perfluorooctanoic acid, perfluorooctanoic acid, and perfluorodecanoic acid. All differentially expressed genes at least by one exposure group were used for hierarchical clustering. Higher expression is shown in red and lower expression is represented in blue. All differentially expressed genes (false discovery rate–Benjamini-Hochberg adjusted p-value < 0.05) without fold-change threshold were categorized and used. Colored bars in heatmaps represent genes that are differentially regulated in a particular exposure group, i.e., 6-(4-chlorophenyl)imidazo[2,1-b][1,3]thiazole-5-carbaldehyde O-(3,4-dichlorobenzyl)oxime – red, WY-14643 – blue, perfluorooctanoic acid – yellow, perfluorooctanoic acid – green, perfluorodecanoic acid – purple.
Fig. 6.
Fig. 6.
Bar plots showing the up-regulation of ABC transporters by 6-(4-chlorophenyl)imidazo[2,1-b][1,3]thiazole-5-carbaldehyde O-(3,4-dichlorobenzyl)oxime, WY-14643, perfluorooctanoic acid, perfluorooctanoic acid, or perfluorodecanoic acid. Data are expressed as mean ± standard error (SE). Bar plots were made by using Sigma Plot (SPSS, Inc., Chicago, IL). Asterisks represent statistically significant differences as compared with the 0.1% DMSO-exposed vehicle group (DESeq2, false discovery rate–Benjamini-Hochberg adjusted p-value < 0.05).
Fig. 7.
Fig. 7.
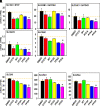
Bar plots showing the up-regulation of amino acids transporters by 6-(4-chlorophenyl)imidazo[2,1-b][1,3]thiazole-5-carbaldehyde O-(3,4-dichlorobenzyl)oxime, WY-14643, perfluorooctanoic acid, perfluorooctanoic acid, or perfluorodecanoic acid. Data are expressed as mean ± standard error (SE). Bar plots were made by using Sigma Plot (SPSS, Inc., Chicago, IL). Asterisks represent statistically significant differences as compared with the 0.1% DMSO-exposed vehicle group (DESeq2, false discovery rate–Benjamini-Hochberg adjusted p-value < 0.05).
Fig. 8.
Fig. 8.
Bar plots showing the up-regulation of other SLC transporters by 6-(4-chlorophenyl)imidazo[2,1-b][1,3]thiazole-5-carbaldehyde O-(3,4-dichlorobenzyl)oxime, WY-14643, perfluorooctanoic acid, perfluorooctanoic acid, or perfluorodecanoic acid. Data are expressed as mean ± standard error (SE). Bar plots were made by using Sigma Plot (SPSS, Inc., Chicago, IL). Asterisks represent statistically significant differences as compared with the 0.1% DMSO-exposed vehicle group (DESeq2, false discovery rate–Benjamini-Hochberg adjusted p-value < 0.05).
Fig. 9.
Fig. 9.
Bar plots showing the down-regulation of SLC transporters by 6-(4-chlorophenyl)imidazo[2,1-b][1,3]thiazole-5-carbaldehyde O-(3,4-dichlorobenzyl)oxime, WY-14643, perfluorooctanoic acid, perfluorooctanoic acid, or perfluorodecanoic acid. Data are expressed as mean ± standard error (SE). Bar plots were made by using Sigma Plot (SPSS, Inc., Chicago, IL). Asterisks represent statistically significant differences as compared with the 0.1% DMSO-exposed vehicle group (DESeq2, false discovery rate–Benjamini-Hochberg adjusted p-value < 0.05).
Fig. 10.
Fig. 10.
Bar plots showing the down-regulation of other SLC transporters by 6-(4-chlorophenyl)imidazo[2,1-b][1,3]thiazole-5-carbaldehyde O-(3,4-dichlorobenzyl)oxime, WY-14643, perfluorooctanoic acid, perfluorooctanoic acid, or perfluorodecanoic acid. Data are expressed as mean ± standard error (SE). Bar plots were made by using Sigma Plot (SPSS, Inc., Chicago, IL). Asterisks represent statistically significant differences as compared with the 0.1% DMSO-exposed vehicle group (DESeq2, false discovery rate–Benjamini-Hochberg adjusted p-value < 0.05).
Fig. 11.
Fig. 11.
Diagram representing a summary of key findings and working hypothesis. In the present study, the transcriptomic changes from perfluorinated carboxylic acids (PFCAs) were investigated compared with CAR and peroxisome proliferator-activated receptor (PPAR)α activation. PFCAs altered the expression of genes involved in xenobiotic biotransformation (phase-I and -II metabolism, and transporters), as well as bile acid (BA), amino acid, and carbohydrate metabolism. The transcriptomic changes of PFCAs were correlated with the length of the carbon chains, with perfluorooctanoic acid having the least and perfluorodecanoic acid (PFDA) producing the greatest transcriptomic effect as evidenced by the number and degree of differentially regulated genes. Overall, at the transcriptome-wide scale, all PFCAs were predicted to activate ATF4 and PPARα and inhibit HNF4A. All PFCAs were also predicted to significantly modulate the PXR-signaling. perfluorooctanoic acid and PFNA were predicted to inhibit HIF1A (note: PFDA was also predicted to significantly modulate the HIF1A signaling). Regarding the transporters, NRF2 was predicted to be altered by all three PFCAs to regulate the transporter mRNAs. PFNA and PFDA were predicted to activate upstream regulators involved in xenobiotic biotransformation, signaling molecule regulation, and lipid sensing and metabolism (AHR, ESR1, PGR, and PPARG) to regulate the transporter mRNAs. Therefore, we hypothesize that key transcription factors, such as ATF4 and NRF2 play critical roles in regulating downstream signatures of xenobiotic, carbohydrates, and amino acid metabolism from PFCAs. Several categories of transporters were differentially regulated, including an up-regulation in many amino acid transporters and several xenobiotic efflux transporters, as well as a down-regulation of several xenobiotic and BA uptake transporters, with PFDA having the most potent effect.

Similar articles

Cited by

References

    1. Alexa A, Rahnenfuhrer J (2021) topGO: Enrichment Analysis for Gene Ontology. R package version 2.44.0.
    1. Abe TTakahashi MKano MAmaike YIshii CMaeda KKudoh YMorishita THosaka TSasaki T, et al. (2017) Activation of nuclear receptor CAR by an environmental pollutant perfluorooctanoic acid. Arch Toxicol 91:2365–2374. - PubMed
    1. Aleksunes LM and Klaassen CD (2012) Coordinated regulation of hepatic phase I and II drug-metabolizing genes and transporters using AhR-, CAR-, PXR-, PPARα-, and Nrf2-null mice. Drug Metab Dispos 40:1366–1379. - PMC - PubMed
    1. Behr AC, Kwiatkowski A, Ståhlman M, Schmidt FF, Luckert C, Braeuning A, and Buhrke T (2020) Impairment of bile acid metabolism by perfluorooctanoic acid (PFOA) and perfluorooctanesulfonic acid (PFOS) in human HepaRG hepatoma cells. Arch Toxicol 94:1673–1686. - PMC - PubMed
    1. Boisvert G, Sonne C, Rigét FF, Dietz R, Letcher RJ (2019) Bioaccumulation and biomagnification of perfluoroalkyl acids and precursors in East Greenland polar bears and their ringed seal prey. Environ Pollut 252 (Pt B):1335–1343. - PubMed

Publication types