. 2021 Dec 1:10:e70691.
doi: 10.7554/eLife.70691.

Cyclin F drives proliferation through SCF-dependent degradation of the retinoblastoma-like tumor suppressor p130/RBL2

Affiliations

Cyclin F drives proliferation through SCF-dependent degradation of the retinoblastoma-like tumor suppressor p130/RBL2

Taylor P Enrico et al. Elife. .

Abstract

Cell cycle gene expression programs fuel proliferation and are universally dysregulated in cancer. The retinoblastoma (RB)-family of proteins, RB1, RBL1/p107, and RBL2/p130, coordinately represses cell cycle gene expression, inhibiting proliferation, and suppressing tumorigenesis. Phosphorylation of RB-family proteins by cyclin-dependent kinases is firmly established. Like phosphorylation, ubiquitination is essential to cell cycle control, and numerous proliferative regulators, tumor suppressors, and oncoproteins are ubiquitinated. However, little is known about the role of ubiquitin signaling in controlling RB-family proteins. A systems genetics analysis of CRISPR/Cas9 screens suggested the potential regulation of the RB-network by cyclin F, a substrate recognition receptor for the SCF family of E3 ligases. We demonstrate that RBL2/p130 is a direct substrate of SCFcyclin F. We map a cyclin F regulatory site to a flexible linker in the p130 pocket domain, and show that this site mediates binding, stability, and ubiquitination. Expression of a mutant version of p130, which cannot be ubiquitinated, severely impaired proliferative capacity and cell cycle progression. Consistently, we observed reduced expression of cell cycle gene transcripts, as well a reduced abundance of cell cycle proteins, analyzed by quantitative, iterative immunofluorescent imaging. These data suggest a key role for SCFcyclin F in the CDK-RB network and raise the possibility that aberrant p130 degradation could dysregulate the cell cycle in human cancers.

Keywords: RBL2/p130; SCF; cancer biology; cell biology; cell cycle; cyclin F; human; retinoblastoma; ubiquitin.


Conflict of interest statement

TE, WS, EW, PN, XW, SR, NB, JP, ME No competing interests declared

Figures
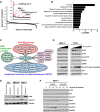
Figure 1.
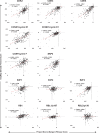
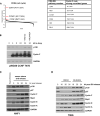
Figure 1.. Analysis of the Cancer Dependency Map reveals that CCNF is highly correlated with the CDK-RB network.
(A) Cancer Dependency Map data from project Achilles were analyzed to identify the impact of gene loss-of-function on cellular fitness, and fitness correlation with that of CCNF, based on pooled CRISPR/Cas9 gene knockout screens performed in 789 cell lines. Pearson’s correlation coefficients are reported for all gene pairs (each dot corresponds to a single CCNF-gene X pair). The Pearson’s correlations for CCNF compared to 17,634 other genes are shown. The CDK-RB network members highlighted in red all score in the top 0.5% of genes whose impact on fitness is most highly correlated with CCNF. (B) Gene ontology (GO) analysis was performed for the top 0.05% of genes whose impact on fitness is most highly correlated with CCNF. The top 10 enriched GO terms and their corresponding p-value is shown. (C) The top 0.05% of genes whose impact on fitness is most highly correlated with CCNF were sorted by the GO term cell division (GO:0051301). A graphical representation of the remaining 21 genes is shown. Genes are grouped by their known associations with specific functional pathways or complex, including CDK-RB, Nde1-kinetochore, or APC/C. (D) MCF-7 and T47D cells were engineered to contain a TET-inducible cyclin F transgene. Cells were treated with 0 (vehicle control), 5, 25, or 100 ng/ml of doxycycline to induce cyclin F expression, and the indicated proteins were analyzed by immunoblot. No band was detected for CDK6 in T47D cells. Representative of n=3 experiments. (E) BJ, IMR-90, and NHF-1 human fibroblast cell lines were synchronized in G0 by 48 hr serum starvation (quiescent) or allowed to proliferate normally (asynchronous). Whole-cell extracts were collected for immunoblot analysis. Representative of n=3 experiments. (F) NHF-1 cells were synchronized in G0 by serum starvation for 48 hr. Cells were then released into the cell cycle upon the addition of serum-containing media supplemented with either MLN4924 or vehicle (DMSO) as a control. Cells were collected at the indicated time points after release. Protein levels were assessed by immunoblot. Data represent n=3 independent experiments.
Figure 1—figure supplement 1.
Figure 1—figure supplement 1.. Analysis of Project Achilles Dependency Map reveals that highly correlated genes encode proteins known to interact.
(A) Cancer Dependency Map data from Project Achilles were analyzed to identify genes whose loss-of-function impact on cellular fitness is correlated with known proliferative regulators. Data are based on pooled CRISPR/Cas9 gene knockout screens performed in 789 cell lines. Pearson’s correlation coefficients for genes correlated with MCM2, CDK2, MAPK1, and ATG7. Known interactors are highlighted in red. Pearson’s correlation coefficients are reported for all gene pairs (each dot corresponds to a gene pair).
Figure 1—figure supplement 2.
Figure 1—figure supplement 2.. Gene dependency scores from the Broad Institute Project Achilles Dependency Map data set and the Sanger Project Score data set correlate highly.
Fitness scores for gene knockouts of CDK2, CDK4, CDK6, CCND1, CCNE1, E2F1, E2F2, E2F3, RB1, RBL1, and RBL2 were independently determined for Project Achilles (Broad Institute) and for Project Score (Sanger) in hundreds of cancer cell lines. Of the cell lines tested, 189 cell lines are included in both data sets. The fitness score from the Project Achilles Dependency Map (DEPMAP) data set was plotted versus the gene dependency scores independently determined and included in the Sanger Project Score data set. Linear fit and R2 values were calculated to compare the two data sets.
Figure 1—figure supplement 3.
Figure 1—figure supplement 3.. Analysis of Project Achilles Dependency Map reveals that CDK-RB network genes correlate highly with CCNF.
(A) Pearson’s correlation coefficients for genes whose fitness score correlates with CDK4. Genes of interest are highlighted in red (left). CCNF rank among genes correlated with CDK4, CDK6, CCND1, RB1, RBL1, and RBL2 (right). (B) T47D cells engineered to contain a TET-inducible cyclin F transgene were treated with 100 ng/ml doxycycline to induce cyclin F expression. Cells were collected at the indicated time points. Where indicated, the proteasome inhibitor, MG132, or the neddylation inhibitor, MLN4924, was added. Proteins were analyzed by immunoblot. Representative of n=2 experiments. (C) NHF-1 cells were synchronized in G0 by 48 hr serum starvation (time 0 hr) and then released into the cell cycle by re-introduction of serum-containing media. Cells were collected at the indicated times and immunoblotted. Untreated, asynchronous cells (lane 1) are shown as a control. Representative of n=3 experiments. (D) T98G cells were synchronized in G0 by serum starvation for 48 hr. Cells were then released into the cell cycle upon the addition of serum-containing media supplemented with either MLN4924 or vehicle (DMSO) as a control. Cells were collected at the indicated time points after release. Protein levels were assessed by immunoblot. Data represent n=2 independent experiments for T98G cells and n=3 independent experiments for NHF-1 cells.
Figure 2.
Figure 2.. Cyclin F regulates and interacts with endogenous p130.
(A) Asynchronously proliferating CCNF CRISPR/Cas9 knockouts (sgCCNF) and control (sgCtrl) HeLa cells were blotted for levels of the indicated proteins. Representative of n=3 experiments. (B) NHF-1 and IMR-90 cells were transfected with two different siRNAs targeting CCNF or a control siRNA targeting Firefly Luciferase (siFF). Whole-cell lysates were immunoblotted for the indicated proteins. Representative of n=3 experiments. (C) Endogenous cyclin F was immunoprecipitated from asynchronously proliferating HEK293T cells (left) or asynchronously proliferating U2OS cells (right). Indicated proteins were immunoblotted. SE=short exposure; LE=long exposure; representative of n=3 experiments.
Figure 2—figure supplement 1.
Figure 2—figure supplement 1.. Cyclin F knockout and depletion across cell lines.
(A) CCNF CRISPR/Cas9 knockouts (sgCCNF) and control (sgCtrl) HeLa cells were synchronized in S-phase by double thymidine block and then released synchronously into the cell cycle upon the addition of drug-free media. Protein levels were monitored at the indicated time points by immunoblot. Representative of n=3 experiments. (B–D) Cells were fixed, stained with propidium iodide, and flow cytometry was performed to determine cell cycle distribution for NHF-1 cells treated with siFF or siCCNF (B), IMR-90 cells treated with siFF or siCCNF (C), and CCNF CRISPR/Cas9 knockouts (sgCCNF) and control (sgCtrl) HeLa cells (D). Data represent n=3 experiments.
Figure 3.
Figure 3.. Cyclin F promotes p130 degradation.
(A) HEK293T cells transiently expressing HA-p130 with an empty FLAG vector control (lane 1) or together with increasing amounts of FLAG-cyclin F (lanes 2–4). Cells were collected and analyzed by immunoblot 24 hr post-transfection. The antigen being immunoblotted for is represented by the underline, here and in all experiments below. Representative of n=3 experiments. (B) HEK293T cells transiently expressing HA-p130 with an empty FLAG vector control (lane 1) or together with FLAG-cyclin F (lanes 2–4). MG132 (proteasome inhibitor) or MLN4924 (neddylation inhibitor) were added for 6 hr prior to harvesting. Cells were collected and analyzed by immunoblot 24 hr post-transfection. Representative of n=3 experiments. (C) HEK293T cells transiently expressing HA-p130 with an empty FLAG vector control (lane 1) or together with FLAG-cyclin F WT (lane 2) or FLAG-cyclin F(M309A L313A) (lane 3), as indicated. Cells were collected and analyzed by immunoblot 24 hr post-transfection. Representative of n=3 experiments. (D) HEK293T cells transiently expressing HA-p130 with an empty FLAG vector control (lane 1) or together with the indicated FLAG-tagged F-box proteins (lanes 2–6). Cells were collected and analyzed by immunoblot 24 hr post-transfection. Representative of n=3 experiments.
Figure 3—figure supplement 1.
Figure 3—figure supplement 1.. P130 levels following Fbox protein expression in U2OS cells.
(A) U2OS cells transiently expressing HA-p130 with an empty FLAG vector control (lane 1) or together with the indicated FLAG-tagged F-box proteins (lanes 2–5). Cells were collected and analyzed by immunoblot 24 hr post-transfection. Representative of n=3 experiments.
Figure 4.
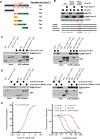
Figure 4.. Cyclin F binds p130 directly and promotes p130 degradation through a conserved degron motif.
(A) Graphical depiction of p130 domain structure. Indicated p130 truncation mutants were screened for their ability to be degraded following co-overexpression with cyclin F. The data supporting these conclusions are shown in Figure 4—figure supplement 1. (B) The first and last amino acids in the two potential cyclin F binding sites in the p130 spacer domain (R658-I660 and R680-L682) were mutated to alanine (AxA). HEK293T cells transiently expressed HA-p130 alone (WT or AxA mutants, as indicated) or together with FLAG-cyclin F WT. Cells were collected and analyzed by immunoblot 24 hr post-transfection. Representative of n=3 experiments (top) and amino acid sequence alignment for human, mouse, frog, and chicken p130 (bottom). (C) GST-p130593–790 (WT) and GST-p130593–790 (AA) were produced in Escherichia coli and purified. FLAG-cyclin F was transiently expressed in HEK293T cells. GST pulldowns (left) and FLAG pulldowns (right) were used to determine the interaction of p130 and cyclin F. Interaction was assessed by immunoblot after pulldown (representative of n=3 experiments). (D) GST-p130(WT) and FLAG-cyclin F(WT) or FLAG-cyclin F(M309A L313A) were expressed as described in (C). Interaction and binding were assessed as in (C) (representative of n=3 experiments). (E) Fluorescence polarization anisotropy assay to detect direct association of p130 with cyclin F. (Left) 10 nM TAMRA-p130674–692 probe was titrated with increasing concentrations of purified GST-cyclin F25–546-Skp1. (Right) The p130 probe bound with 0.5 μM GST-cyclin F25–546-Skp1 was displaced with increasing concentrations of the indicated p130 protein construct or E2F184–99 peptide. Experiments were performed in triplicate, and the standard deviation is reported as the error.
Figure 4—figure supplement 1.
Figure 4—figure supplement 1.. Requirements for cyclin F binding and degradation of p130 in vivo and in vitro.
(A) HEK293T cells were transiently transfected for 24 hr with the indicated HA-tagged p130 truncations either alone or in combination with FLAG-cyclin F. MG132 or MLN4924 were added for the last 6 hr where indicated. Cells were collected 24 hr post-transfection and analyzed by immunoblot. (Top) p130 full-length (amino acids 1–1139), p1301–417, p130418–1139, p130418–616, p130418–827, and p130418–1024 and (Bottom) p130828–1139 and p130418–1139. Blots are representative of n=3 replicate experiments. SE=short exposure; ME=medium exposure; LE=long exposure; WLE=wicked long exposure. (B) Additional fluorescence polarization anisotropy assay to detect direct association of E2F1 and p130 with cyclin F. (Left) 10 nM TAMRA-E2F184–99 was titrated with increasing concentrations of purified GST-cyclin F25–546-Skp1. (Right) The E2F1 probe bound with 0.5 μM GST-cyclin F25–546-Skp1 was displaced with increasing concentrations of the indicated p130 protein construct or synthetic peptide (residues 674–692). Experiments were performed in triplicate, and the standard deviation is reported as the error.
Figure 5.
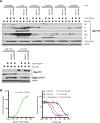
Figure 5.. SCFCyclin F regulates the ubiquitination and stability of p130.
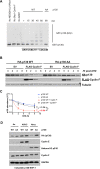
(A) Ubiquitination reactions were performed with SCFcyclin F, ARIH1/UBCH7, and CDC34B. GST-tagged p130593–790 WT and GST-p130593–790 were used as substrates and detected by immunoblot against GST. Data are representative of n=3 experiments. (B) FLAG-cyclin F, HA-p130(WT), and/or HA-p130(AA) were transiently expressed in HEK293T cells for 24 hr. The protein synthesis inhibitor cycloheximide (CHX) was added and cells were collected at the indicated time points. Protein levels were determined by immunoblot. Representative of n=3 experiments. (C) Quantification of (B). *=p<0.05 (Student’s t-test). Data are shown as mean ± SEM for n=3 experiments. (D) Inducible p130 NHF-1 cells were grown in media-containing 100 ng/ml doxycycline for 14 days to induce p130 expression, or in media-containing vehicle control. On indicated days, cells were pulsed with EdU for 30 min prior to harvest/fixation, DNA was stained with DAPI, and cells were analyzed by flow cytometry. Data for S- and G2/M phases are in Figure 6—figure supplement 1D. Data represent mean ± SEM for n=3 replicates.
Figure 5—figure supplement 1.
Figure 5—figure supplement 1.. p130 stability in U2OS and NHF-1 cells.
(A) HA-p130(WT) with or without FLAG-cyclin F was transiently expressed in U2OS cells for 24 hr. The protein synthesis inhibitor cycloheximide (CHX) was added and cells were collected at the indicated time points. Protein levels were determined by immunoblot. Representative of n=2 experiments. (B) p130(WT) and p130(AA) expression is induced with 100 ng/ml doxycycline for 24 hr. No p130 expression is detected in vehicle control (water) inductions. (C) Inducible p130 NHF-1 cells were grown for 24 hr in media-containing 100 ng/ml doxycycline. Then, media was replaced with fresh media supplemented with doxycycline plus vehicle (control), aphidicolin (S-phase synchronization), or nocodazole (mitotic synchronization) for 24 hr. Total protein lysates were immunoblotted for the indicated proteins.
Figure 5—figure supplement 2.
Figure 5—figure supplement 2.. Both p130(WT) and p130(AA) can be phosphorylated and can associate with cyclin E, cyclin A, the DREAM complex, Large T antigen, and E7 protein.
(A–C) Inducible p130(WT) and p130(AA) NHF-1 cells were grown in 100 ng/ml doxycycline for 24 hr. (A) HA-tagged p130 was immunoprecipitated using an anti-HA antibody (or IgG control), and the indicated proteins were immunoblotted. Representative of n=2 independent experiments. (B) Endogenous cyclin A was immunoprecipitated, and the indicated proteins were immunoblotted. Representative of n=3 independent experiments. (C) HA-tagged p130 was isolated using anti-HA affinity resin, and the indicated proteins were immunoblotted. Representative of n=3 independent experiments. (D) Inducible p130(WT) and p130(AA) NHF-1 cells were grown in 100 ng/ml doxycycline for 24 hr. Cells were lysed in phosphatase-free lysis buffer. Total protein lysates were treated with control (buffer), Calf intestinal phosphatase (CIP), or CIP plus a phosphatase inhibitor cocktail for 1 hr at 37°C. Indicated proteins were immunoblotted. Representative of n=2 independent experiments. (E, F) HA-p130(WT) or HA-p130(AA) were transiently transfected into 293T (E) or HeLA (F) cells for 24 hr. The HA-p130 and any co-immunoprecipitating proteins were isolated using HA affinity gel, and indicated proteins were immunoblotted. Representative of n=2 experiments.
Figure 6.
Figure 6.. Cells expressing p130(AA) exhibit proliferation defects.
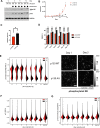
(A) NHF-1 cells were engineered to express a TET-inducible HA-p130(WT) or HA-p130(AA) transgene. Doxycycline (100 ng/ml) was used to induce p130 expression, and water was used as a vehicle control. HA-p130 levels were assessed by immunoblot after cells were grown in doxycycline for up to 14 days. (B) Inducible p130 NHF-1 cells were grown in 100 ng/ml doxycycline-containing media for 14 days to induce p130 expression. Cells were counted on the indicated days. Data represent mean ± SEM for n=3 independent experiments. (C) Doubling time was calculated from counting experiment in (B). Error bars are SEM for n=3 independent experiments. Representative of n=2 independent experiments. (D) NHF-1 cells were grown in media supplemented with nocodazole for 16 hr, then immunoblotted for the indicated proteins. Representative of n=2 independent experiments. (E–G) Inducible p130 NHF-1 cells were grown in 100 ng/ml doxycycline for indicated times. Cells were fixed and analyzed by iterative immunofluorescent staining and imaging. Distributions of single-cell measurements are shown for nuclear phosphorylated versus total RB (E, left) and representative images of phosphorylated RB are shown for indicated days (E, right). Distributions of single-cell measurements are also shown for cytoplasmic p21 (F) and nuclear versus cytoplasmic p130 (G), as indicated.
Figure 6—figure supplement 1.
Figure 6—figure supplement 1.. TET-inducible p130(WT) and p130(AA) NHF-1 cells proliferate rapidly prior to induction of p130 expression.
(A) Inducible p130 NHF-1 cells were grown in 100 ng/ml doxycycline-containing media for 14 days to induce p130 expression. Cell number/viability were assessed on the indicated days using the PrestoBlue assay. Data represent mean ± SEM for n=3 independent experiments. (B) Inducible p130(WT) and p130(AA) NHF-1 cells were grown for 2 weeks in media-containing vehicle (water) as control induction of p130. Cells were counted at the indicated times. Data represent mean of n=3 experiments ± SEM. (C) Doubling time was calculated from counting data in (B). Error bars are SEM. (D) Inducible p130 NHF-1 cells were grown in media-containing 100 ng/ml doxycycline for 14 days to induce p130 expression, or in media-containing vehicle control. On indicated days, cells were pulsed with EdU for 30 min prior to harvest/fixation, DNA was stained with DAPI, and cells were analyzed by flow cytometry. Data for G1-phase is in Figure 6D. Data represent the mean of n=3 independent experiments ± SEM.
Figure 6—figure supplement 2.
Figure 6—figure supplement 2.. Cell cycle distribution and p130 staining from 4i experiments.
(A, B) Inducible p130 NHF-1 cells were grown in 100 ng/ml doxycycline for indicated time, then protein expression and protein localization were visualized by 4i staining. (A) DNA content assessed by DAPI staining. (B) p130 localization.
Figure 7.
Figure 7.. DREAM targets are downregulated in cells expressing p130(AA).
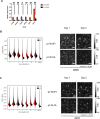
(A) Inducible p130(WT) and p130(AA) NHF-1 cells were grown for 8 days in media-containing 100 ng/ml doxycycline to induce p130 expression. RNA was extracted for rt-qPCR analysis. Gene expression is relative to GAPDH expression and normalized to the vehicle control. Data are mean of n=3 experiments, and error bars are SEM. (B, C) Inducible p130 NHF-1 cells were grown in 100 ng/ml doxycycline for indicated times, and protein levels of CDC6 (B) and Cdt1 (C) were analyzed by iterative immunofluorescent staining and fixed cell imaging. Distributions of single-cell measurements of Cytoplasmic CDC6 (B) and nuclear CDT1 (C) were plotted (left) and representative images are shown for the indicated days (right).
Figure 7—figure supplement 1.
Figure 7—figure supplement 1.. RT-pPCR for DREAM target genes in NHF-1 cells expressing control versus p130(WT) versus p130(A).
(A) Inducible p130(WT) and p130(AA) NHF-1 cells were grown in for 8 days in media-containing 100 ng/ml doxycycline to induce p130 expression (or containing water as a control). RNA was extracted for rt-qPCR analysis. Gene expression is relative to GAPDH expression and normalized to the vehicle control. Data are mean of n=3 experiments and error bars are SEM.
Figure 7—figure supplement 2.
Figure 7—figure supplement 2.. Apoptosis and DNA damage markers in cells expressing p130(WT) or p130(AA).
(A) Inducible p130(WT) and p130(AA) NHF-1 cells were grown in 100 ng/ml doxycycline-containing media for the indicated number of days. Cells were collected on the indicated days and analyzed by immunoblot for the indicated proteins. As a positive control for apoptosis, cells were treated with the broad-spectrum kinase inhibitor staurosporine (or DMSO as a control). Representative of n=2 independent experiments. (B) Inducible p130 (WT) and p130 (AA) NHF-1 cells were grown and treated as in (A). Cells were stained for Annexin V and DNA content (propidium idodide), and flow cytometry was performed to determine the presence of apoptosis/necrosis. Representative of n=3 independent experiments. (C–E) Inducible p130 NHF-1 cells were grown in 100 ng/ml doxycycline for the indicated time, then protein expression in single cells was visualized by 4i staining for (C) total 53BP1 levels; (D) total phospho-chk1 levels; and (E) total phospho-H2A.X levels.
Figure 8.
Figure 8.. CDK4/6 inhibitors and CCNF knockout correlate highly.
Project Achilles Dependency Map data sets were analyzed to determine: (A) Pearson’s correlation coefficients for gene knockout correlated with Palbociclib treatment. (B) Pearson’s correlation coefficients for gene knockout correlated with Ribociclib treatment. (C) Pearson’s correlation coefficients for the correlation between CDK4 knockout and 1000 drug treatments. (D) Pearson’s correlation coefficients for the correlation between CCND1 knockout and 1000 drug treatments. (E) Pearson’s correlation coefficients for the correlation between CCNF knockout and 1000 drug treatments. For (A–E), only the top scoring, most statistically significant associations are shown.

Similar articles

Cited by

References

    1. Agostinetto E, Vian L, Caparica R, Bruzzone M, Ceppi M, Lambertini M, Pondé N, de Azambuja E. CDK4/6 inhibitors as adjuvant treatment for hormone receptor-positive, HER2-negative early breast cancer: a systematic review and meta-analysis. ESMO Open. 2021;6:100091. doi: 10.1016/j.esmoop.2021.100091. - DOI - PMC - PubMed
    1. Bai C, Richman R, Elledge SJ. Human cyclin F. The EMBO Journal. 1994;13:6087–6098. doi: 10.1002/j.1460-2075.1994.tb06955.x. - DOI - PMC - PubMed
    1. Bai C, Sen P, Hofmann K, Ma L, Goebl M, Harper JW, Elledge SJ. SKP1 connects cell cycle regulators to the ubiquitin proteolysis machinery through a novel motif, the F-box. Cell. 1996;86:263–274. doi: 10.1016/s0092-8674(00)80098-7. - DOI - PubMed
    1. Baldi A, Esposito V. Differential Tissues and Expression in Primary Lung and in Normal Human Tissues and in Primary Lung Cancer. Clinical Cancer Research. 1997;3:1691–1697. - PubMed
    1. Bassermann F, Eichner R, Pagano M. The ubiquitin proteasome system - implications for cell cycle control and the targeted treatment of cancer. Biochimica et Biophysica Acta. 2014;1843:150–162. doi: 10.1016/j.bbamcr.2013.02.028. - DOI - PMC - PubMed

Publication types