. 2022 Jan 18;132(2):e144983.
doi: 10.1172/JCI144983.

Anakinra restores cellular proteostasis by coupling mitochondrial redox balance to autophagy

Affiliations

Anakinra restores cellular proteostasis by coupling mitochondrial redox balance to autophagy

Frank L van de Veerdonk et al. J Clin Invest. .

Abstract

Autophagy selectively degrades aggregation-prone misfolded proteins caused by defective cellular proteostasis. However, the complexity of autophagy may prevent the full appreciation of how its modulation could be used as a therapeutic strategy in disease management. Here, we define a molecular pathway through which recombinant IL-1 receptor antagonist (IL-1Ra, anakinra) affects cellular proteostasis independently from the IL-1 receptor (IL-1R1). Anakinra promoted H2O2-driven autophagy through a xenobiotic sensing pathway involving the aryl hydrocarbon receptor that, activated through the indoleamine 2,3-dioxygenase 1-kynurenine pathway, transcriptionally activated NADPH oxidase 4 independent of the IL-1R1. By coupling the mitochondrial redox balance to autophagy, anakinra improved the dysregulated proteostasis network in murine and human cystic fibrosis. We anticipate that anakinra may represent a therapeutic option in addition to its IL-1R1-dependent antiinflammatory properties by acting at the intersection of mitochondrial oxidative stress and autophagy with the capacity to restore conditions in which defective proteostasis leads to human disease.

Keywords: Autophagy; Fungal infections; Infectious disease; Inflammation.


Figures
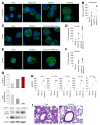
Figure 1
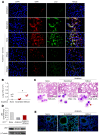
Figure 1. Anakinra induces autophagy and limits inflammation in the absence of IL-1R1.
(AD) LC3 staining of RAW 264.7 cells treated with 50 μM rapamycin, 10 μg/mL anakinra, or a truncated form (Anakinra*) (A and B); exposed to A. fumigatus conidia and treated with anakinra with and without 100 nM bafilomycin for 4 hours (C and D). (E and F) LC3 staining of alveolar macrophages purified from Il1r1–/– naive mice exposed to A. fumigatus conidia and treated with anakinra and/or bafilomycin as above. (B, D, and F) Mean percentage of LC3 puncta/cells (n = 4–22). Data represent the mean ± SEM of 1 representative out of 3 (AD) or 2 (E and F) independent experiments. DAPI was used to detect nuclei. (GI) Il1r1–/– mice were infected (i.n.) with live A. fumigatus conidia, treated with 10 mg/kg anakinra (i.p.) as described in Methods, and assessed for immunoblotting of LC3b and p62 (G), cytokine production (ELISA) in lung homogenates (H), and lung histology [periodic acid-Schiff (PAS) staining] (I) at 7 days after infection. Scale bar: 200 μm. (G and I) A representative experiment is shown; (H) data represent 3 independent experiments. Each independent in vivo experiment includes 6–8 mice per group pooled before analysis. *P < 0.05, **P < 0.01, ***P < 0.001, ****P < 0.0001, treated versus untreated (None) cells. One-way ANOVA, Bonferroni post hoc test.
Figure 2
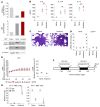
Figure 2. Anakinra affects mitochondrial redox balance in the absence of IL-1R1.
(A) Genes differentially expressed in response to anakinra in purified alveolar macrophages from C57BL/6 and Il1r1–/– mice stimulated in vitro with 10 μg/mL of anakinra for 4 hours. (B and C) Hierarchical clustering (fold change > 2, P value < 0.05, FDR < 0.05) by RNA-Seq of all genes (B) and genes involved in oxidative stress (C). (D) RT-PCR on total lung cells from Il1r1–/–mice at 7 days after A. fumigatus i.n. infection. *P < 0.05 and **P < 0.01, anakinra-treated versus untreated (None) mice. NS, not statistically significant. One-way ANOVA, Bonferroni post hoc test. Data are the mean ± SEM of 1 representative out of 3 independent experiments. (E–G) RAW 264.7 cells were exposed to 10 ng/mL PMA or 10 μg/mL anakinra for 4 hours at 37°C in the presence of diphenylene iodonium (DPI), allopurinol (ALLO), or MitoTEMPO (MITO) with the addition of MitoSOX red (E), DHE (F), and DHR (G) for mitochondrial superoxide, NADPH-dependent superoxide, and mitochondrial hydrogen peroxide assessment, respectively. Fluorescence was measured at 510 excitation and 580 emission. The results presented for all fluorimetric measurements are the mean ± SEM of 1 representative out of 3 independent experiments, tested in duplicate. Two-way ANOVA, Bonferroni post hoc test. (H) Fluorescence of RAW 264.7 cells exposed to anakinra and stained with DCF-DA or MitoSOX red. (I) RAW 264.7 cells were starved or exposed to anakinra before visualization (magnified in the last column) of H2O2/mitochondria colocalization by staining with DCF-DA and MitoTracker red probes, respectively. Starvation was carried out in Earle’s balanced salt solution. DAPI was used to detect nuclei. Images were acquired using the Olympus BX51 fluorescence microscope. For P value, see Supplemental Figure 5.
Figure 3
Figure 3. Anakinra promotes autophagy via mitochondrial H2O2.
(A) Fluorescence images of EGFP-LC3–transfected RAW264.7 cells exposed to anakinra and A. fumigatus conidia for 4 hours alone or upon inhibition of Atg4a or Nox4 by SiRNA. None, cells exposed to scrambled RNA. H2O2 was visualized using 10 μM DHR. Images were acquired using the Olympus BX51 fluorescence microscope and analySIS image processing software (Olympus). DAPI was used to detect nuclei. Data are from 1 representative out of 3 independent experiments. (BE) Il1r1–/– mice were infected and treated with anakinra as in legend to Figure 1, administered SiNox4 or scrambled peptide, and assessed for fungal growth (log10 CFU) (B), histology [PAS staining] I, p62 immunoblotting (D), and LC3 immunofluorescence staining (E) in lung cell lysates or lungs. Insets in C show the bronchoalveolar lavage morphometry with the percentage of polymorphonuclear cells (PMNs) and an arrow indicating the appearance of fungi in SiNox4-treated mice. For CFU, lung staining, and immunoblotting, data are representative of 1 out of 2 independent experiments. Each independent in vivo experiment includes 4 mice per group. *P < 0.05, SiNox4-treated versus scrambled peptide. One-way ANOVA, Bonferroni post hoc test. Effectiveness of silencing was verified by quantitative RT-PCR analysis at 24 hours (Supplemental Figure 9).
Figure 4
Figure 4. Anakinra colocalizes with AhR in Il1r1–/– cells.
(A) Immunofluorescence imaging of cellular localization of FITC-anakinra in alveolar macrophages, isolated from naive C57BL/6 or Il1r1–/– mice, primed with 100 ng/mL LPS for 2 hours at 37°C, and exposed to 10 μg/mL FITC-anakinra for 60 minutes. (B) Immunofluorescence analysis of FITC-anakinra in Il1r1–/– cells exposed to FITC-anakinra at 30 and 60 minutes in the presence of 5 μM cytochalasin D. Insets, percentage positive cells. (C) Il1r1–/– MEF cells were treated with 10 μg/mL anakinra for 0, 2, and 4 hours and assessed for AhR and IL1Ra expression by immunoblotting with specific antibodies. (D) Immunofluorescence imaging of alveolar macrophages from naive C57BL/6 and Il1r1–/– mice primed with 100 ng/mL LPS for 2 hours at 37°C, exposed to 10 μg/mL FITC-anakinra for 60 minutes, and stained with anti-AhR antibody. (E) Immunofluorescence imaging of MEF cells stained with anti-AhR antibody and DAPI and exposed to 10 μg/mL FITC-anakinra for 60 minutes. (F) Il1r1–/– MEF cells were treated with 10 μg/mL anakinra, lysed, immunoprecipitated with anti-AhR antibody, and assessed for IL1Ra and AhR expression by immunoblotting with specific antibodies. None, untreated cells. Representative images, acquired with a fluorescent microscope (BX51), and immunoblots from 2 independent experiments are shown. DAPI was used to detect nuclei. Sections were examined using a Zeiss Axio Observer Z1.
Figure 5
Figure 5. Anakinra activates a xenobiotic sensing pathway via IDO1.
(A) H1L1 cells were treated with different doses of kynurenine and anakinra for 6 hours and assessed for luciferase assay. (B) Representative immunoblots of IL1RA, HSP90, AIP, and AhR and (C) ARNT and AhR in cell lysates in which AhR was immunoprecipitated from Il1r1–/– MEF cells treated with 10 μg/mL anakinra or 10 μM FICZ. In B and C, data are representative of 1 out of 2 independent experiments and the relative densitometric analysis are reported. (D and E) Il1r1–/– MEF cells were treated with 10 μg/mL anakinra for 2 and 8 hours and analyzed for gene expression by a custom QuantiGene plex gene expression assay. Fold changes are reported as heatmap for 2 and 8 hours (D) and histograms for 8 hours (E) (data are representative of 1 out of 2 independent experiments). (F) Il1r1–/– MEF cells were treated with 10 μg/mL anakinra and analyzed for mRNA expression of selected genes by RT-PCR (n = 3 independent samples) and protein expression of IDO1 and SOCS3 by immunoblotting (representative experiment). The relative densitometric analysis is reported. (G) Il1r1–/– MEF cells were treated with either 10 μg/mL anakinra for different times or 10 ng/mL IFN-γ as positive control for 48 hours and assessed for kynurenine production by ELISA. (H) Il1r1–/– MEF cells were treated with 10 μg/mL anakinra in the presence or absence of 10 μM epacadostat and assessed for kynurenine production by ELISA and Cyp1a1 gene expression by RT-PCR (n = 3 independent samples). *P < 0.05, **P < 0.01, ***P < 0.001, treated versus untreated (None or 0 h) cells. One-way ANOVA, Bonferroni post hoc test.
Figure 6
Figure 6. Anakinra promotes AhR transcriptional activity.
(AC) AhR–/– mice were infected and treated with anakinra as in legend to Figure 1 and assessed for immunoblotting of LC3b and p62 (A), cytokine production (ELISA) in lung homogenates (B), and lung histology (PAS staining) at 7 days after infection (C). Scale bar: 200 μm. Data represent 3 independent experiments. Each in vivo experiment includes 6 to 8 mice per group, pooled before analysis. NS, not statistically significant, treated versus untreated (None) cells. One-way ANOVA, Bonferroni post hoc test. (D and E) Ex vivo purified alveolar macrophages and total lung cells from Ahr–/– mice infected and treated with anakinra were assessed for Nox4 and p22phox expression (RT-PCR) (n = 3 independent samples) (D) and H2O2 production (DHR staining) (n = 2 independent samples) (E). (F) Illustration of predicted binding sites from the ALGGEN-PROMO database and the Eukaryotic Promoter Database. (G) Il1r1–/– and Il1r1+/+ MEF cells were treated with 10 μg/mL anakinra. ChIP assay was performed with AhR antibody. IgG was used as negative control. qPCR was conducted at the promoter regions of Nox4. Data are technical replicates of 1 representative out of 2 independent experiments.
Figure 7
Figure 7. Anakinra restores cellular proteostasis in CF.
(AD) CftrF508del mice were infected (i.n.) with live A. fumigatus conidia and treated with anakinra 10 mg/kg (i.p.) for 6 days. (A) Nox4 gene expression in total lung cells at 7 dpi (n = 3 independent samples). None: infected, untreated mice. **P < 0.01, anakinra-treated versus untreated (None) mice. One-way ANOVA, Bonferroni post hoc test. (B) Amplex red fluorescence in purified alveolar macrophages from CftrF508del mice after stimulation with 10 μg/mL anakinra or 10 ng/mL PMA for 4 hours at 37°C. For P values, see Supplemental Figure 5. Two-way ANOVA, Bonferroni post hoc test. (C) Lung and (D) small intestine expression of CFTR in mice infected and treated as above by IHC staining with anti-CFTR CF3 antibody (scale bar: 200 μm). Sections are representative of 3 independent experiments with n = 6 mice per group. C57BL/6 mice are shown as control. Images were acquired high-resolution microscopy (Olympus DP71 using ×100 objective). (E) Immunofluorescence staining of CFTR in CFBE41o cells stably transfected with WT or mutant CFTR and treated with different doses of anakinra for 4 hours at 37°C. Staining was done with the anti-CFTR CF3 antibody followed by Alexa Fluor 555 and Alexa Fluor 488 anti-phalloidin for F-actin labeling. Data are representative of 1 out of 2 (E) or 3 (AD) independent experiments.
Figure 8
Figure 8. Anakinra increases surface expression of p.Phe508del-CFTR via the unconventional secretory pathway.
Cell surface expression of CFTR in HEK293 cells transiently transfected with HA-p.Phe508del-CFTR and HA-WT-CFTR pCDNA3.1 plasmids and treated for 2, 6, or 24 hours with 10 μg/mL of anakinra at 37°C (A). Cells were immunoblotted with the anti-CFTR 596 and anti-calnexin antibodies after cell surface biotinylation and incubation with avidin solution. (B) Immunofluorescence staining of CFTR and GRASP55 in p.Phe508del-CFTR–transfected CFBE41o cells treated with 10 μg/mL anakinra or vehicle (None) at 37°C. Cells were pretreated with GRASP55 SiRNA or brefeldin A for 24 or 6 hours, respectively, at 37°C. Nuclei were counterstained with DAPI. Data are representative of 3 independent experiments.
Figure 9
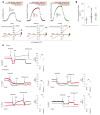
Figure 9. Anakinra increases CFTR activity.
(A) Time course of whole-cell CFTR current densities induced by 10 μM forskolin (Fsk) + 30 μM genistein (Gen) at +50 mV in p.Phe508del-CFTR–transfected FRT cells treated with 10 μg/mL anakinra, 3 μM VX-809, or DMSO (None) for 4 hours at 37°C followed by blockade with CFTR inhibitor 172 (CFTR inh-172). The horizontal bars indicate the time period of drug application. Inset, current ramps from −100 mV to +50 mV (holding potential, −40 mV) in control condition (black trace), after application of Fsk + Gen (red trace), and after application of 1 μM CFTRinh-172 (orange trace). (B) Mean ± SEM CFTR current density measured at +50 mV induced by Fsk and Gen in cells treated with anakinra (n = 20), VX-809 (n = 10), or vehicle (n = 12). *P < 0.05, anakinra versus untreated (None), 1-way ANOVA, Bonferroni post hoc test. (C) CFTR-dependent chloride secretion measured by means of Fsk-induced increase in the Isc in HBE cells from 4 patients with CF and 1 representative control treated with anakinra for 4 hours at 37°C and mounted in Ussing chambers in the presence of CFTR inhibition (CFTR inh-172) and amiloride. **P < 0.01, anakinra-treated versus untreated (None) cells. NS, not statistically significant. Student’s t test. Data are from 2 experiments.

Similar articles

Cited by

References

    1. Bouchecareilh M, Balch WE. Proteostasis: a new therapeutic paradigm for pulmonary disease. Proc Am Thorac Soc. 2011;8(2):189–195. doi: 10.1513/pats.201008-055MS. - DOI - PMC - PubMed
    1. Mizushima N. A brief history of autophagy from cell biology to physiology and disease. Nat Cell Biol. 2018;20(5):521–527. doi: 10.1038/s41556-018-0092-5. - DOI - PubMed
    1. Cadwell K. Crosstalk between autophagy and inflammatory signalling pathways: balancing defence and homeostasis. Nat Rev Immunol. 2016;16(11):661–675. doi: 10.1038/nri.2016.100. - DOI - PMC - PubMed
    1. Balch WE, et al. Malfolded protein structure and proteostasis in lung diseases. Am J Respir Crit Care Med. 2014;189(1):96–103. - PMC - PubMed
    1. Elborn JS. Cystic fibrosis. Lancet. 2016;388(10059):2519–2531. doi: 10.1016/S0140-6736(16)00576-6. - DOI - PubMed

Publication types

Substances