

Targeting myeloid-derived suppressor cells to attenuate vasculogenic mimicry and synergistically enhance the anti-tumor effect of PD-1 inhibitor
- PMID: 34841231
- PMCID: PMC8605339
- DOI: 10.1016/j.isci.2021.103392
Targeting myeloid-derived suppressor cells to attenuate vasculogenic mimicry and synergistically enhance the anti-tumor effect of PD-1 inhibitor
Erratum in
-
Erratum: Targeting myeloid-derived suppressor cells to attenuate vasculogenic mimicry and synergistically enhance the anti-tumor effect of PD-1 inhibitor.iScience. 2022 Oct 9;25(10):105281. doi: 10.1016/j.isci.2022.105281. eCollection 2022 Oct 21. iScience. 2022. PMID: 36248742 Free PMC article.
Abstract
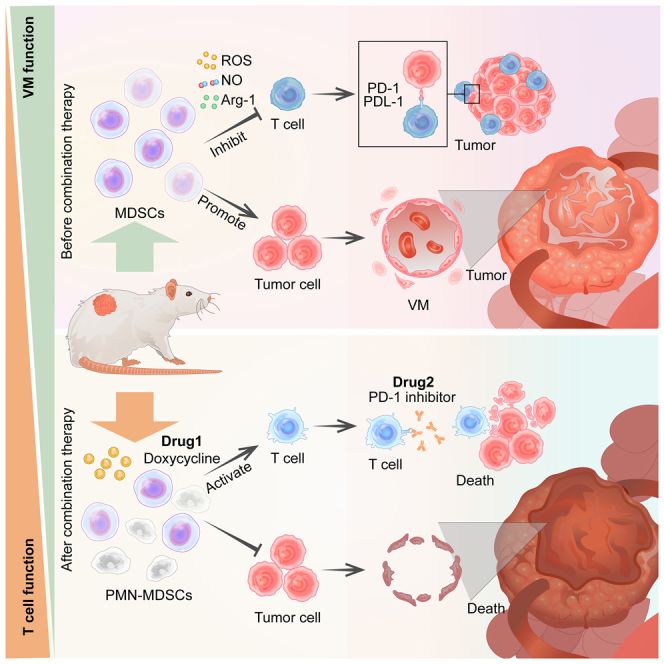
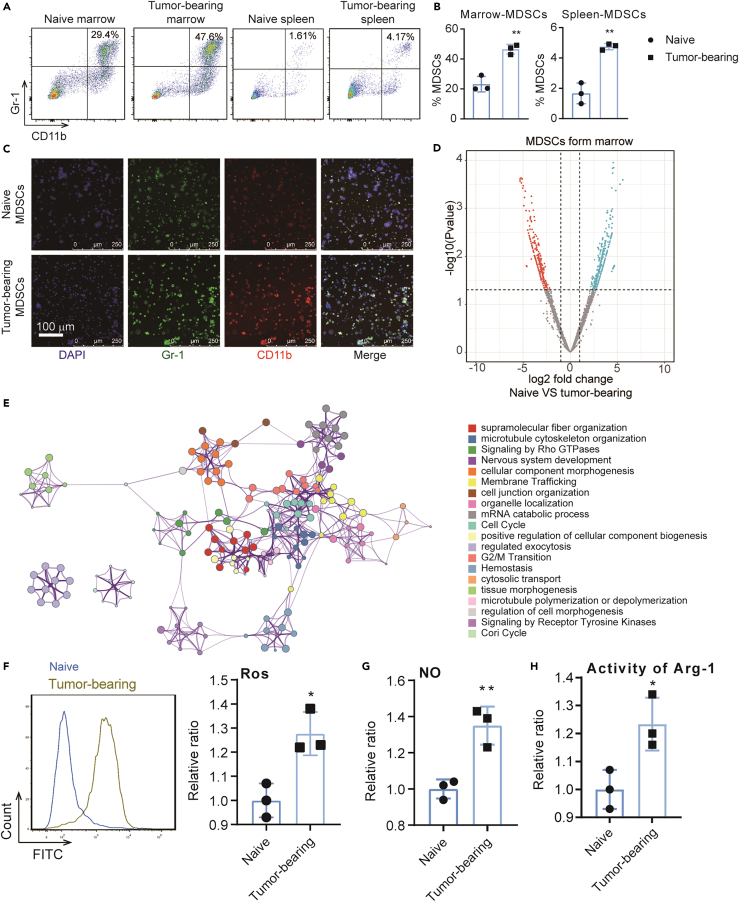
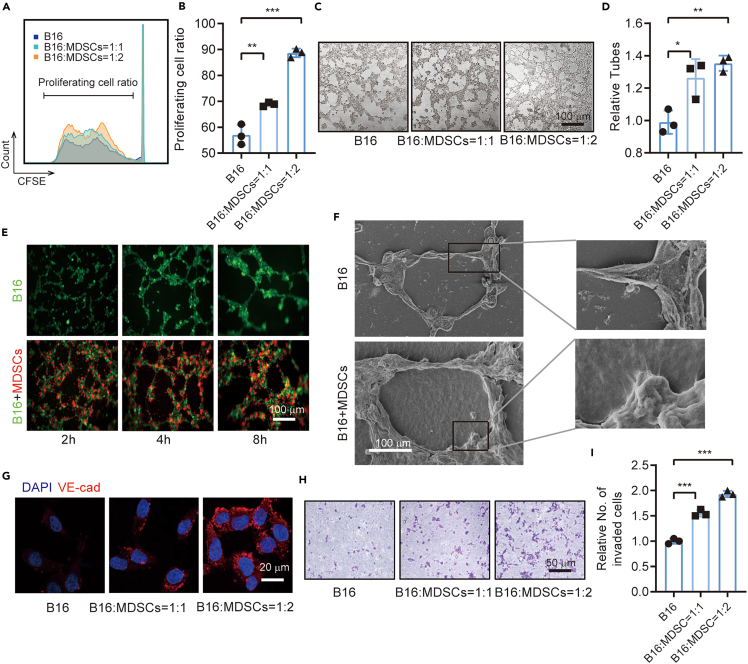
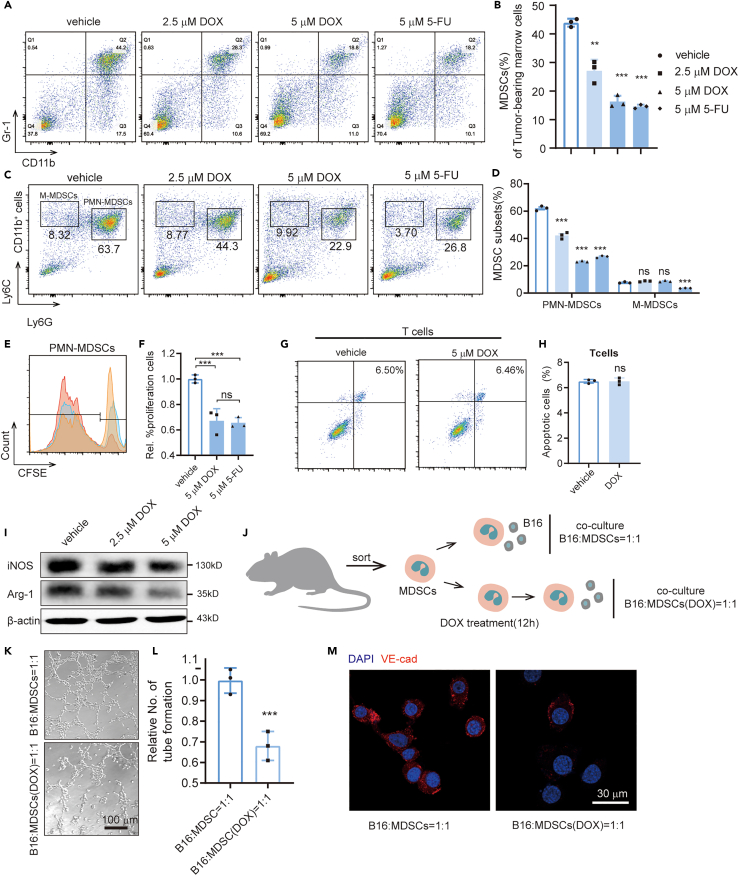
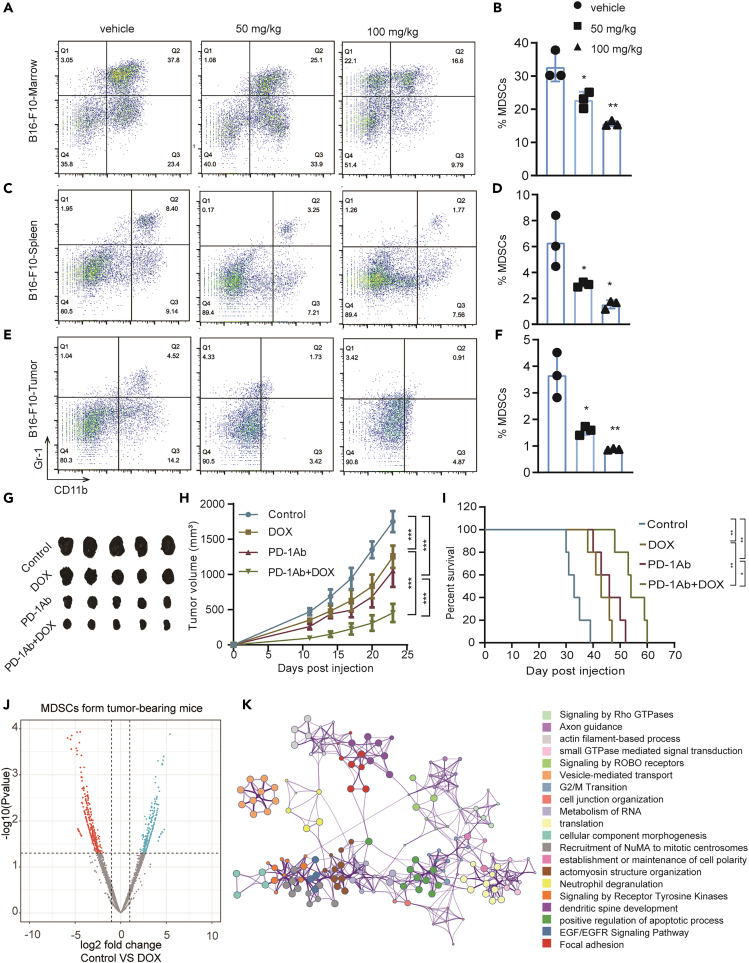
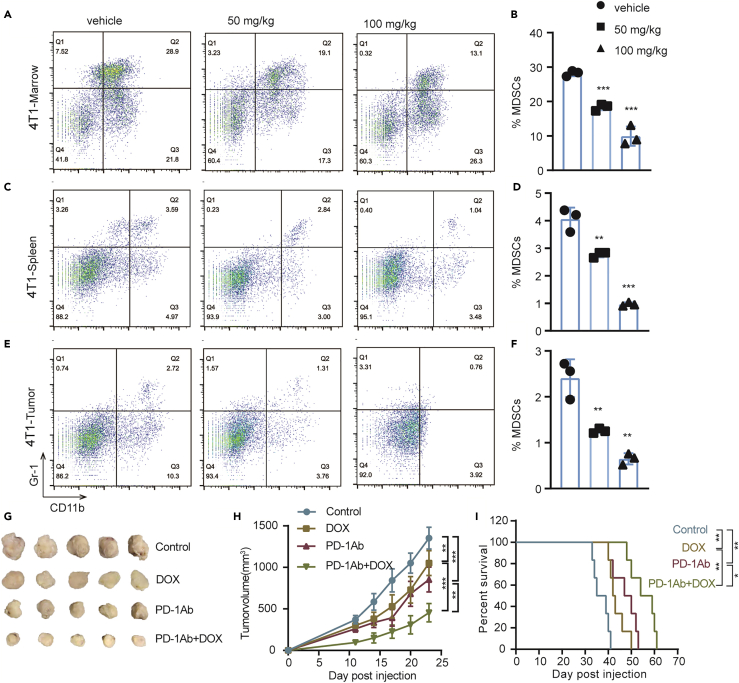
Myeloid-derived suppressor cells (MDSCs) enhance the proliferation of endothelial cells to stimulate angiogenesis. However, many aggressive malignant tumors do not have endothelial cell-dependent blood vessels in the early stage and instead generate microcirculation by forming vasculogenic mimicry (VM). To date, the relationship between MDSCs and tumor cells remains the focus of ongoing studies. In this work, MDSCs were co-cultured with mouse melanoma cells and can enhance proliferation and VM formation of melanoma cells. For MDSCs targeting, doxycycline (DOX) was found to selectively suppress PMN-MDSCs but has no influence on T cells. In addition, DOX pretreatment substantially reduced the promoting ability of MDSCs for the VM formation of B16-F10 cells. DOX also inhibited tumor growth and enhanced the antitumor activity of PD-1 inhibitors in C57BL6 and BALB/c mice subcutaneously inoculated with B16-F10 and 4T1 cells, respectively. In conclusion, the combination of DOX and PD-1 inhibitor could be an anticancer strategy.
Keywords: Cancer; Genetics.
© 2021 The Author(s).
Conflict of interest statement
The authors declare no competing interests.
Figures
Similar articles
-
Prim-O-glucosylcimifugin enhances the antitumour effect of PD-1 inhibition by targeting myeloid-derived suppressor cells.J Immunother Cancer. 2019 Aug 28;7(1):231. doi: 10.1186/s40425-019-0676-z. J Immunother Cancer. 2019. PMID: 31462297 Free PMC article.
-
Valproic acid attenuates CCR2-dependent tumor infiltration of monocytic myeloid-derived suppressor cells, limiting tumor progression.Oncoimmunology. 2020 Feb 29;9(1):1734268. doi: 10.1080/2162402X.2020.1734268. eCollection 2020. Oncoimmunology. 2020. PMID: 32158627 Free PMC article.
-
Targeting Inhibition of Accumulation and Function of Myeloid-Derived Suppressor Cells by Artemisinin via PI3K/AKT, mTOR, and MAPK Pathways Enhances Anti-PD-L1 Immunotherapy in Melanoma and Liver Tumors.J Immunol Res. 2022 Jun 22;2022:2253436. doi: 10.1155/2022/2253436. eCollection 2022. J Immunol Res. 2022. PMID: 35785030 Free PMC article.
-
Vasculogenic mimicry: current status and future prospects.Cancer Lett. 2007 Sep 8;254(2):157-64. doi: 10.1016/j.canlet.2006.12.036. Epub 2007 Feb 15. Cancer Lett. 2007. PMID: 17306454 Review.
-
Mechanisms of vasculogenic mimicry in hypoxic tumor microenvironments.Mol Cancer. 2021 Jan 4;20(1):7. doi: 10.1186/s12943-020-01288-1. Mol Cancer. 2021. PMID: 33397409 Free PMC article. Review.
Cited by
-
Navigating tumor angiogenesis: therapeutic perspectives and myeloid cell regulation mechanism.Angiogenesis. 2024 Aug;27(3):333-349. doi: 10.1007/s10456-024-09913-z. Epub 2024 Apr 6. Angiogenesis. 2024. PMID: 38580870 Free PMC article. Review.
-
Immune cellular components and signaling pathways in the tumor microenvironment.Semin Cancer Biol. 2022 Nov;86(Pt 2):187-201. doi: 10.1016/j.semcancer.2022.08.004. Epub 2022 Aug 18. Semin Cancer Biol. 2022. PMID: 35985559 Free PMC article. Review.
-
Efficacy and Mechanism of a Biomimetic Nanosystem Carrying Doxorubicin and an IDO Inhibitor for Treatment of Advanced Triple-Negative Breast Cancer.Int J Nanomedicine. 2024 Jan 17;19:507-526. doi: 10.2147/IJN.S440332. eCollection 2024. Int J Nanomedicine. 2024. PMID: 38260240 Free PMC article.
-
Intralesional administration of VAX014 facilitates in situ immunization and potentiates immune checkpoint blockade in immunologically cold tumors.J Immunother Cancer. 2023 Jun;11(6):e006749. doi: 10.1136/jitc-2023-006749. J Immunother Cancer. 2023. PMID: 37290924 Free PMC article.
-
The Notch signaling-regulated angiogenesis in rheumatoid arthritis: pathogenic mechanisms and therapeutic potentials.Front Immunol. 2023 Oct 26;14:1272133. doi: 10.3389/fimmu.2023.1272133. eCollection 2023. Front Immunol. 2023. PMID: 38022508 Free PMC article. Review.
References
-
- Bayik D., Zhou Y., Park C., Hong C., Vail D., Silver D.J., Lauko A., Roversi G., Watson D.C., Lo A., et al. Myeloid-derived suppressor cell subsets drive glioblastoma growth in a sex-specific manner. Cancer Discov. 2020;10:1210–1225. doi: 10.1158/2159-8290.Cd-19-1355. - DOI - PMC - PubMed
LinkOut - more resources
Full Text Sources
Molecular Biology Databases
Miscellaneous
