. 2021 Nov 16;13(11):2289.
doi: 10.3390/v13112289.

Mutagenesis of the Varicella-Zoster Virus Genome Demonstrates That VLT and VLT-ORF63 Proteins Are Dispensable for Lytic Infection

Affiliations

Mutagenesis of the Varicella-Zoster Virus Genome Demonstrates That VLT and VLT-ORF63 Proteins Are Dispensable for Lytic Infection

Shirley E Braspenning et al. Viruses. .

Abstract

Primary varicella-zoster virus (VZV) infection leads to varicella and the establishment of lifelong latency in sensory ganglion neurons. Reactivation of latent VZV causes herpes zoster, which is frequently associated with chronic pain. Latent viral gene expression is restricted to the VZV latency-associated transcript (VLT) and VLT-ORF63 (VLT63) fusion transcripts. Since VLT and VLT63 encode proteins that are expressed during lytic infection, we investigated whether pVLT and pVLT-ORF63 are essential for VZV replication by performing VZV genome mutagenesis using CRISPR/Cas9 and BAC technologies. We first established that CRISPR/Cas9 can efficiently mutate VZV genomes in lytically VZV-infected cells through targeting non-essential genes ORF8 and ORF11 and subsequently show recovery of viable mutant viruses. By contrast, the VLT region was markedly resistant to CRISPR/Cas9 editing. Whereas most mutants expressed wild-type or N-terminally altered versions of pVLT and pVLT-ORF63, only a minority of the resulting mutant viruses lacked pVLT and pVLT-ORF63 coding potential. Growth curve analysis showed that pVLT/pVLT-ORF63 negative viruses were viable, but impaired in growth in epithelial cells. We confirmed this phenotype independently using BAC-derived pVLT/pVLT-ORF63 negative and repaired viruses. Collectively, these data demonstrate that pVLT and/or pVLT-ORF63 are dispensable for lytic VZV replication but promote efficient VZV infection in epithelial cells.

Keywords: BAC mutagenesis; CRISPR/Cas9; VLT; VLT-ORF63; varicella-zoster virus.


Conflict of interest statement

The authors declare no conflict of interest.

Figures

Figure 1
Figure 1
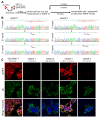
Editing of varicella-zoster virus (VZV) genomes using CRISPR/Cas9. (A) Experimental layout: ARPE-19 cells were transduced with a lentivirus encoding for both SpCas9 and a sgRNA, and selected for at least 3 weeks with appropriate antibiotics. Stably transduced cells were infected with cell-free VZV EMC-1 for two days, viral DNA was isolated and the target region was amplified by PCR and sequenced. (B,C) Top: Schematic illustration of the target region of ORF8 (B) and ORF11 (C): thick double black lines represent the VZV genome, currently annotated RNAs are depicted in grey—wide boxes are coding sequences (CDS), thin boxes are untranslated regions (UTRs) and dashed lines are intronic sequences—and DNA target sites of sgRNAs ORF8-1 and ORF8-2 (B) or sgRNAs ORF11-1 and ORF11-2 (C) are depicted. Bottom: Sanger sequencing traces showing the sgRNA target regions (red), PAM sequence (dashed black) and cleavage site with triangle for wild-type VZV EMC-1 DNA or from DNA extracted from VZV EMC-1 infected stably transduced ORF8-2 (B) and ORF11-1 cells (C). (D) Representative images of infected ARPE-19 cells with cell-free virus isolated from infected ORF8-2 cells stained by immunofluorescence for glycoprotein E (gray/green) and pORF8 (magenta/red). Nuclei were counterstained with Hoechst 33342 (blue), with 20× magnification (left) or 200× magnification (right). (E) Consensus Sanger sequences of 6 individual infectious foci after a single round of cell-free virus isolation and plaque purification following infection of stably transduced ORF8-2 (top) and ORF11-1 (bottom) cells. sgRNA target regions (red line), PAM sequence (dashed black line) and cleavage site with triangle are depicted.
Figure 2
Figure 2
Plaque purification of VZV edited by gRNA ORF8-2. (A) Experimental design: Stably transduced ARPE-19 cells expressing sgRNA ORF8-2 were infected with VZV EMC-1. Two days post-infection, cell-free virus was harvested, and subjected to three subsequent rounds of plaque purification. (B) Sanger sequencing after each round of plaque purification for variant 1 and 3 showing the sgRNA target regions (red), PAM sequence (dashed black), cleavage site with triangle and identified mutation. (C) Representative images of ARPE-19 cells infected with VZV EMC-1 or 4 ORF8 variant viruses derived from sgRNA ORF8-2 cells by plaque purifications stained by immunofluorescence for glycoprotein E (green) and pORF8 (red). Nuclei were counterstained with Hoechst 33342 (blue), with 10× magnification.
Figure 3
Figure 3
Generation of VZV latency-associated transcript (VLT) mutant viruses using combinations of two different sgRNAs. (A) Schematic illustration of the VLT target region: thick double black lines represent the VZV genome, annotated RNAs are depicted in grey—wide boxes are coding sequences (CDS), thin boxes are untranslated regions (UTRs) and dashed lines are intronic sequences—and the DNA target sites of sgRNAs VLT-1 to VLT-6 are depicted in differentially colored lines. (B) Sanger sequencing traces showing the sgRNA target region (yellow), PAM sequence (dashed black) and cleavage site (colored triangle) for wild-type VZV EMC-1 DNA (top) and DNA extracted from VZV EMC-1 infected stably transduced VLT-4 cells (bottom). (C) PCR products from VLT upstream exon C to VLT exon 2 on DNA isolated from parental ARPE-19 cells or from cells stably transduced with a combination of sgRNAs as indicated 2 days post-infection with VZV EMC-1. Correct band is indicated by an asterisk, additional bands result from duplication of primer binding site in R5. (D) Experimental design: Stably transduced ARPE-19 cells expressing two sgRNAs targeting the VLT region were infected with VZV EMC-1. Two days post-infection, cell-free virus was harvested, and subjected to three subsequent rounds of plaque purification. (E) VZV DNA sequence around sgRNA target sites of isolated plaque purified viruses divided into 4 groups: A—combination of sgRNA VLT-1 and sgRNA VLT-3, B—combination of sgRNA VLT-1 and sgRNA VLT-4, C—combination of sgRNA VLT-2 and VLT-3, D—combination of sgRNA VLT-2 and VLT-4. Dashed lines represent deleted nucleotides, whereas ‘xxx’ signifies the region in between the sgRNAs target sequences deleted in all mutants. PAM sequences (dashed black) and expected cleavage sites (colored triangles) are indicated. (F) Schematic illustration of VLT transcript generation from wild-type or mutant viruses from any upstream VLT exon (blue line), into exon 1 (purple line), exon 2 (orange line) and the remainder of VLT (black arrow). (G) Alignment of proteins generated in mutant viruses by in-frame splicing of an upstream ATG with the remainder of pVLT/pVLT-ORF63. Amino acids are colored to aid visual comparison.
Figure 4
Figure 4
Characterization of VZV VLT mutant viruses generated using combinations of two sgRNAs. (A) Relative expression level of VLT RNAs, RNA 60, RNA 61 and RNA 63 in ARPE-19 cells asynchronously infected with either wild-type VZV EMC-1 or mutants A4, B9, C14, C16, D21 and D23. Expression levels were normalized to VZV RNA 29 to compensate for differences in infection. (B) Representative growth curves of wild-type virus, one mutant per group and two pVLT/pVLT-ORF63(-) viruses by flow cytometry of VZV infected cells (n = 2 independent experiments, n = 3 technical replicates). Percentages shown are VZV glycoprotein E (gE)—positive cells at 24, 48 and 72 hpi. None of the mutant viruses significantly differed from wild-type (one-way ANOVA). (C) Comparison between two pVLT/pVLT-ORF63(+) viruses (C16 and D21) and their pVLT/pVLT-ORF63(-) counterparts (C14 and D23) at 72 hpi. ns: not significant and * p < 0.05 by unpaired Student’s t-test.
Figure 5
Figure 5
Generation of VZV pVLT/pVLT-ORF63 mutant viruses using a single sgRNA. (A) Schematic illustration showing the sgRNA target sites in the VLT region: thick double black lines represent the genome, annotated RNAs are depicted in grey—wide boxes are coding sequences (CDS), thin boxes are untranslated regions (UTRs) and dashed lines are intronic sequences—and the DNA target sites of sgRNAs VLT-7 to VLT-12 are depicted in differentially colored lines. Upper three transcripts represent most abundant alternative upstream exons used during lytic infection—named A-B-C and described in [9]. (B) Sanger sequence traces showing the sgRNA VLT-7/VLT-9 target region with PAM sequence (dashed black) and cleavage site (colored triangle) for wild-type VZV EMC-1 DNA (top) or DNA extracted from VZV EMC-1 infected stably transduced VLT-7 cells (middle) and VLT-9 cells (bottom). (C) Experimental layout: Stably transduced ARPE-19 cells expressing sgRNA VLT-9 were infected with VZV EMC-1. Two days post-infection, cell-free virus was harvested, and subjected to plaque purification on either ARPE-19 or ARPE-19 pVLT cells. Recovered viruses when then purified by three subsequent rounds of plaque purification. (DG) Illumina sequencing of viral DNA of four selected mutant virus isolates identified 75 SNPs compared to reference. (D) Distribution of SNPs conserved between all four isolates (n = 47), SNPs present in multiple isolates (n = 15) and isolate-specific SNPs (n = 13). (E) Type of SNPs identified in all isolates, substitutions (n = 56), insertions (n = 11) or deletions (n = 8). (F) Location of SNPs and number of SNPs outside the VLT coding sequence for each mutant viral isolate. (G) Proportion of reads of isolate-specific mutations for each mutant viral isolates, with VLT mutations highlighted in bold and colored: pVLTΔ1aa—brown, pVLTshift—blue and pVLTstop—red. (H) Relative expression level of VLT RNAs, RNA 60, RNA 61 and RNA 63 in ARPE-19 cells asynchronously infected with either pVLTwt, pVLTΔ1aa, pVLTshift or pVLTstop. Expression levels were normalized to VZV RNA 29 to compensate for differences in infection. (I) Percentage VZV glycoprotein E (gE)–positive cells by flow cytometry for pVLTwt, pVLTΔ1aa, pVLTshift or pVLTstop at 72 hpi. Representative data for n = 2 independent experiments, n = 3 technical replicates. *** p < 0.001 by unpaired Student’s t-test. (J) Cell-associated VZV titers of monolayers infected with wt (black dot) or stop (red dot) virus at 72 hpi as measured by TCID50 per cm2. *** p < 0.001 by unpaired Student’s t-test.
Figure 6
Figure 6
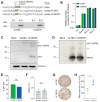
Generation of VZV pVLT/pVLT-ORF63 mutant viruses using BAC mutagenesis. (A) Top: Nucleotide sequence of VZV pOka, rpOka-VLTM1I and rpOka-VLTM1IR of the pVLT/pVLT-ORF63 ATG start codon in black, mutations in orange and its flanking regions and bottom: RT-PCR on RNA isolated from ARPE-19 cells infected with VZV VLTM1I or VLTM1IR using primers located in VLT exon 1 and exon 5. RT-/RT+: reverse transcriptase omitted or added in cDNA synthesis. (B) Relative expression level of VLT RNAs, RNA 60, RNA 61 and RNA 63 in ARPE-19 cells asynchronously infected with VLTM1I or VLTM1IR. Expression levels were normalized to VZV RNA29 to compensate for differences in infection. (C,D) Western blots on lysates of mock-, VZV VLTM1I- or VZV VLTM1IR-infected ARPE-19 cells stained with anti-pVLT, anti-alpha-tubulin (C) and anti-pORF63 (D) antibodies. Bands for pVLT and pVLT-ORF63 are indicated, * signifies an nonspecific band detected in all virus-infected cells, ++ indicates pORF63-N+ [10]. (E) Percentage VZV glycoprotein E (gE)–positive cells by flow cytometry of VZV VLTM1I and VLTM1IR in ARPE-19 cells at 72 hpi. Representative data for n = 2 independent experiments, n = 3 technical replicates. ns, not significant by unpaired Student’s t-test. (F) Cell-associated VZV titers of monolayers infected with VLTM1I or VLTM1IR virus at 72 hpi as measured by TCID50 per cm2, ns: not significant by unpaired Student’s t-test. (G,H) Infectious focus assay of VZV VLTM1I and VLTM1IR-infected ARPE-19 cells at 6 days post-infection (n = 2 independent experiments, 4 replicates each). (G) Representative images of infected wells stained for VZV gE by immunohistochemistry and (H) Mean spot size (×103 mm2) of VLTM1I (green) and VLTM1IR (blue) viruses per well, ** p < 0.01 by unpaired Student’s t-test.

Similar articles

Cited by

References

    1. Gershon A.A., Breuer J., Cohen J.I., Cohrs R.J., Gershon M.D., Gilden D., Grose C., Hambleton S., Kennedy P.G.E., Oxman M.N., et al. Varicella zoster virus infection. Nat. Rev. Dis. Primers. 2015;1:15016. doi: 10.1038/nrdp.2015.16. - DOI - PMC - PubMed
    1. Gilden D.H., Vafai A., Shtram Y., Becker Y., Devlin M., Wellish M. Varicella-zoster virus DNA in human sensory ganglia. Nature. 1983;306:478–480. doi: 10.1038/306478a0. - DOI - PubMed
    1. Depledge D., Sadaoka T., Ouwendijk W. Molecular Aspects of Varicella-Zoster Virus Latency. Viruses. 2018;10:349. doi: 10.3390/v10070349. - DOI - PMC - PubMed
    1. Gilden D.H., Kleinschmidt-DeMasters B.K., LaGuardia J.J., Mahalingam R., Cohrs R.J. Neurologic complications of the reactivation of varicella-zoster virus. N. Engl. J. Med. 2000;342:635–645. doi: 10.1056/NEJM200003023420906. - DOI - PubMed
    1. Johnson R.W., Rice A.S.C. Clinical practice. Postherpetic Neuralgia. N. Engl. J. Med. 2014;371:1526–1533. doi: 10.1056/NEJMcp1403062. - DOI - PubMed

Publication types

LinkOut - more resources