

Lasting Changes to Circulating Leukocytes in People with Mild SARS-CoV-2 Infections
- PMID: 34835045
- PMCID: PMC8622816
- DOI: 10.3390/v13112239
Lasting Changes to Circulating Leukocytes in People with Mild SARS-CoV-2 Infections
Abstract
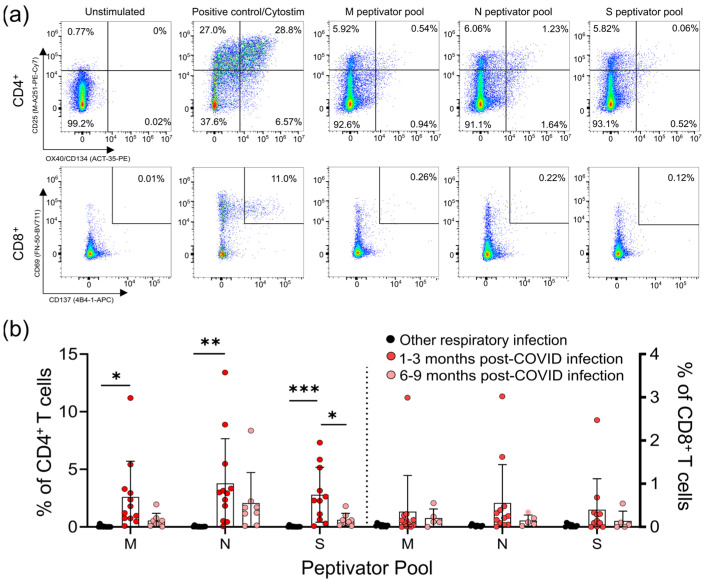
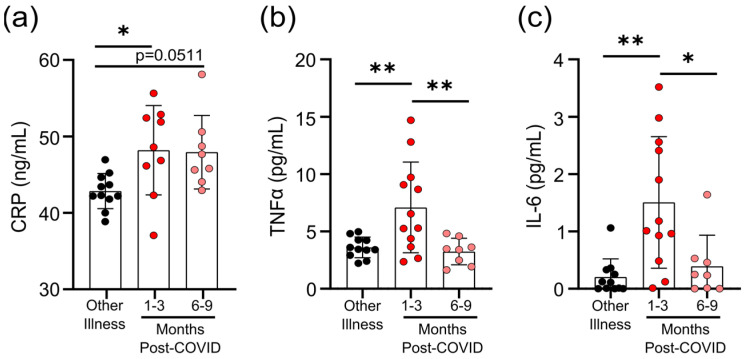
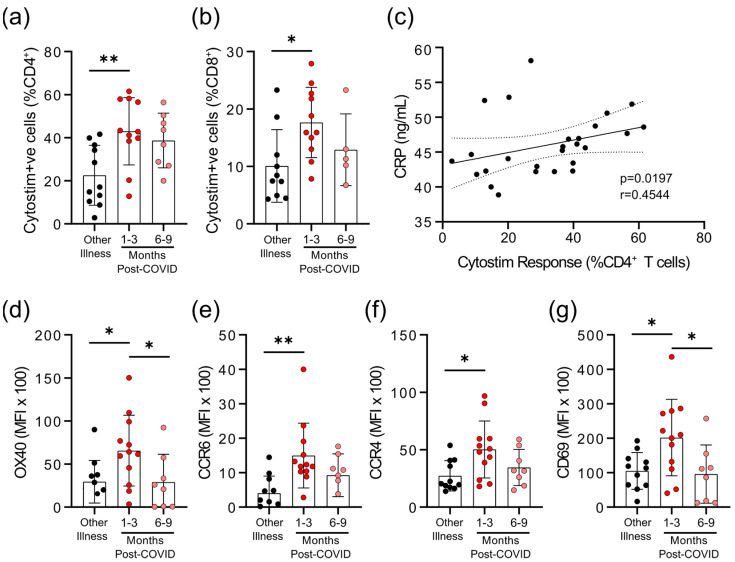
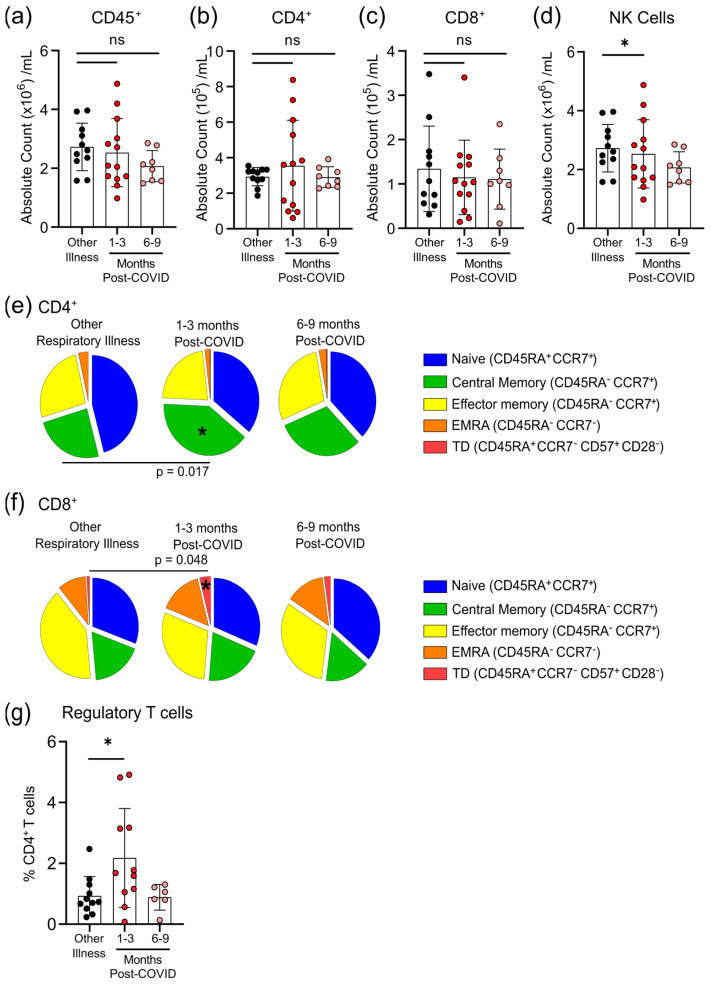
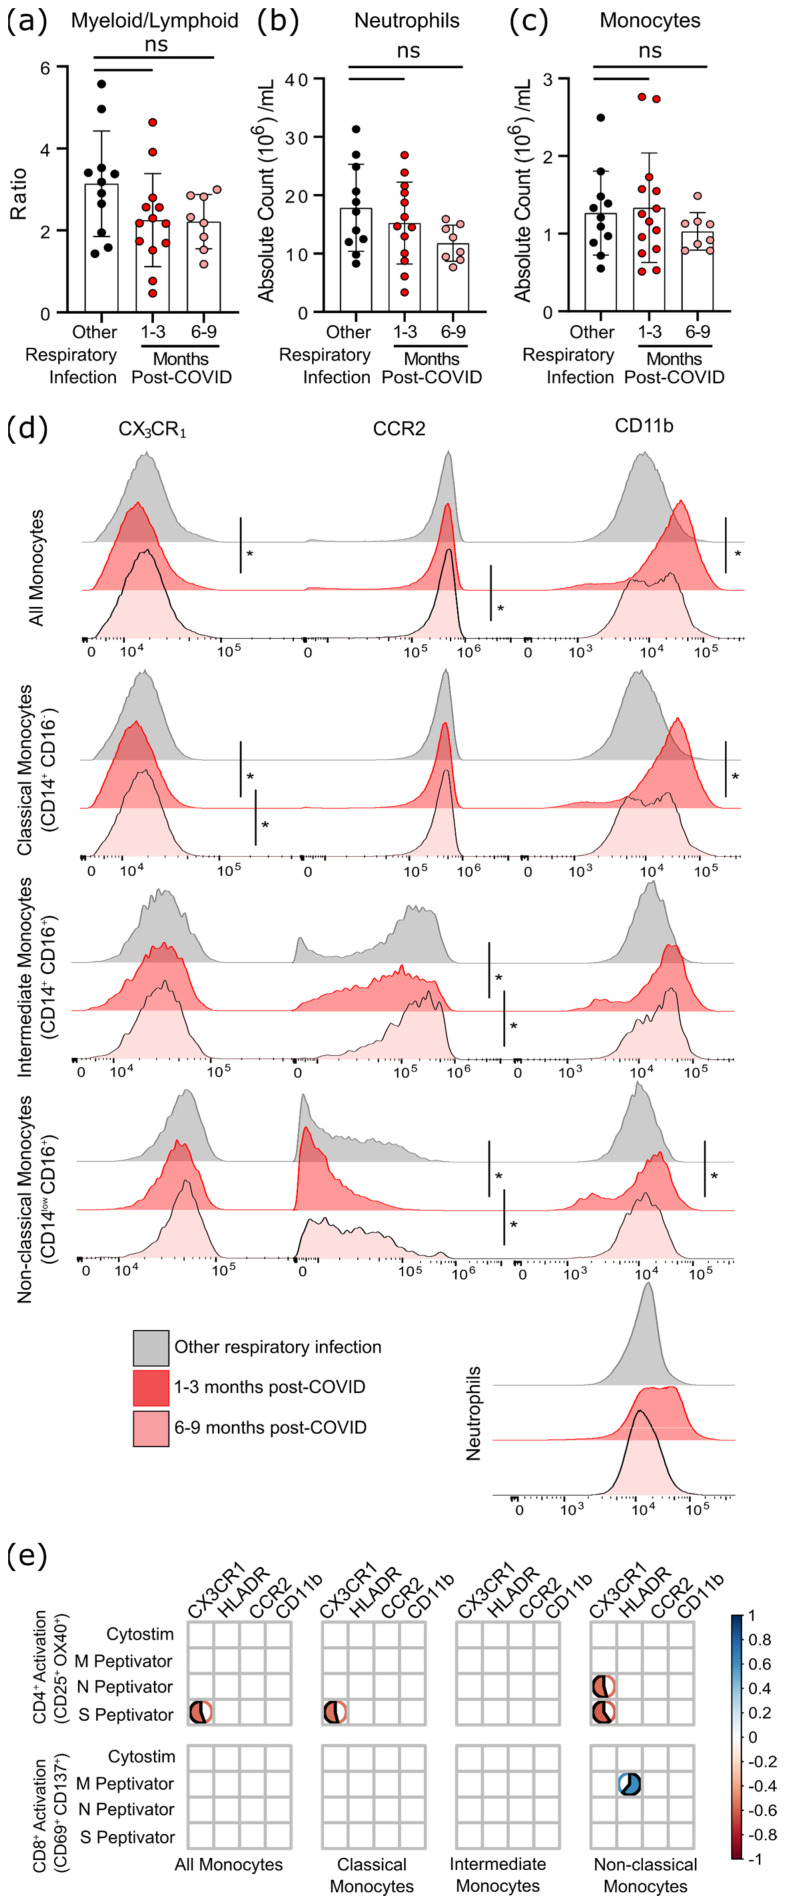
Survivors of severe SARS-CoV-2 infections frequently suffer from a range of post-infection sequelae. Whether survivors of mild or asymptomatic infections can expect any long-term health consequences is not yet known. Herein we investigated lasting changes to soluble inflammatory factors and cellular immune phenotype and function in individuals who had recovered from mild SARS-CoV-2 infections (n = 22), compared to those that had recovered from other mild respiratory infections (n = 11). Individuals who had experienced mild SARS-CoV-2 infections had elevated levels of C-reactive protein 1-3 months after symptom onset, and changes in phenotype and function of circulating T-cells that were not apparent in individuals 6-9 months post-symptom onset. Markers of monocyte activation, and expression of adherence and chemokine receptors indicative of altered migratory capacity, were also higher at 1-3 months post-infection in individuals who had mild SARS-CoV-2, but these were no longer elevated by 6-9 months post-infection. Perhaps most surprisingly, significantly more T-cells could be activated by polyclonal stimulation in individuals who had recently experienced a mild SARS-CoV-2, infection compared to individuals with other recent respiratory infections. These data are indicative of prolonged immune activation and systemic inflammation that persists for at least three months after mild or asymptomatic SARS-CoV-2 infections.
Keywords: COVID-19; SARS-CoV-2; immune activation; immunophenotype; inflammation.
Conflict of interest statement
The authors declare no conflict of interest. The funders had no role in the design of the study; in the collection, analyses, or interpretation of data; in the writing of the manuscript, or in the decision to publish the results.
Figures
Similar articles
-
mRNA vaccine-induced T cells respond identically to SARS-CoV-2 variants of concern but differ in longevity and homing properties depending on prior infection status.Elife. 2021 Oct 12;10:e72619. doi: 10.7554/eLife.72619. Elife. 2021. PMID: 34636722 Free PMC article.
-
Duration of post-COVID-19 symptoms is associated with sustained SARS-CoV-2-specific immune responses.JCI Insight. 2021 Aug 9;6(15):e151544. doi: 10.1172/jci.insight.151544. JCI Insight. 2021. PMID: 34143754 Free PMC article.
-
Longitudinal Analysis of Human Memory T-Cell Response According to the Severity of Illness up to 8 Months After Severe Acute Respiratory Syndrome Coronavirus 2 Infection.J Infect Dis. 2021 Jul 2;224(1):39-48. doi: 10.1093/infdis/jiab159. J Infect Dis. 2021. PMID: 33755725 Free PMC article.
-
Leukocyte trafficking to the lungs and beyond: lessons from influenza for COVID-19.Nat Rev Immunol. 2021 Jan;21(1):49-64. doi: 10.1038/s41577-020-00470-2. Epub 2020 Nov 19. Nat Rev Immunol. 2021. PMID: 33214719 Free PMC article. Review.
-
Cytidine deamination-induced perpetual immunity to SAR-CoV-2 infection is a potential new therapeutic target.Int J Med Sci. 2021 Oct 15;18(16):3788-3793. doi: 10.7150/ijms.61779. eCollection 2021. Int J Med Sci. 2021. PMID: 34790054 Free PMC article. Review.
Cited by
-
Cytomegalovirus Seropositivity in Older Adults Changes the T Cell Repertoire but Does Not Prevent Antibody or Cellular Responses to SARS-CoV-2 Vaccination.J Immunol. 2022 Nov 15;209(10):1892-1905. doi: 10.4049/jimmunol.2200369. J Immunol. 2022. PMID: 36426948 Free PMC article.
-
Monocyte-driven inflamm-aging reduces intestinal barrier function in females.Immun Ageing. 2024 Sep 30;21(1):65. doi: 10.1186/s12979-024-00469-6. Immun Ageing. 2024. PMID: 39350153 Free PMC article.
-
Herpes zoster infection in pregnancy: features and consequences.Arch Dermatol Res. 2024 Mar 15;316(4):107. doi: 10.1007/s00403-024-02842-3. Arch Dermatol Res. 2024. PMID: 38489022 Review.
-
Chronic TNF in the aging microenvironment exacerbates Tet2 loss-of-function myeloid expansion.Blood Adv. 2024 Aug 13;8(15):4169-4180. doi: 10.1182/bloodadvances.2023011833. Blood Adv. 2024. PMID: 38924753 Free PMC article.
-
From acute SARS-CoV-2 infection to pulmonary hypertension.Front Physiol. 2022 Dec 19;13:1023758. doi: 10.3389/fphys.2022.1023758. eCollection 2022. Front Physiol. 2022. PMID: 36601347 Free PMC article. Review.
References
-
- Zhang D., Guo R., Lei L., Liu H., Wang Y., Wang Y., Qian H., Dai T., Zhang T., Lai Y. COVID-19 infection induces readily detectable morphologic and inflammation-related phenotypic changes in peripheral blood monocytes. J. Leukoc. Biol. 2021;109:13–22. doi: 10.1002/JLB.4HI0720-470R. - DOI - PMC - PubMed
Publication types
MeSH terms
Substances
Grants and funding
LinkOut - more resources
Full Text Sources
Medical
Research Materials
Miscellaneous
