. 2021 Nov 17;10(11):3213.
doi: 10.3390/cells10113213.

Resveratrol Contrasts LPA-Induced Ovarian Cancer Cell Migration and Platinum Resistance by Rescuing Hedgehog-Mediated Autophagy

Affiliations

Resveratrol Contrasts LPA-Induced Ovarian Cancer Cell Migration and Platinum Resistance by Rescuing Hedgehog-Mediated Autophagy

Alessandra Ferraresi et al. Cells. .

Abstract

Background: Ovarian cancer progression and invasiveness are promoted by a range of soluble factors released by cancer cells and stromal cells within the tumor microenvironment. Our previous studies demonstrated that resveratrol (RV), a nutraceutical and caloric restriction mimetic with tumor-suppressive properties, counteracts cancer cell motility induced by stromal IL-6 by upregulating autophagy. Lysophosphatidic acid (LPA), a bioactive phospholipid that shows elevated levels in the tumor microenvironment and the ascites of ovarian cancers, stimulates the growth and tissue invasion of cancer cells. Whether LPA elicits these effects by inhibiting autophagy and through which pathway and whether RV can counteract the same remain obscure. Aims: To investigate the molecular pathways involved in LPA-induced ovarian cancer malignancy, particularly focusing on the role of autophagy, and the ability of RV to counteract LPA activity. Results: LPA stimulated while RV inhibited ovarian cancer cell migration. Transcriptomic and bioinformatic analyses showed an opposite regulation by LPA and RV of genes linked to epithelial-to-mesenchymal transition (EMT) and autophagy with involvement of the PI3K-AKT, JAK-STAT and Hedgehog (Hh) pathways. LPA upregulated the Hh and EMT members GLI1, BMI-1, SNAIL-1 and TWIST1 and inhibited autophagy, while RV did the opposite. Similar to the inhibitors of the Hh pathway, RV inhibited LPA-induced cancer cell migration and 3D growth of ovarian cancer cells. BMI-1 silencing prevented LPA-induced EMT, restored autophagy and hampered cell migration, resembling the effects of RV. TCGA data analyses indicated that patients with low expression of Hh/EMT-related genes together with active autophagy flux tended to have a better prognosis and this correlates with a more effective response to platinum therapy. In in vitro 3D spheroids, LPA upregulated BMI-1, downregulated autophagy and inhibited platinum toxicity while RV and Hh inhibitors restored autophagy and favored BAX-mediated cell death in response to platinum. Conclusions: By inhibiting the Hh pathway and restoration of autophagy, RV counteracts LPA-induced malignancy, supporting its inclusion in the therapy of ovarian cancer for limiting metastasis and chemoresistance.

Keywords: 3D spheroids; BMI-1; autophagy; cell migration; chemoresistance; epithelial to mesenchymal transition; overall survival; personalized cancer therapy; transcriptomic; tumor microenvironment.


Conflict of interest statement

The authors declare no conflict of interest.

Figures
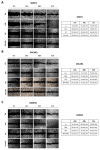
Figure 1
Figure 1
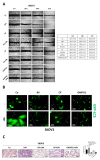
Resveratrol counteracts LPA-induced cell migration in three different ovarian cancer cell models. SKOV3 (A), OVCAR3 (B) and OAW42 (C) human ovarian cancer cells were plated on Petri dishes and let grow to confluence. Cell monolayers were scratched to produce a straight line. Cells were exposed to 100 µM resveratrol (RV) or to 20 µM LPA or both simultaneously. Medium was replaced and substances re-added every 24 h. Phase-contrast photos of the open gap were taken at time points 0, 24, 48 and 72 h. Table reports the rate of healing (%) for each time point estimated using ImageJ software. Data are presented as the average ± S.D. calculated for three different fields per each condition in three separate experiments.
Figure 2
Figure 2
Differential modulation of biological processes by resveratrol and LPA in SKOV3 ovarian cancer cells. (A) Volcano plot displaying the differential expressed genes (DEGs) in LPA-treated cells. Red dots represent DEGs with log2 (fold change) value > 1.0, while green dots represent the DEGs with log2 (fold change) value < −1.0. (B) Volcano plot displaying the differential expressed genes (DEGs) in resveratrol (RV)-treated cells. Red dots represent DEGs with log2 (fold change) value > 1.0, while green dots represent the DEGs with log2 (fold change) value < −1.0. (C) Graph reporting LPA upregulated biological processes. (D) Graph reporting LPA downregulated biological processes. (E) Graph reporting RV upregulated biological processes. (F) Graph reporting RV downregulated biological processes.
Figure 3
Figure 3
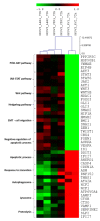
Resveratrol downregulates the transcriptome associated with the Hedgehog/EMT pathway while upregulating autophagy-related genes. Heat map of the expression profiles of the top differentially modulated genes belonging to selected pathways regulating cancer cell locomotion and chemoresistance. Transcriptome of SKOV3 cells upon LPA treatment (first and second column) or RV treatment (fifth and sixth column) is compared to the expression signature of untreated cells (third and fourth column). Green and red colors represent downregulation and upregulation, respectively.
Figure 4
Figure 4
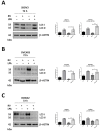
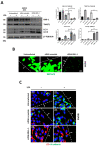
Resveratrol restores autophagy flux inhibition by LPA. SKOV3 (A), OVCAR3 (B) and OAW42 (C) human ovarian cancer cells were plated on Petri dishes and let grow to confluence. Cells were exposed for 72 h to 100 µM resveratrol (RV) or 20 µM LPA or both simultaneously. Cell homogenates were analyzed by Western blotting for the expression of LC3. Autophagy flux was monitored by conversion rate of the precursor LC3-I to the lipidated mature form LC3-II, whereas the autophagosome accumulation was monitored by LC3-II/β-actin ratio. All blots are representative of three independent experiments. Densitometric data ± S.D. representing three replicates are reported in the graphs. Statistical analysis was performed by using GraphPad Prism 5.0 software. Bonferroni’s multiple comparison test after one-way ANOVA analysis (unpaired, two-tailed) was employed. Significance was considered as follow: **** p < 0.0001; *** p < 0.001; * p < 0.05.
Figure 5
Figure 5
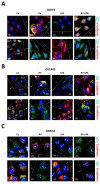
Resveratrol reverts LPA-mediated EMT in parallel with autophagy induction. SKOV3 (A), OVCAR3 (B) and OAW42 (C) human ovarian cancer cells were plated on coverslips, let grow and scratched using a pipette tip. Cells were exposed for 72 h to 100 µM resveratrol (RV) or 20 µM LPA or both simultaneously. Coverslips were fixed and two different staining were performed: LC3 (red) and E-cadherin (green) and LC3 (red) and N-cadherin (green). All experiments were reproduced three times. Images were taken in the proximity of the migration front. Scale bar = 20 µm; magnification = 63×.
Figure 6
Figure 6
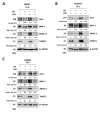
Resveratrol attenuates the upregulation of Hedgehog/EMT signaling induced by LPA. SKOV3 (A), OVCAR3 (B) and OAW42 (C) human ovarian cancer cells were plated on Petri dishes and let grow to confluence. Cells were exposed for 72 h to 100 µM resveratrol (RV) or 20 µM LPA or both simultaneously. Cell homogenates were analyzed by Western blotting for the expression of GLI1, BMI-1, SNAIL-1 and TWIST1. The membranes were stripped and re-probed with different antibodies. The β-actin for OVCAR3 and OAW42 correspond to the ones reported in Figure 4. Densitometric data (normalized on the loading control β-actin) are reported. All blots are representative of three independent experiments.
Figure 7
Figure 7
Resveratrol hampers LPA-induced Hedgehog-mediated cell motility while upregulating autophagy in the cells at the migration front. (A) A wound was made in SKOV3 cultured to confluency in Petri dishes. The cells were then exposed to 100 µM resveratrol (RV), 5 µM cyclopamine (CP) or 10 µM GANT61 in the presence/absence of 20 µM LPA. Medium was replaced and substances re-added every 24 h. Phase-contrast photos of the open gap were taken at time points 0, 24, 48 and 72 h. Graph reporting the rate of healing (%) for each time point estimated using ImageJ software. Data represent the average ± S.D. calculated for three different fields per each condition in three separate experiments. (B) SKOV3-GFP-LC3 cells were cultured to confluency on coverslips, then wounded and treated as in panel A. At the end of treatment, coverslips were washed, mounted and immediately imaged under the fluorescence microscope. Images were taken in the proximity of the migration front. Scale bar = 20 µm; magnification = 63×. (C) SKOV3 cells were cultured in Petri dishes and treated as described in panel A. After 48 h, cells were collected and counted. An equal number of cells for each experimental condition was seeded in the upper chambers of a Transwell migration insert. The upper chamber contained serum-free media supplemented as indicated, whereas the below chambers were filled with complete media (+10% FBS) to produce a chemotactic gradient. After 24 h of culture, Transwell inserts were washed, fixed in methanol and stained with eosin-hematoxylin. Phase-contrast photos of the migrated cells are shown. Scale bar = 100 µm; magnification = 20×. Graph reporting the number of cells that had migrated as estimated by ImageJ software. Data represent the average ± S.D. calculated for three random fields per each condition in three separate experiments. Statistical analysis was performed by using GraphPad Prism 5.0 software. Bonferroni’s multiple comparison test after one-way ANOVA analysis (unpaired, two-tailed) was employed. Significance was considered as follow: *** p < 0.001; ** p < 0.01; * p < 0.05.
Figure 8
Figure 8
BMI-1 knockdown results in downregulation of EMT in parallel with autophagy induction. (A) SKOV3 cells were plated on Petri dishes and let adhere. Once they reached the appropriated confluence, cells were transfected with siRNA BMI-1 or siRNA scrambled and after 36 h from transfection, coverslips were incubated or not with 20 µM LPA. Medium was replaced and LPA re-added after 24 h. Cell homogenates were analyzed by Western blotting for the expression of LC3, TWIST1 and BMI-1. All blots are representative of three independent experiments. Densitometric data ± S.D. representing three replicates are reported in the graphs. Statistical analysis was performed by using GraphPad Prism 5.0 software. Bonferroni’s multiple comparison test after one-way ANOVA analysis (unpaired, two-tailed) was employed. Significance was considered as follow: **** p < 0.0001; *** p < 0.001; ** p < 0.01. (B) SKOV3-GFP-LC3 cells were plated on coverslips and let grow. Thereafter, cells were transfected with siRNA BMI-1 or siRNA scrambled. The following day, coverslips were scratched with a yellow tip and cells were cultured for further 24 h. Coverslips were washed, mounted and immediately imaged under the fluorescence microscope. Imaging of GFP-LC3 fluorescence was performed in proximity of the migration front. Scale bar = 20 µm; magnification = 63×. (C) SKOV3 cells were plated on coverslips and let grow. Thereafter, cells were transfected with siRNA BMI-1 or siRNA scrambled. The following day, coverslips were scratched with a yellow tip and cells were incubated or not with 20 µM LPA for 24 h. Coverslips were fixed and stained for LC3 (red)—N-cadherin (green). Images were taken in the proximity of the migration front. Scale bar = 20 µm; magnification = 63×.
Figure 9
Figure 9
Patients with low expression of Hedgehog/EMT markers together with MAP1LC3B upregulation had a better overall survival and were more responsive to platinum therapy. We compared the in vitro responsiveness of cancer cells to oxaliplatin with the clinical outcomes of the ovarian cancer patients by interrogating the TCGA bioportal (ovarian serous cystadenocarcinoma dataset, TCGA Nature 2011). Those patients for whom therapy response status was not available are classified in N/A group. (A) Box plot showing the distribution of MAP1LC3B mRNA expression according to GLI1 mRNA levels (high vs. low group). (B) Kaplan–Meier plot representing the overall survival status of patients stratified on the basis of the differential expression of GLI1 and MAP1LC3B (high GLI1/low MAP1LC3B vs. low GLI1/high MAP1LC3B). (C) Graph showing the response to platinum therapy based on the differential mRNA expression of GLI1 and MAP1LC3B. The histograms report the number of patients that were resistant, sensitive or developed chemoresistance as soon as the chemotherapy started (too-early group). (D) Box plot showing the distribution of MAP1LC3B mRNA expression according to BMI1 mRNA levels (high vs. low group). (E) Kaplan–Meier plot representing the overall survival status of patients stratified in high BMI1/low MAP1LC3B vs. low BMI1/high MAP1LC3B. (F) Graph showing the response to platinum therapy based on the differential mRNA expression of BMI1 and MAP1LC3B. (G) Box plot showing the distribution of MAP1LC3B mRNA expression according to SNAI1 mRNA levels (high vs. low group). (H) Kaplan–Meier plot representing the overall survival status of patients stratified in high SNAI1/low MAP1LC3B vs. low SNAI1/high MAP1LC3B. (I) Graph showing the response to platinum therapy based on the differential mRNA expression of SNAI1 and MAP1LC3B. (J) Box plot showing the distribution of MAP1LC3B mRNA expression according to TWIST1 mRNA levels (high vs. low group). (K) Kaplan–Meier plot representing the overall survival status of patients stratified in high TWIST1/low MAP1LC3B vs. low TWIST1/high MAP1LC3B. (L) Graph showing the response to platinum therapy based on the differential mRNA expression of TWIST1 and MAP1LC3B.
Figure 10
Figure 10
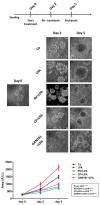
Resveratrol counteracts LPA-induced 3D ovarian cancer spheroids’ growth. SKOV3 cells were seeded on Poly-HEMA-coated Petri dishes and let grow until formation of 3D spheroids. At day 0, cells were exposed to 100 µM resveratrol (RV), 5 µM cyclopamine (CP) or 10 µM GANT61 in the presence/absence of 20 µM LPA. The experimental timeline is reported in the graphical scheme. The 3D spheroids were cultured for 5 days. Representative phase-contrast images of time-course experiment to monitor 3D spheroids’ growth. Magnification = 20×. The growth curve represents the area of 3D spheroids estimated at each time point. Statistical analysis was performed by using GraphPad Prism 5.0 software. Bonferroni’s multiple comparison test after one-way ANOVA analysis was employed. Significance was considered as follow: **** p< 0.0001; *** p < 0.001.
Figure 11
Figure 11
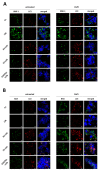
Resveratrol sensitizes LPA-treated 3D spheroids to chemotherapy. SKOV3 cells were seeded on Poly-HEMA-coated Petri dishes and let grow until formation of 3D spheroids. At day 0, cells were exposed to 100 µM resveratrol (RV), 5 µM cyclopamine (CP) or 10 µM GANT61 in the presence/absence of 20 µM LPA. 50 μM oxaliplatin (OxPt) was added at day 2. The 3D spheroids were cultured for 5 days, monitored with the phase-contrast microscope and photographed. Scale bar = 20 µm; magnification = 63×. (A,B) 3D spheroids collected at day 5 were cytospotted on glass slides. The slides were processed for immunofluorescence of BMI-1 (green)—LC3 (red) (panel A) and of BAX (green)—LC3 (red) (panel B).

Similar articles

Cited by

References

    1. Cabasag C.J., Arnold M., Butler J., Inoue M., Trabert B., Webb P.M., Bray F., Soerjomataram I. The influence of birth cohort and calendar period on global trends in ovarian cancer incidence. Int. J. Cancer. 2020;146:749–758. doi: 10.1002/ijc.32322. - DOI - PMC - PubMed
    1. Coleman R.L., Monk B.J., Sood A.K., Herzog T.J. Latest research and treatment of advanced-stage epithelial ovarian cancer. Nat. Rev. Clin. Oncol. 2013;10:211–224. doi: 10.1038/nrclinonc.2013.5. - DOI - PMC - PubMed
    1. Gupta S., Nag S., Aggarwal S., Rauthan A., Warrier N. Maintenance therapy for recurrent epithelial ovarian cancer: Current therapies and future perspectives—A review. J. Ovarian Res. 2019;12:103. doi: 10.1186/s13048-019-0579-0. - DOI - PMC - PubMed
    1. Thuwajit C., Ferraresi A., Titone R., Thuwajit P., Isidoro C. The metabolic cross-talk between epithelial cancer cells and stromal fibroblasts in ovarian cancer progression: Autophagy plays a role. Med. Res. Rev. 2018;38:1235–1254. doi: 10.1002/med.21473. - DOI - PMC - PubMed
    1. Ferraresi A., Girone C., Esposito A., Vidoni C., Vallino L., Secomandi E., Dhanasekaran D.N., Isidoro C. How Autophagy Shapes the Tumor Microenvironment in Ovarian Cancer. Front. Oncol. 2020;10:599915. doi: 10.3389/fonc.2020.599915. - DOI - PMC - PubMed

Publication types

MeSH terms