. 2021 Nov 16;10(11):3196.
doi: 10.3390/cells10113196.

Reactivities of a Prostanoid EP2 Agonist, Omidenepag, Are Useful for Distinguishing between 3D Spheroids of Human Orbital Fibroblasts without or with Graves' Orbitopathy

Affiliations

Reactivities of a Prostanoid EP2 Agonist, Omidenepag, Are Useful for Distinguishing between 3D Spheroids of Human Orbital Fibroblasts without or with Graves' Orbitopathy

Yosuke Ida et al. Cells. .

Abstract

Background: To obtain new insights into the activation of the thyroid-stimulating hormone (TSH) and insulin-like growth factor 1 (IGF-1) receptors in human orbital fibroblasts (n-HOFs), the effects of the prostanoid EP2 agonist, omidenepag (OMD), and a rho-associated coiled-coil-containing protein kinase (ROCK) inhibitor, ripasudil (Rip) were evaluated using three-dimension (3D) n-HOFs spheroids in the absence and presence of the recombinant human TSH receptor antibodies, M22 and IGF-1.

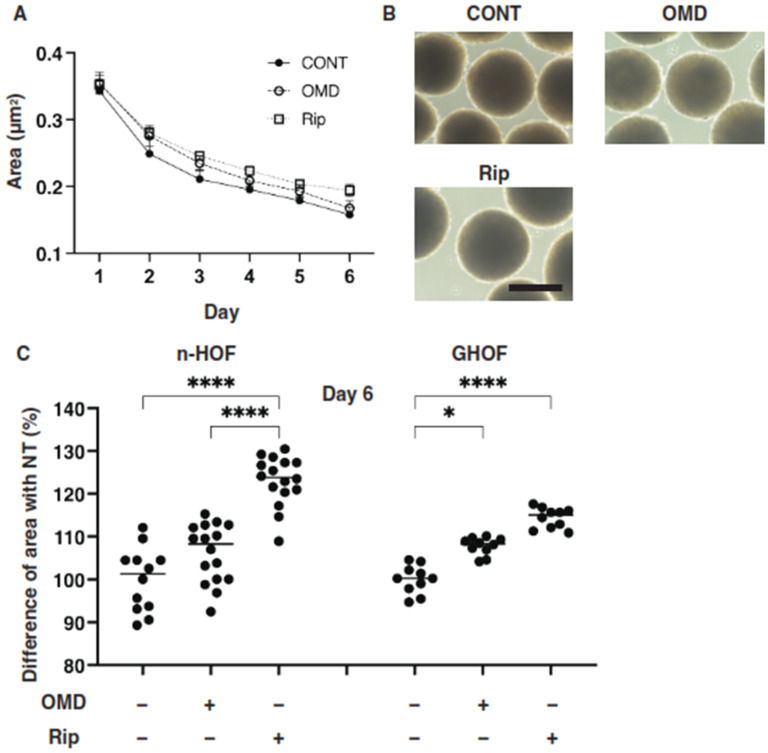
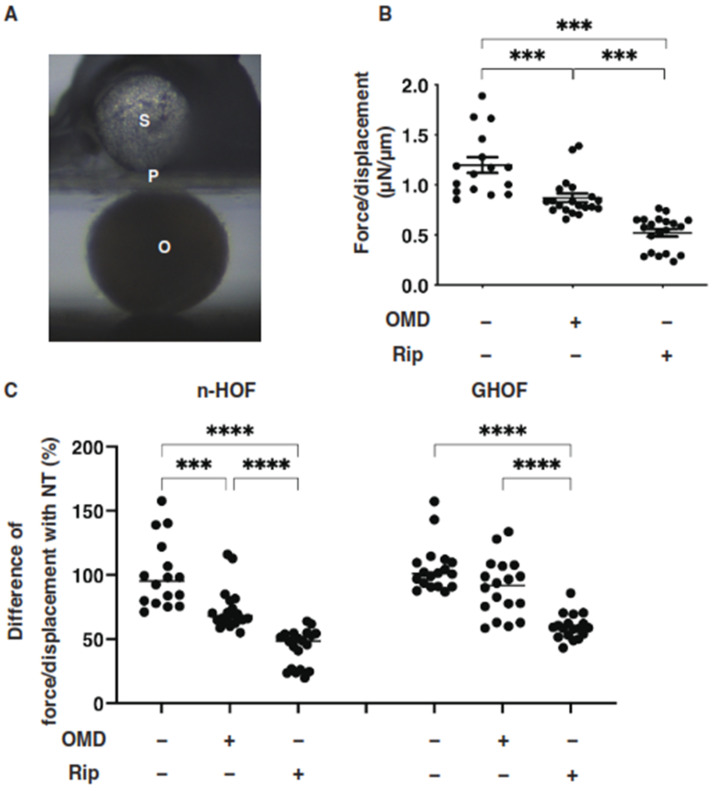
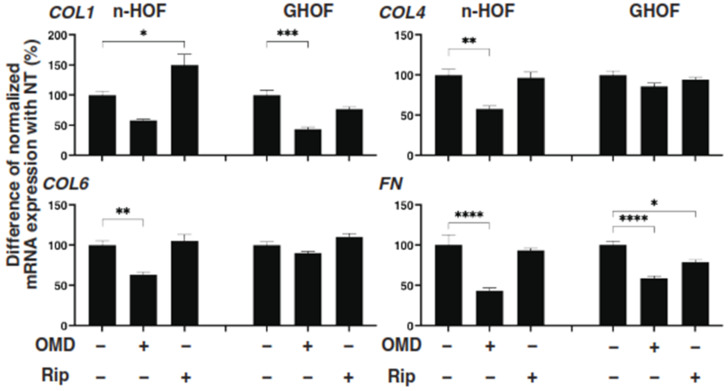
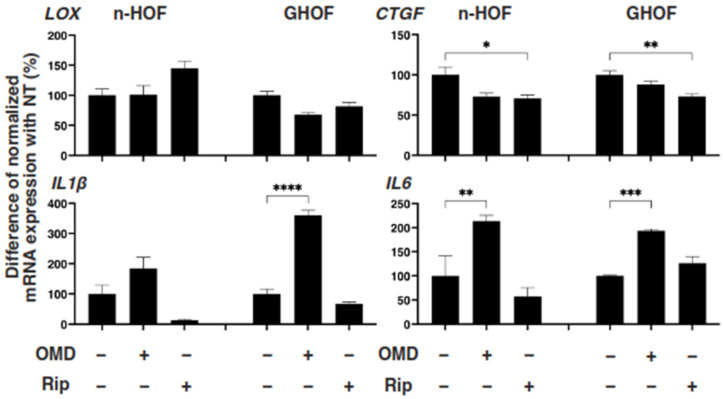
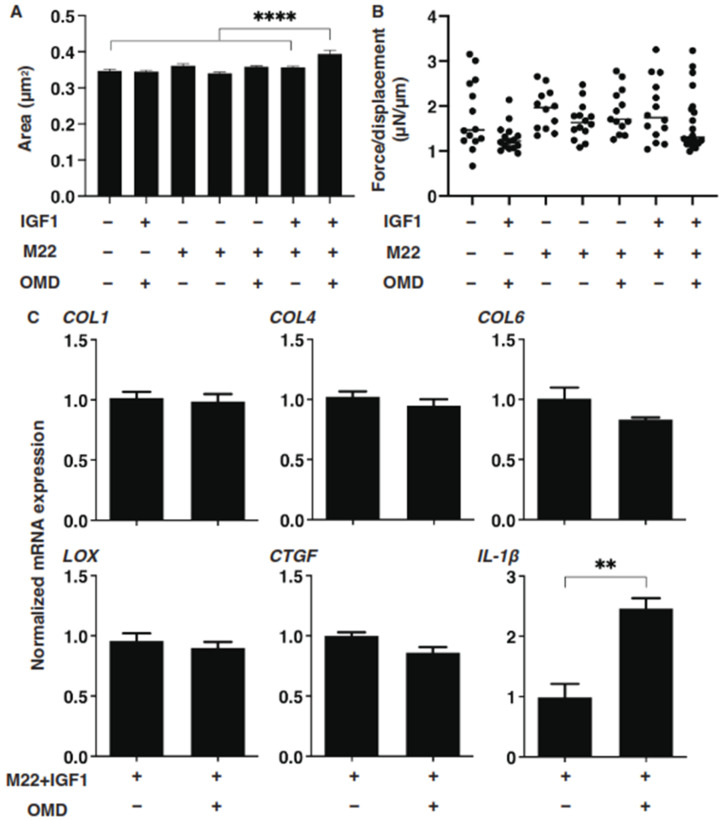
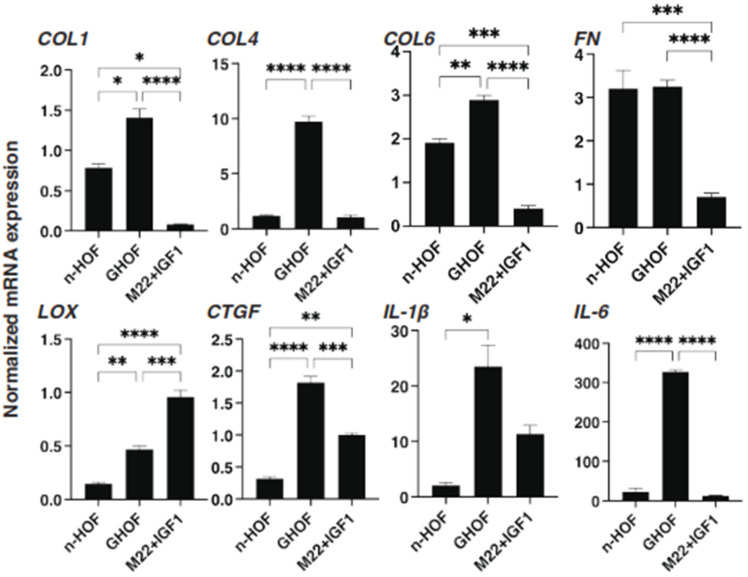
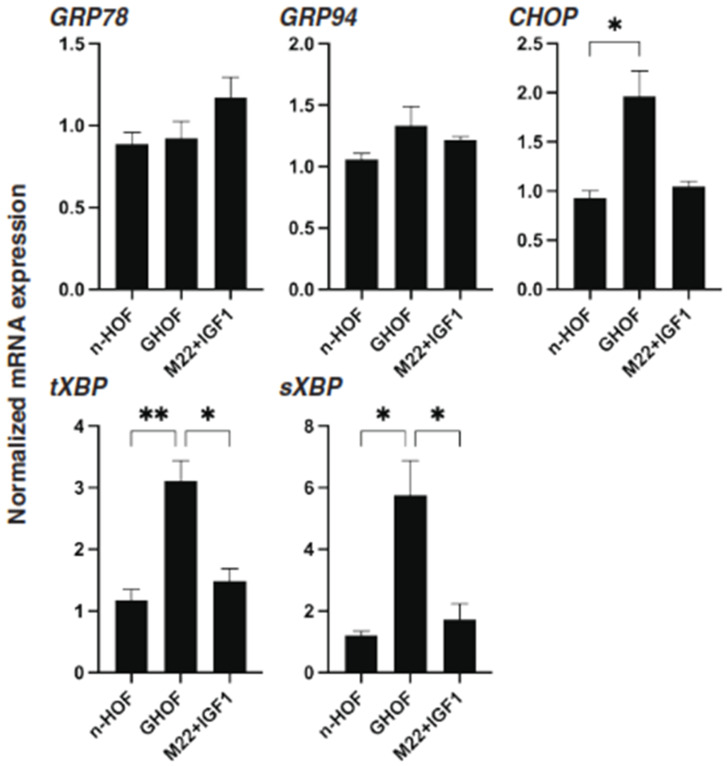
Methods: The effects of 100 nM OMD or 10 μM Rip on the physical properties, size, stiffness, and mRNA expression of several extracellular matrix (ECM) molecules, their regulator, inflammatory cytokines, and endoplasmic reticulum (ER) stress-related factors were examined and compared among 3D spheroids of n-HOFs, M22-/IGF-1-activated n-HOFs and GO-related human orbital fibroblasts (GHOFs).

Results: The physical properties and mRNA expressions of several genes of the 3D n-HOFs spheroids were significantly and diversely modulated by the presence of OMD or Rip. The OMD-induced effects on M22-/IGF-1-activated n-HOFs were similar to the effects caused by GHOHs, but quite different from those of n-HOFs.

Conclusions: The findings presented herein indicate that the changes induced by OMD may be useful in distinguishing between n-HOFs and GHOFs.

Keywords: Graves’ orbitopathy; IGF-1; ROCK inhibitor; orbital fibroblast; prostanoid EP2 agonist; three-dimension (3D) cell culture.


Conflict of interest statement

The authors declare no conflict of interest.

Figures

Figure 1
Figure 1
Effects of omidenepag (OMD) and ripasudil (Rip) on the mean sizes of n-HOFs or GHOF 3D spheroids. Panel (A) Changes in the mean area sizes (μm2) of the 3D spheroids derived from n-HOFs cells cultured without (CONT, closed circles) or with 100 nM omidenepag (OMD, closed squares) or 10 µM Ripasudil (Rip, closed triangles) were plotted during the 6-day culture period. Panel (B) Representative phase contrast images of the 3D n-HOFs spheroids under several conditions as above at Day 6 are shown (scale bar; 100 μm). Panel (C) Percentage difference in the size of the mean area of n-HOF or GHOF spheroids treated with omidenepag (OMD) or ripasudil (Rip) as above, as compared with their non-treated control (CONT), was plotted. In terms of the results for the GHOF spheroids, corresponding data reported in our previous study [11] were recalculated and replotted. All experiments were performed in triplicate using fresh preparations, each consisting of 16 spheroids. Data are presented as the arithmetic mean ± the standard error of the mean (SEM). * p < 0.05, **** p < 0.001 (ANOVA followed by a Tukey’s multiple comparison test).
Figure 2
Figure 2
Effects of omidenepag (OMD) or ripasudil (Rip) on the physical stiffness of n-HOFs or GHOF 3D spheroids. At Day 6, the n-HOFs 3D spheroids without or with 100 nM omidenepag (OMD) or 10 µM Ripasudil (Rip) were subjected to a physical solidity analysis by a micro-squeezer (panel (A): S—pressure sensor, P—plate, O—3D HOFs spheroid). The force required to induce deformation until half diameter was reached (μN/μm force/displacement) was measured and plotted (panel (B)). Percentage difference in the force/displacement values of n-HOF or GHOF spheroids treated with omidenepag (OMD) or ripasudil (Rip) as above, as compared with their non-treated control (CONT), was plotted (panel (C), left). In terms of the results of the GHOF spheroids, the corresponding data reported in our precedent study [11] were recalculated and replotted (panel (C), right). All experiments were performed using freshly prepared 12–20 spheroids. *** p < 0.005, **** p < 0.001 (ANOVA followed by a Tukey’s multiple comparison test).
Figure 3
Figure 3
mRNA expression of ECMs in n-HOFs or GHOF 3D spheroids under several conditions. At Day 6, the n-HOFs 3D spheroids without or with 100 nM omidenepag (OMD) or 10 µM Ripasudil (Rip) were subjected to a qPCR analysis to estimate the mRNA expression of ECMs (COL1: collagen 1, COL4: collagen 4, COL6: collagen 6, Fn: fibronectin). Percentage difference in the mRNA expressions of these respective genes of n-HOF or GHOF spheroids treated with omidenepag (OMD) or ripasudil (Rip) as above, as compared with their non-treated control (CONT), were plotted. In terms of the results of the GHOF spheroids, corresponding data reported in our previous study [11] were recalculated and replotted. All experiments were performed in duplicate using fresh preparations, each of which consisted of 16 spheroids. Data are presented as the arithmetic mean ± standard error of the mean (SEM). * p < 0.05, ** p < 0.01, *** p < 0.005, **** p < 0.001 (ANOVA followed by a Tukey’s multiple comparison test).
Figure 4
Figure 4
mRNA expression of ECM-regulatory genes and inflammatory cytokines in n-HOFs or GHOF 3D spheroids under several conditions. At Day 6, the n-HOFs 3D spheroids without or with 100 nM omidenepag (OMD) or 10 µM Ripasudil (Rip) were subjected to a qPCR analysis to estimate the mRNA expression of ECM-regulatory genes (LOX: lysil oxidase, CTGF: Connective Tissue Growth Factor, EPAS1: endothelial PAS domain-containing protein 1), and inflammatory cytokines (IL1β: interleukin-1β, IL6: interleukin-6). Percent difference in the mRNA expressions of these respective genes of n-HOF or GHOF spheroids treated with omidenepag (OMD) or ripasudil (Rip) as above, as compared with their non-treated control (CONT) were plotted. In terms of the results of the GHOF spheroids, corresponding data reported in our previous study [11] were recalculated and replotted. All experiments were performed in duplicate using fresh preparations, each of which consisted of 16 spheroids. Data are presented as the arithmetic mean ± standard error of the mean (SEM). * p < 0.05, ** p < 0.01, *** p < 0.005, **** p < 0.001 (ANOVA followed by a Tukey’s multiple comparison test).
Figure 5
Figure 5
Effects of IGF-1, M22 and/or omidenepag (OMD) on the physical properties, size and stiffness of the n-HOFs 3D spheroids. At Day 6, n-HOFs 3D spheroids were treated with 100 ng/mL IGF-1,10 ng/mL M22 and/or 100 nM omidenepag (OMD), and their mean sizes and stiffness (μN/μm force/displacement) were plotted in panels (A,B), respectively. In panel (C), the 10 ng/mL M22/100 ng/mL IGF-1 treated HOFs 3D sphenoids without or with 100 nM omidenepag (OMD) were subjected to a qPCR analysis to estimate the mRNA expression of selected ECMs (COL; collagen1, 4 and 6), ECM-regulatory genes (LOX: lysil oxidase, and CTGF: Connective Tissue Growth Factor), and inflammatory cytokines (IL1β: interleukin-1β), which were differently regulated between GHOFs and n-HOFs upon the administration of 100 nM OMD (Table 2). All experiments were performed in duplicate using fresh preparations, each of which consisted of 16 spheroids. Data are presented as the arithmetic mean ± standard error of the mean (SEM). ** p < 0.01, **** p < 0.001 (ANOVA followed by a Tukey’s multiple comparison test).
Figure 6
Figure 6
mRNA expression of selected ECMs and inflammatory cytokines among n-HOF-, GHOF- and M22/IGF-1-treated n-HOFs 3D spheroids. At Day 6, n-HOF-, GHOF- or 10 ng/mL M22/100ng/mL IGF-1-treated n-HOFs 3D spheroids were subjected to a qPCR analysis to estimate the mRNA expression of selected ECMs (COL; collagen1, 4 and 6) and inflammatory cytokines (IL1β: interleukin-1β). All experiments were performed in duplicate using fresh preparations, each of which consisted of 16 spheroids. Data are presented as the arithmetic mean ± standard error of the mean (SEM). * p < 0.05, ** p < 0.01, *** p < 0.005, **** p < 0.001 (ANOVA followed by a Tukey’s multiple comparison test).
Figure 7
Figure 7
mRNA expression of ER stress-related genes among n-HOF-, GHOF- and M22/IGF-1-treated n-HOFs 3D spheroids. At Day 6, n-HOF-, GHOF- or 10 ng/mL M22/100 ng/mL IGF-1-treated n-HOFs 3D spheroids were subjected to a qPCR analysis to estimate the mRNA expression of ER stress-related genes, including major ER stress-related genes of the inositol-requiring enzyme 1 (IRE1), glucose regulator protein (GRP)78, GRP94, the X-box-binding protein-1 (XBP1), spliced XBP1 (sXBP1) and CCAAT/enhancer-binding protein homologous protein (CHOP). All experiments were performed in duplicate using fresh preparations, each of which consisted of 16 spheroids. Data are presented as the arithmetic mean ± standard error of the mean (SEM). * p < 0.05, ** p < 0.01 (ANOVA followed by a Tukey’s multiple comparison test).

Similar articles

Cited by

References

    1. Smith T.J., Hegedüs L. Graves’ Disease. N. Engl. J. Med. 2016;375:1552–1565. doi: 10.1056/NEJMra1510030. - DOI - PubMed
    1. Bahn R.S. Graves’ ophthalmopathy. N. Engl. J. Med. 2010;362:726–738. doi: 10.1056/NEJMra0905750. - DOI - PMC - PubMed
    1. Turcu A.F., Kumar S., Neumann S., Coenen M., Iyer S., Chiriboga P., Gershengorn M.C., Bahn R.S. A small molecule antagonist inhibits thyrotropin receptor antibody-induced orbital fibroblast functions involved in the pathogenesis of Graves ophthalmopathy. J. Clin. Endocrinol. Metab. 2013;98:2153–2159. doi: 10.1210/jc.2013-1149. - DOI - PMC - PubMed
    1. Smith T.J. TSH-receptor-expressing fibrocytes and thyroid-associated ophthalmopathy. Nat. Rev. Endocrinol. 2015;11:171–181. doi: 10.1038/nrendo.2014.226. - DOI - PMC - PubMed
    1. Peplinski L.S., Albiani Smith K. Deepening of lid sulcus from topical bimatoprost therapy. Optom. Vis. Sci. 2004;81:574–577. doi: 10.1097/01.opx.0000141791.16683.4a. - DOI - PubMed

MeSH terms

LinkOut - more resources