. 2021 Nov 25;12(1):6867.
doi: 10.1038/s41467-021-27018-9.

Interrogation of the microenvironmental landscape in spinal ependymomas reveals dual functions of tumor-associated macrophages

Affiliations

Interrogation of the microenvironmental landscape in spinal ependymomas reveals dual functions of tumor-associated macrophages

Qianqian Zhang et al. Nat Commun. .

Abstract

Spinal ependymomas are the most common spinal cord tumors in adults, but their intratumoral cellular heterogeneity has been less studied, and how spinal microglia are involved in tumor progression is still unknown. Here, our single-cell RNA-sequencing analyses of three spinal ependymoma subtypes dissect the microenvironmental landscape of spinal ependymomas and reveal tumor-associated macrophage (TAM) subsets with distinct functional phenotypes. CCL2+ TAMs are related to the immune response and exhibit a high capacity for apoptosis, while CD44+ TAMs are associated with tumor angiogenesis. By combining these results with those of single-cell ATAC-sequencing data analysis, we reveal that TEAD1 and EGR3 play roles in regulating the functional diversity of TAMs. We further identify diverse characteristics of both malignant cells and TAMs that might underlie the different malignant degrees of each subtype. Finally, assessment of cell-cell interactions reveal that stromal cells act as extracellular factors that mediate TAM diversity. Overall, our results reveal dual functions of TAMs in tumor progression, providing valuable insights for TAM-targeting immunotherapy.


Conflict of interest statement

The authors declare no competing interests.

Figures
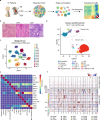
Fig. 1
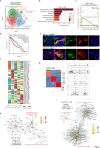
Fig. 1. Intratumoral cell types in spinal ependymomas revealed by scRNA-seq.
a Scheme of the overall study design. scRNA-seq (10× Genomics) was applied to cells isolated from three subtypes of spinal ependymomas. b Hematoxylin and eosin (HE) staining of tumors from different cancer subtypes. The scale bar represents 30 μm. Images shown are representatives of more than three samples from three independent experiments. c Uniform Manifold Approximation and Projection (UMAP) plot showing the patient distribution of malignant cells, without donor effect correction. d UMAP plot of stromal and immune cell types from all patients (SE1-3, AEP1-3, EPN1-9), donor effect corrected by BBKNN. e Heatmap showing the expression of canonical gene markers of stromal and immune cell types. f Inference of copy-number variations (CNVs) from scRNA-seq. Each row corresponds to a cell. The top panel represents nonmalignant cells, and the bottom panel represents malignant cells, ordered by the patient. See also Supplementary Figs. 1 and 2 and Supplementary Data 1 and 2.
Fig. 2
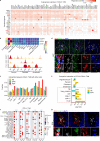
Fig. 2. Two TAM subsets show distinct functional phenotypes in ependymomas.
a UMAP plot of seven subclusters of monocytes and TAMs. b Bar plot of enriched hallmark pathways for genes upregulated in CCL2+ TAMs. P values were calculated by using enrichr function from R package clusterProfiler with hypergeometric test statistical analyses. Source data are provided as a Source Data file. c Enrichment plot of the hallmark angiogenesis pathway in CD44+ TAMs. P values were calculated by using GESA function from R package clusterProfiler. d Kaplan–Meier plot showing worse clinical outcome for high expression of CD44+ TAMs signature genes in LGG patients from TCGA. +, censored observations. P values were calculated by using both the log-rank test and Cox proportional hazards model. e Representative example of an EPN tumor stained by IF. The upper panel image indicates AIF1+CD44+ TAMs (the scale bar represents 30 μm). The dashed boxes highlight regions shown on the right side and the arrow depicts the CD44+ TAMs in fluorescent images (the scale bar represents 100 μm). The bottom panel image indicates AIF1+CCL2+ TAMs (the scale bar represents 30 μm). The dashed boxes highlight regions shown on the right side and the arrow depicts the CCL2+ TAMs in fluorescent images (the scale bar represents 100 μm). Images shown are representatives of three samples from three independent experiments. f Heatmap showing TF activity for each TAM subsets. The row name showed the regulon gene sets name and gene number is written in the round brackets. The red color marks the regulon of interest. g Heatmap showing cluster-specific ATAC-seq peaks (left). Browser tracks showing ATAC-seq signals for selected marker genes (right). h Network plot of enriched curated gene sets for genes regulated by EGR3 in CCL2+ TAM subset. Nodes for genes were colored by log2FC, and the sizes of nodes for enriched pathways were correlated with the number of genes. i Network plot of enriched curated gene sets for genes regulated by TEAD1 in CD44+ TAM subset. Nodes for genes were colored by log2FC, and the sizes of nodes for enriched pathways were correlated with the number of genes. See also Supplementary Figs. 2–3 and Supplementary Data 3–5.
Fig. 3
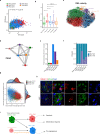
Fig. 3. Developmental trajectory of TAM subsets in spinal ependymomas.
a Scatter plot showing the Pearson correlation between the M1 and M2 signature scores. b Box plot showing the M1 signature score in each TAM subset. P values were calculated by the Wilcoxon test, two-sided comparisons. Multiple hypothesis correction using the Benjamini–Hochberg procedure. n = 15,049 cells. The center line, bounds of box, and whiskers represent mean, 25th to 75th percentile range, and minimum to maximum range in all boxplots. c Steady-state RNA velocity of TAM subsets. d PAGA graph showing the inferred developmental trajectories for TAM subsets. The edge width was correlated with the strength of connectivity between two subclusters. e Bar plot showing PAGA connectivity with CD14+ monocytes. f Bar plot showing the proportion of monocyte origin and tissue-resident microglia origin across each TAM subset (using data reported by Pombo et al. as a reference). Source data are provided as a Source Data file. g Scatter plot showing the scores by average expression of signature genes of tissue-resident microglia versus monocyte-derived macrophages. h Representative examples of tumor section stained by IF. The upper panel image indicates CD44+ TMEM119+ microglia in EPN tumor (the scale bar represents 30 μm). The dashed boxes highlight regions shown on the right side and the arrow depicts the CD44+ microglia in fluorescent images (the scale bar represents 100 μm). The bottom panel image indicates CD44+ TMEM119+ microglia in AEP tumor (the scale bar represents 30 μm). The dashed boxes highlight regions shown on the right side and the arrow depicts the CD44+ microglia in fluorescent images (the scale bar represents 100 μm). Images shown are representatives of three samples from three independent experiments. i Model of the developmental trajectory of monocyte/TAM lineages in spinal ependymomas. See also Supplementary Figs. 3 and 4.
Fig. 4
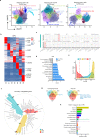
Fig. 4. Heterogeneity of malignant cells in each ependymoma cancer subtype.
a UMAP plots showing subclusters of malignant cells in each cancer subtype, donor effect corrected by Harmony. b Heatmap showing signature genes for each malignant cell subcluster in EPN. Selected genes were labeled on the right side. c Scatter plots showing average expression of 12 generic tumor cell programs in each malignant subset in EPN. The boxes highlight programs which were expressed in specific subsets. d Bar plot showing different pathways enriched in VEGFA+ C4 and other clusters from EPN scored per cell by gene set variation analysis (GSVA). t values were calculated with limma regression. e Density plot showing the entropy of patient distribution for malignant cells in each cancer subtype. f Circular bar plot showing the number of targetable genes from different categories in each cancer subtype. g Venn plots showing the intersection of targetable genes in astroependymal-like and NSC-like subpopulations across different cancer subtypes. The shared genes between the three cancer subtypes are listed on the right side. h Bar plot showing the number of targetable genes from different categories in VEGFA+ subpopulation of EPN. Source data are provided as a Source Data file. See also Supplementary Fig. 5 and Supplementary Data 6 and 7.
Fig. 5
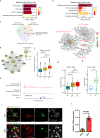
Fig. 5. Transcriptional differences detected by scRNA-seq analyses reveal cancer subtype-specific characteristics.
a Bar plot of enriched hallmark pathways for genes upregulated in malignant cells from EPN. Adjusted P values were labeled for each pathway. Adjusted P values were calculated by using enrichr function from R package clusterProfiler with hypergeometric test statistical analyses. b Bar plot of enriched hallmark pathways for genes upregulated in malignant cells from AEP (top). Network plot of enriched hallmark pathways for upregulated genes in malignant cells from AEP. Nodes for genes were colored by log2FC, and sizes of nodes for enriched pathways were correlated with the number of genes (bottom). Adjusted P values were labeled for each pathway. Adjusted P values were calculated by using enrichr function from R package clusterProfiler with hypergeometric test statistical analyses. c Venn plot showing the intersection of EMT-related genes with active transcriptional signals. The shared genes are listed on the right side. The red color marks the key genes of interest. d Network plot showing the connection between CDH6 and its upstream TFs. Sizes of circles were related to the correlation value between CDH6 and TFs. e Normalized scATAC-seq profile of CDH6 in AEP across each major subpopulation and NFIB-CDH6 binding site. f Box plot showing the normalized gene expression of NFIB from different cancer subtypes. Adjusted P values were calculated by the Wilcoxon test, two-sided comparisons. n = 122,456 cells. The center line, bounds of box, and whiskers represent mean, 25th to 75th percentile range, and minimum to maximum range in all boxplots. g Box plot showing the angiogenesis signature score of CD44+ TAMs from different cancer subtypes. Adjusted P values were calculated by the Wilcoxon test, two-sided comparisons. n = 3912 cells. The center line, bounds of box, and whiskers represent mean, 25th to 75th percentile range, and minimum to maximum range in all boxplots. h Box plot showing the apoptosis signature score of CCL2+ TAMs from different cancer subtypes. Adjusted P value was calculated by the Wilcoxon test, two-sided comparisons. n = 4647 cells. The center line, bounds of box, and whiskers represent mean, 25th to 75th percentile range, and minimum to maximum range in all boxplots. i Representative example of an EPN and AEP tumor stained by IF. The arrow depicts the CASP3+ TAMs in fluorescent images, and the scale bar represents 30 μm. j Bar plot showing the proportion of CASP3+ TAM in EPN and AEP (n = 3 biologically independent samples). The P value was calculated by t test, Two-way ANOVA analysis. Data are presented as mean values +/− SEM. Source data are provided as a Source Data file. See also Supplementary Fig. 5 and Supplementary Data 4 and 8–10.
Fig. 6
Fig. 6. Cell–cell interaction analyses inform the mechanism of the formation of two TAM subsets.
a Heatmap showing potential ligands driving the signature of CD44+ TAMs. The red color marks the genes of interest. b Heatmap showing the expression of selected ligands in stromal and immune cells (top). Violin plot showing the expression of selected ligands in fibroblasts, endothelial cells and pericytes from each cancer subtype (bottom). c Bar plot showing the fraction distribution of significant interaction events around CD44+ TAMs. The fraction of each interaction pair was calculated by dividing the total number of interaction events related to CD44+ TAMs. d Representative example of an AEP tumor stained by IF with anti-AIF1 (red), CD44 (green), VWF (gray), and DAPI (blue) antibodies. Dashed boxes highlight regions shown in the bottom panel. The white arrow depicts the CD44+ TAMs and the yellow arrow depicts the endothelial cells in fluorescent images. The scale bar in the top panel represents 30 μm, and the scale bar in the bottom panel represents 100 μm. Images shown are representatives of three samples from three independent experiments. e Bar plot showing the ratio of interaction events of CCL2+ TAMs to that of CD44+ TAMs. The fraction of each interaction pair was calculated by dividing the total number of interaction events related to CD44+ and CCL2+ TAMs. Source data are provided as a Source Data file. f Bubble heatmap showing selected significant LR pairs between CCL2+ TAMs and immune cells in each cancer subtype. Each row represents an LR pair, and each column defines a cell–cell interaction pair in a specific cancer subtype. P values were indicated by circle color and size. The red-color marking was the key ligand–receptor pair of interest. P values were calculated by CellPhoneDB. g Representative example of an EPN tumor stained by IF with anti-AIF1 (red), CCL2 (green), CD3 (gray), and DAPI (blue) antibodies. The white arrow depicts the CCL2+ TAMs and the yellow arrow depicts the T cells in fluorescent images. The scale bar in the top panel represents 30 μm and the scale bar in the bottom panel represents 100 μm. Images shown are representatives of three samples from three independent experiments. See also Supplementary Figs. 6 and 7.

Similar articles

Cited by

References

    1. Pajtler KW, et al. Molecular classification of ependymal tumors across all CNS compartments, histopathological grades, and age groups. Cancer Cell. 2015;27:728–743. - PMC - PubMed
    1. Hanbali F, et al. Spinal cord ependymoma: radical surgical resection and outcome. Neurosurgery. 2002;51:1162–1172. - PubMed
    1. Connolly ID, Ali R, Li Y, Gephart MH. Genetic and molecular distinctions in spinal ependymomas: a review. Clin. Neurol. Neurosurg. 2015;139:210–215. - PubMed
    1. Ruda R, Gilbert M, Soffietti R. Ependymomas of the adult: molecular biology and treatment. Curr. Opin. Neurol. 2008;21:754–761. - PubMed
    1. Mohankumar KM, et al. An in vivo screen identifies ependymoma oncogenes and tumor-suppressor genes. Nat. Genet. 2015;47:878–887. - PMC - PubMed

Publication types