. 2021 Dec 1;35(23-24):1595-1609.
doi: 10.1101/gad.348874.121. Epub 2021 Nov 24.

Widespread microRNA degradation elements in target mRNAs can assist the encoded proteins

Affiliations

Widespread microRNA degradation elements in target mRNAs can assist the encoded proteins

Lu Li et al. Genes Dev. .

Abstract

Binding of microRNAs (miRNAs) to mRNAs normally results in post-transcriptional repression of gene expression. However, extensive base-pairing between miRNAs and target RNAs can trigger miRNA degradation, a phenomenon called target RNA-directed miRNA degradation (TDMD). Here, we systematically analyzed Argonaute-CLASH (cross-linking, ligation, and sequencing of miRNA-target RNA hybrids) data and identified numerous candidate TDMD triggers, focusing on their ability to induce nontemplated nucleotide addition at the miRNA 3' end. When exogenously expressed in various cell lines, eight triggers induce degradation of corresponding miRNAs. Both the TDMD base-pairing and surrounding sequences are essential for TDMD. CRISPR knockout of endogenous trigger or ZSWIM8, a ubiquitin ligase essential for TDMD, reduced miRNA degradation. Furthermore, degradation of miR-221 and miR-222 by a trigger in BCL2L11, which encodes a proapoptotic protein, enhances apoptosis. Therefore, we uncovered widespread TDMD triggers in target RNAs and demonstrated an example that could functionally cooperate with the encoded protein.

Keywords: AGO-CLASH; BCL2L11; TDMD; apoptosis; microRNA.


Figures

Figure 1.
Figure 1.
A wide range of transcripts contain potential TDMD triggers. (A) Schematic of AGO-CLASH and target-directed miRNA degradation (TDMD) base-pairing pattern. AGO2 structure (PDB: 6MDZ) is used in the illustration. A detailed description is given in the text. (B) The percentage of miRNA with extension in the hybrids of CYRANO/miR-7, NREP/miR-29b, SERPINE1/miR-30c, or all RNA/miRNA. Each dot represents a data point from one AGO-CLASH data set. (**) P < 0.01, ratio paired t test. (C) The composition of different types of RNA in the AGO-CLASH miRNA-containing hybrids obtained from HCT116 cells, comparing all hybrids and TDMD hybrids. (D) High-confidence TDMD hybrid screening based on five criteria. See the Materials and Methods for details. (E) Organization and conservation of the human BCL2L11 locus. Shown below the gene model ([blue boxes] exons, [blue line] introns) is a conservation plot, which is based on a 100-vertebrate basewise conservation by PhyloP. Diagramed below is the pairing of miR-221 and miR-222 to its potential TDMD trigger, located within the most conserved region of BCL2L11.
Figure 2.
Figure 2.
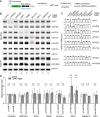
Exogenous expression of candidate TDMD triggers in cells decreases corresponding miRNAs. (A) Schematic of high-confidence TDMD trigger validation in HEK293T cells. Two-hundred base pairs to 600 bp of the TDMD regions were inserted into a GFP reporter. The plasmids were transfected in HEK293T cells for 2 d and cells were collected to detect miRNA abundance by Northern blot or pri-miRNA abundance by RT-qPCR. The TDMD trigger, flanking region, and GFP are represented by blue, black, and green rectangles, respectively. (B) Representative Northern blots measuring miR-7, miR-92a, miR-218, miR-221, miR-222, miR-15a, miR-23a, miR-320a, and miR-16 levels in HEK293T cells transfected with the TDMD reporters illustrated in A. RNA samples were either total RNA or AGO-associating RNA. Red dotted rectangles highlight the lanes with corresponding miRNA and the TDMD trigger. (C) Quantification of miRNA levels in Northern blots as represented in B. miRNA abundance was normalized to miR-16. Statistically significant changes compared with the GFP control are indicated. (**) P < 0.01, (***) P < 0.001, (****) P < 0.0001, ordinary ANOVA with Dunnett's test. n = 4 biological replicates. (D) The influence of TDMD transcripts on pri-miRNA and pre-miRNA expression in control plasmid transfected cells and TDMD reporter transfected cells, as determined by RT-qPCR, normalized to the geometric mean of the values for ACTIN housekeeping gene. Error bars indicate SD. (n.s.) P > 0.05, unpaired Welch's t-test. n = 3 biological replicates.
Figure 3.
Figure 3.
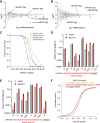
TDMD triggers promote miRNA degradation and miRNA 3′ end extension, and influence miRNA function. The influence of BCL2L11 trigger on miRNA levels (A) and miRNA isoforms (B) in 293T cells. Relative miRNA levels (A) and isoforms (B) were measured by small RNA-seq after transfection of BCL2L11 trigger reporter and compared with the control reporter. n = 2 biological replicates. miR-221 and miR-222 are indicated by red dots, and the blue dots represent their passenger strands. (C) The fraction of sRNA-seq reads with coverage of 18–30 nt for miR-221 and miR-222. For each miRNA, solid lines delineate the control samples, and dashed lines delineate the BCL2L11 trigger-expressing samples. n = 2 biological replicates. Frequency of tailing for miR-221 (D) and miR-222 (E) in BCL2L11 trigger reporter transfected 293T cells. Shown are the percent fractions of the tailed miR-221/222 reads relative to the total miR-221/222 reads. miR-221 and miR-222 sequences (red capital letters), together with the genomic sequence downstream (black underlined letters), are given below the plot. (F) Repression of miR-221/222 targets in BCL2L11 transfected 293T cells. Plotted are cumulative fractions of mRNA fold changes observed after degradation of miR-221/222 in BCL2L11 trigger reporter transfected 293T cells, comparing the impact on all predicted miR-221/222 targets (orange line) and conserved predicted miR-221/222 targets (red line) with that of nontargets (black).
Figure 4.
Figure 4.
Sequence requirement for TDMD triggers. Schematic of the WT BCL2L11 trigger (A) and TRIM9 trigger (C) constructs with a mutated miR-221/222 or miR-218 site. The miR-221/222 site in BCL2L11 or the miR-218 site in TRIM9 was mutated to either disrupt or expand pairing to the corresponding miRNA or introduce an extensively complementary site to miR-16. The importance of the complementary site for the BCL2L11 trigger (B) or TRIM9 trigger (D) function. Representative Northern blot measuring miR-221, miR-222, miR-218, miR-16, miR-92a, and let-7a levels in HEK293T cells transfected with the constructs described in A and C. The normalized miRNA abundance and standard deviation are shown below each miRNA band. miRNA abundance in B and D was normalized to miR-92a and let-7a, respectively. The miRNA abundance in control samples was normalized to 1. n = 3 biological replicates. (E) Schematic of long and short TDMD trigger constructs. The long TDMD trigger includes the trigger sequence as well as the conserved flanking regions, while the short TDMD trigger contains only the TDMD trigger sequence. (F) The importance of the TDMD-flanking region on miRNA degradation. Representative Northern blot measuring miR-7, miR-218, miR-221, miR-222, and miR-16 levels in HEK293T cells transfected with either the long or short TDMD constructs described in E. The normalized miRNA abundance and standard deviation are shown below each miRNA band. miRNA abundance was normalized to miR-16. n = 3 biological replicates.
Figure 5.
Figure 5.
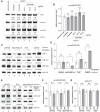
ZSWIM8 and the endogenous BCL2L11 TDMD trigger control miR-221/222 abundance. (A) The influence of ZSWIM8 on miR-221/222 accumulation in U87MG cells. Representative Northern blot measuring miR-7 (positive control), miR-221, miR-222, and miR-16 levels in U87MG cells stably expressing control or the Bcl2l11 trigger. In Bcl2l11 trigger cell lines, a scramble sgRNA, or one of the three sgRNAs (KO-1, KO-2, and KO-3) targeting ZSWIM8, was used for CRISPR-mediated KO. The normalized miRNA abundance and standard deviation are shown below each miRNA band. miRNA abundance was normalized to miR-16. The miRNA abundance in parental cells was normalized to 1. n = 3 biological replicates. (B) Primary transcripts for miR-221/222 measured by RT-qPCR in U87MG cell lines related to A, normalized to the levels of the ACTIN housekeeping gene. Error bars indicate SD. (n.s.) P > 0.05, unpaired Welch's t-test. n = 3 biological replicates. (C) The influence of neddylation inhibitor MLN4924 on miR-221/222 accumulation. Northern blot analysis of four cells (U87MG, MDA-MB-231, TIVE, and ONS76) following 48 h of 1 μM MLN4924 treatment. The normalized miRNA abundance and standard deviation are shown below each miRNA band. miRNA abundance was normalized to miR-16. The miRNA abundance in untreated cells was normalized to 1. n = 3 biological replicates. (D) Primary transcripts for the miR-221/222 measured by RT-qPCR in four cells (U87MG, MDA-MB-231, TIVE, and ONS76) related to C, normalized to the levels of the ACTIN housekeeping gene. Error bars indicate SD. (n.s.) P > 0.05, (**) P < 0.01, (****) P < 0.0001, unpaired Welch's t-test. n = 3 biological replicates. (E) The influence of the BCL2L11 TDMD trigger on miR-221/222 accumulation. Shown is a representative Northern blot measuring miR-221, miR-222, let-7, and miR-16 levels in three independently derived U87MG, TIVE, and MDA-MB-231 cell populations with or without BCL2L11 TDMD trigger KO. The normalized miRNA abundance and standard deviation are shown below each miRNA band. miRNA abundance was normalized to miR-16. The miRNA abundance in wild-type (WT) cells was normalized to 1. n = 3 biological replicates. (F,G) Primary transcripts for the miR-221/222 (F) and BCL2L11 (G) transcripts measured by RT-qPCR in three cell populations (U87MG, MDA-MB-231, and TIVE) related to E, normalized to the levels of the ACTIN housekeeping gene. Error bars indicate SD. (n.s.) P > 0.05, unpaired Welch's t-test. n = 3 biological replicates.
Figure 6.
Figure 6.
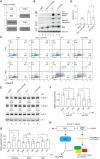
The BCL2L11 TDMD trigger enhances BIM-induced apoptosis. (A) Schematic of WT or mutation form of the BCL2L11 TDMD region fused to either the WT or BH3 domain-deleted (ΔBH3) BIM coding sequence. The tet-on promoter-containing constructs were induced by 500 ng/mL doxycycline for 24 h in BG. (B) Expression of cleaved PARP, cleaved caspase3, and BIM in four HCT116 lines containing different doxycycline-inducible BIM constructs as illustrated in A, with or without induction. HSC-70 protein was used as a loading reference. (C) Flow cytometry analyses of Annexin V- and propidium iodide-stained HCT116 cells as in A and B; the percentage of cells in each quadrant is labeled. (D) Quantification of apoptotic cells (Annexin-V+-stained; induced − uninduced) in four independently derived HCT116 lines in C. The asterisk marks significant values. (*) P < 0.05, ratio paired t test. n = 4 biological replicates. (E) Representative Northern blot measuring miR-221, miR-222, and miR-16 levels in four HCT116 lines containing different doxycycline-inducible BIM constructs as illustrated in A, with or without induction. The normalized miRNA abundance and standard deviation are shown below each miRNA band. miRNA abundance was normalized to miR-16. The miRNA abundance in uninduced samples was normalized to 1. n = 3 biological replicates. The influence of the BCL2L11 TDMD trigger on miR-221/222 (F) and three targets’ (G) abundance in sorted apoptotic cells expressing the TDMD construct compared with cells expressing the mutTDMD construct, normalized to the levels of miR-26a for miRNA or ACTIN housekeeping gene for targets. Error bars indicate SD. (n.s.) P > 0.05, (*) P < 0.05, (**) P < 0.01, unpaired Welch's t-test. n = 4 biological replicates. (H) Model of cooperative apoptosis induction by the BCL2L11 mRNA.

Similar articles

Cited by

References

    1. Ameres SL, Horwich MD, Hung JH, Xu J, Ghildiyal M, Weng Z, Zamore PD. 2010. Target RNA-directed trimming and tailing of small silencing RNAs. Science 328: 1534–1539. 10.1126/science.1187058 - DOI - PMC - PubMed
    1. Bartel DP. 2018. Metazoan microRNAs. Cell 173: 20–51. 10.1016/j.cell.2018.03.006 - DOI - PMC - PubMed
    1. Bitetti A, Mallory AC, Golini E, Carrieri C, Carreño Gutiérrez H, Perlas E, Pérez-Rico YA, Tocchini-Valentini GP, Enright AJ, Norton WHJ, et al. 2018. MicroRNA degradation by a conserved target RNA regulates animal behavior. Nat Struct Mol Biol 25: 244–251. 10.1038/s41594-018-0032-x - DOI - PubMed
    1. Bolger AM, Lohse M, Usadel B. 2014. Trimmomatic: a flexible trimmer for Illumina sequence data. Bioinformatics 30: 2114–2120. 10.1093/bioinformatics/btu170 - DOI - PMC - PubMed
    1. Brinkman EK, Chen T, Amendola M, van Steensel B. 2014. Easy quantitative assessment of genome editing by sequence trace decomposition. Nucleic Acids Res 42: e168. 10.1093/nar/gku936 - DOI - PMC - PubMed

Publication types

LinkOut - more resources