FOXP3+ T cells in uterine sarcomas are associated with favorable prognosis, low extracellular matrix expression and reduced YAP activation
- PMID: 34799669
- PMCID: PMC8604926
- DOI: 10.1038/s41698-021-00236-6
FOXP3+ T cells in uterine sarcomas are associated with favorable prognosis, low extracellular matrix expression and reduced YAP activation
Abstract
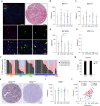
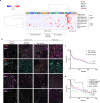
Uterine sarcomas are rare but deadly malignancies without effective treatment. Immunotherapy is a promising new approach to treat these tumors but has shown heterogeneous effects in sarcoma patients. With the goal of identifying key factors for improved patient treatment, we characterized the tumor immune landscape in 58 uterine sarcoma cases with full clinicopathological annotation. Immune cell characterization revealed the overall prevalence of FOXP3+ cells and pro-tumor M2-like macrophages. Hierarchical clustering of patients showed four tumor type-independent immune signatures, where infiltration of FOXP3+ cells and M1-like macrophages associated with favorable prognosis. High CD8+/FOXP3+ ratio in UUS and ESS correlated with poor survival, upregulation of immunosuppressive markers, extracellular matrix (ECM)-related genes and proteins, and YAP activation. This study shows that uterine sarcomas present distinct immune signatures with prognostic value, independent of tumor type, and suggests that targeting the ECM could be beneficial for future treatments.
© 2021. The Author(s).
Conflict of interest statement
The authors declare no competing interests.
Figures


Similar articles
-
Integrated Molecular Analysis of Undifferentiated Uterine Sarcomas Reveals Clinically Relevant Molecular Subtypes.Clin Cancer Res. 2019 Apr 1;25(7):2155-2165. doi: 10.1158/1078-0432.CCR-18-2792. Epub 2019 Jan 7. Clin Cancer Res. 2019. PMID: 30617134
-
Macrophage infiltration and genetic landscape of undifferentiated uterine sarcomas.JCI Insight. 2017 Jun 2;2(11):e94033. doi: 10.1172/jci.insight.94033. eCollection 2017 Jun 2. JCI Insight. 2017. PMID: 28570276 Free PMC article.
-
Immune-related prognostic genes signatures in the tumor microenvironment of sarcoma.Math Biosci Eng. 2021 Mar 5;18(3):2243-2257. doi: 10.3934/mbe.2021113. Math Biosci Eng. 2021. PMID: 33892543
-
Uterine sarcoma Part II-Uterine endometrial stromal sarcoma: The TAG systematic review.Taiwan J Obstet Gynecol. 2016 Aug;55(4):472-9. doi: 10.1016/j.tjog.2016.04.034. Taiwan J Obstet Gynecol. 2016. PMID: 27590366 Review.
-
Immunotherapy: A New (and Old) Approach to Treatment of Soft Tissue and Bone Sarcomas.Oncologist. 2018 Jan;23(1):71-83. doi: 10.1634/theoncologist.2016-0025. Epub 2017 Sep 21. Oncologist. 2018. PMID: 28935774 Free PMC article. Review.
Cited by
-
The axis of tumor-associated macrophages, extracellular matrix proteins, and cancer-associated fibroblasts in oncogenesis.Cancer Cell Int. 2024 Oct 7;24(1):335. doi: 10.1186/s12935-024-03518-8. Cancer Cell Int. 2024. PMID: 39375726 Free PMC article. Review.
-
Constructing a Prognostic Model of Uterine Corpus Endometrial Carcinoma and Predicting Drug-Sensitivity Responses Using Programmed Cell Death-Related Pathways.J Cancer. 2024 Mar 31;15(10):2948-2959. doi: 10.7150/jca.92201. eCollection 2024. J Cancer. 2024. PMID: 38706893 Free PMC article.
-
Matrix stiffness affects tumor-associated macrophage functional polarization and its potential in tumor therapy.J Transl Med. 2024 Jan 21;22(1):85. doi: 10.1186/s12967-023-04810-3. J Transl Med. 2024. PMID: 38246995 Free PMC article. Review.
-
Molecular characterization of ferroptosis in soft tissue sarcoma constructs a prognostic and immunotherapeutic signature through experimental and bioinformatics analyses.Aging (Albany NY). 2023 Oct 20;15(20):11412-11447. doi: 10.18632/aging.205133. Epub 2023 Oct 20. Aging (Albany NY). 2023. PMID: 37874682 Free PMC article.
-
MMP14 expression and collagen remodelling support uterine leiomyosarcoma aggressiveness.Mol Oncol. 2024 Apr;18(4):850-865. doi: 10.1002/1878-0261.13440. Epub 2023 Apr 28. Mol Oncol. 2024. PMID: 37078535 Free PMC article.
References
Grants and funding
LinkOut - more resources
Full Text Sources
Research Materials

