

Relaxed 3D genome conformation facilitates the pluripotent to totipotent-like state transition in embryonic stem cells
- PMID: 34791385
- PMCID: PMC8643704
- DOI: 10.1093/nar/gkab1069
Relaxed 3D genome conformation facilitates the pluripotent to totipotent-like state transition in embryonic stem cells
Abstract
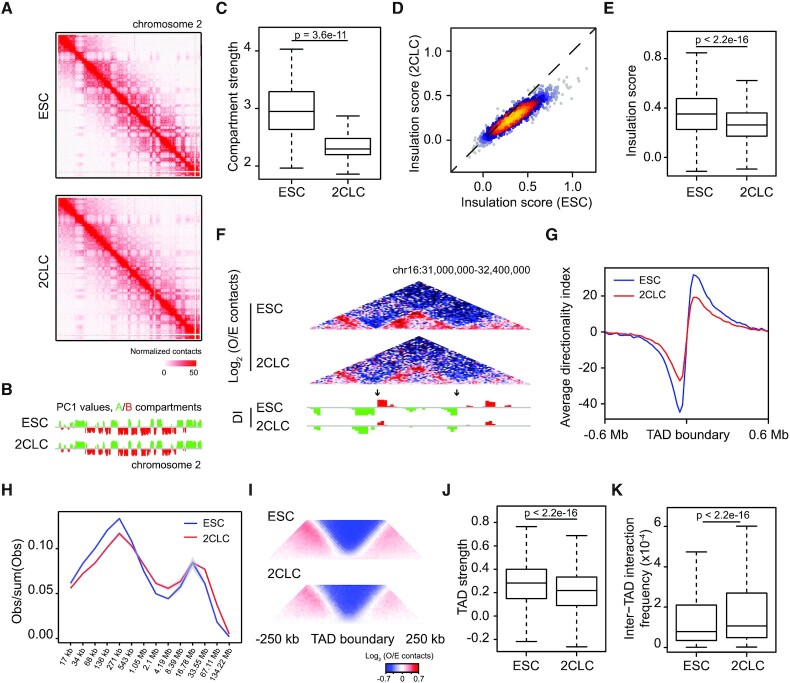
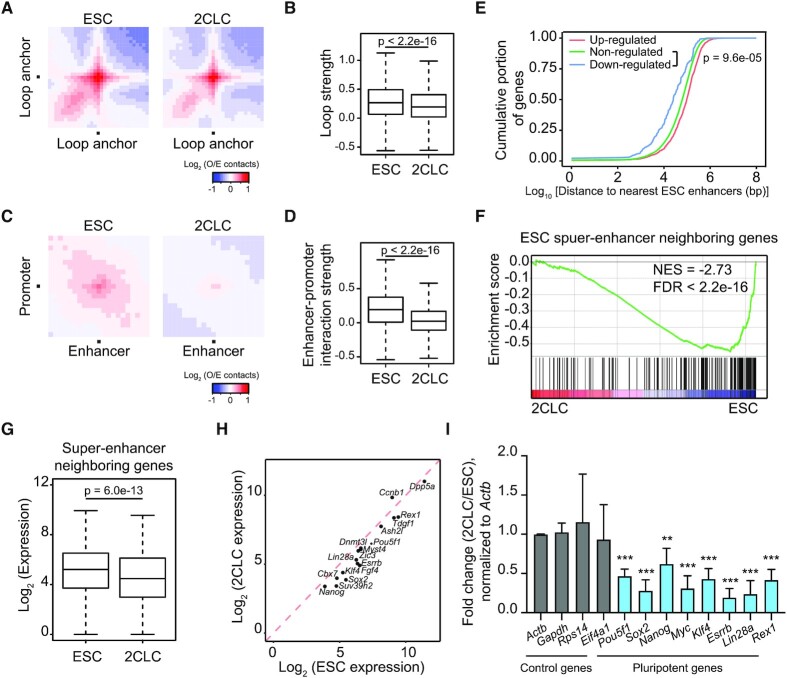
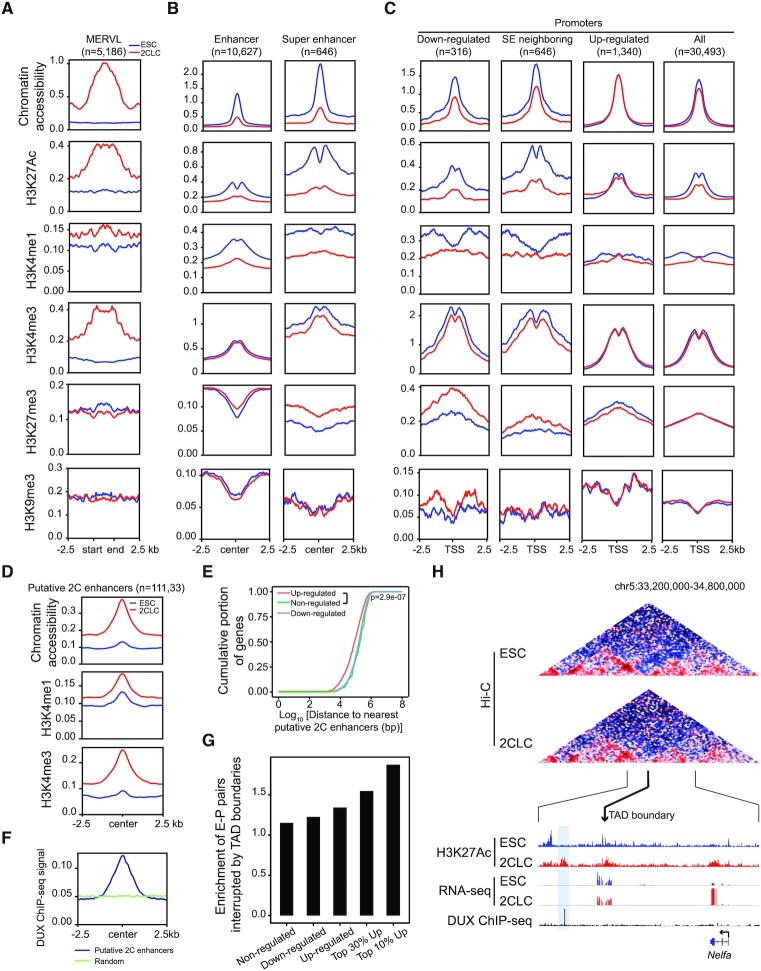
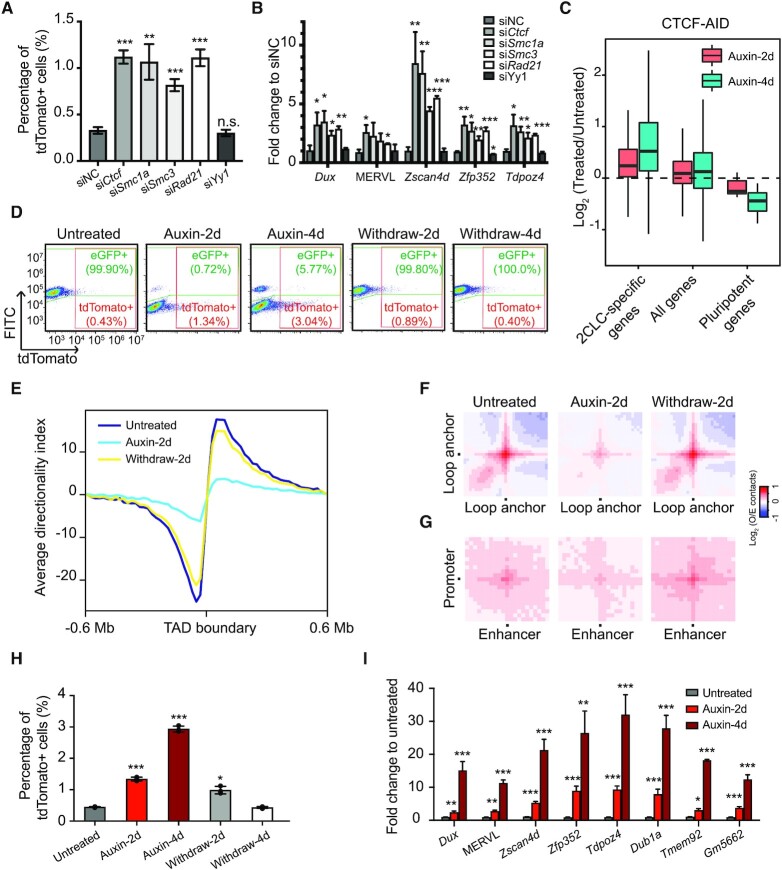
The 3D genome organization is crucial for gene regulation. Although recent studies have revealed a uniquely relaxed genome conformation in totipotent early blastomeres of both fertilized and cloned embryos, how weakened higher-order chromatin structure is functionally linked to totipotency acquisition remains elusive. Using low-input Hi-C, ATAC-seq and ChIP-seq, we systematically examined the dynamics of 3D genome and epigenome during pluripotent to totipotent-like state transition in mouse embryonic stem cells (ESCs). The spontaneously converted 2-cell-embryo-like cells (2CLCs) exhibited more relaxed chromatin architecture compared to ESCs, including global weakening of both enhancer-promoter interactions and TAD insulation. While the former correlated with inactivation of ESC enhancers and down-regulation of pluripotent genes, the latter might facilitate contacts between the putative new enhancers arising in 2CLCs and neighboring 2C genes. Importantly, disruption of chromatin organization by depleting CTCF or the cohesin complex promoted the ESC to 2CLC transition. Our results thus establish a critical role of 3D genome organization in totipotency acquisition.
© The Author(s) 2021. Published by Oxford University Press on behalf of Nucleic Acids Research.
Figures
Similar articles
-
Comparative Analyses of Single-Cell Transcriptomic Profiles between In Vitro Totipotent Blastomere-like Cells and In Vivo Early Mouse Embryonic Cells.Cells. 2021 Nov 10;10(11):3111. doi: 10.3390/cells10113111. Cells. 2021. PMID: 34831338 Free PMC article.
-
The totipotent 2C-like state safeguards genomic stability of mouse embryonic stem cells.J Cell Physiol. 2024 Sep;239(9):e31337. doi: 10.1002/jcp.31337. Epub 2024 Jun 11. J Cell Physiol. 2024. PMID: 38860420
-
DUX-miR-344-ZMYM2-Mediated Activation of MERVL LTRs Induces a Totipotent 2C-like State.Cell Stem Cell. 2020 Feb 6;26(2):234-250.e7. doi: 10.1016/j.stem.2020.01.004. Cell Stem Cell. 2020. PMID: 32032525 Free PMC article.
-
2-Cell-like Cells: An Avenue for Improving SCNT Efficiency.Biomolecules. 2022 Nov 1;12(11):1611. doi: 10.3390/biom12111611. Biomolecules. 2022. PMID: 36358959 Free PMC article. Review.
-
The emergence of genome architecture and zygotic genome activation.Curr Opin Cell Biol. 2020 Jun;64:50-57. doi: 10.1016/j.ceb.2020.02.002. Epub 2020 Mar 19. Curr Opin Cell Biol. 2020. PMID: 32220807 Free PMC article. Review.
Cited by
-
Advances in understanding the regulation of pluripotency fate transition in embryonic stem cells.Front Cell Dev Biol. 2024 Oct 16;12:1494398. doi: 10.3389/fcell.2024.1494398. eCollection 2024. Front Cell Dev Biol. 2024. PMID: 39479513 Free PMC article. Review.
-
DNA replication fork speed underlies cell fate changes and promotes reprogramming.Nat Genet. 2022 Mar;54(3):318-327. doi: 10.1038/s41588-022-01023-0. Epub 2022 Mar 7. Nat Genet. 2022. PMID: 35256805 Free PMC article.
-
Selective binding of retrotransposons by ZFP352 facilitates the timely dissolution of totipotency network.Nat Commun. 2023 Jun 20;14(1):3646. doi: 10.1038/s41467-023-39344-1. Nat Commun. 2023. PMID: 37339952 Free PMC article.
-
DUX: One Transcription Factor Controls 2-Cell-like Fate.Int J Mol Sci. 2022 Feb 13;23(4):2067. doi: 10.3390/ijms23042067. Int J Mol Sci. 2022. PMID: 35216182 Free PMC article. Review.
-
Obox4 promotes zygotic genome activation upon loss of Dux.Elife. 2024 Jun 24;13:e95856. doi: 10.7554/eLife.95856. Elife. 2024. PMID: 38856708 Free PMC article.
References
-
- Xu Q., Xie W.. Epigenome in early mammalian development: inheritance, reprogramming and establishment. Trends Cell Biol. 2018; 28:237–253. - PubMed
-
- Peaston A.E., Evsikov A.V., Graber J.H., de Vries W.N., Holbrook A.E., Solter D., Knowles B.B.. Retrotransposons regulate host genes in mouse oocytes and preimplantation embryos. Dev. Cell. 2004; 7:597–606. - PubMed
-
- Hamatani T., Carter M.G., Sharov A.A., Ko M.S.. Dynamics of global gene expression changes during mouse preimplantation development. Dev. Cell. 2004; 6:117–131. - PubMed
Publication types
MeSH terms
Substances
LinkOut - more resources
Full Text Sources
Molecular Biology Databases
