. 2021 Nov 17;17(11):e1010046.
doi: 10.1371/journal.ppat.1010046. eCollection 2021 Nov.

ADCC-mediating non-neutralizing antibodies can exert immune pressure in early HIV-1 infection

Affiliations

ADCC-mediating non-neutralizing antibodies can exert immune pressure in early HIV-1 infection

Dieter Mielke et al. PLoS Pathog. .

Abstract

Despite antibody-dependent cellular cytotoxicity (ADCC) responses being implicated in protection from HIV-1 infection, there is limited evidence that they control virus replication. The high mutability of HIV-1 enables the virus to rapidly adapt, and thus evidence of viral escape is a very sensitive approach to demonstrate the importance of this response. To enable us to deconvolute ADCC escape from neutralizing antibody (nAb) escape, we identified individuals soon after infection with detectable ADCC responses, but no nAb responses. We evaluated the kinetics of ADCC and nAb responses, and viral escape, in five recently HIV-1-infected individuals. In one individual we detected viruses that escaped from ADCC responses but were sensitive to nAbs. In the remaining four participants, we did not find evidence of viral evolution exclusively associated with ADCC-mediating non-neutralizing Abs (nnAbs). However, in all individuals escape from nAbs was rapid, occurred at very low titers, and in three of five cases we found evidence of viral escape before detectable nAb responses. These data show that ADCC-mediating nnAbs can drive immune escape in early infection, but that nAbs were far more effective. This suggests that if ADCC responses have a protective role, their impact is limited after systemic virus dissemination.


Conflict of interest statement

The authors have declared that no competing interests exist.

Figures

Fig 1
Fig 1. Escape from ADCC and neutralizing antibody responses in CAP239.
(A) Highlighter amino acid plot comparing 61 single genome env sequences, generated from 10 time-points over eight months of infection, to the T/F sequence (top line). The two sites that were evolved prior to nAb responses, and occurred in multiple sequences, are shown as boxes: K97E (green box), and S481N (orange box); and the eight sites/combination sites that evolved after nAb responses, and occurred in multiple sequences, are as arrows (K97E, K106E, L278S, W456R, E462G, K463.02E, S481N, W456R K463.02E). (B) Neutralization titers (IC50) of longitudinal autologous plasma evaluated against pseudoviruses: CAP239 T/F env, and 10 CAP239 T/F with sites/combination sites which evolved after nAb responses developed. (C) ADCC antibody titers against infected targets cells in the Luciferase ADCC assay. Cells were infected with T/F virus, as well as the T/F virus with K97E or S481N incorporated. These viruses were used to infect CEM.NKRCCR5 as targets and utilized with donor PBMCs as effectors. WPI indicates weeks post infection. Points on ADCC and neutralisation plots indicate the mean of ≥three independent experiments.
Fig 2
Fig 2. Impact of ADCC and neutralization responses on evolutionary pathways in CD4-binding site regions of CAP239 viruses.
(A) A maximum-likelihood tree of the 61 CAP239 full-length env single genome sequences was constructed, and rooted on the T/F virus. Branches were colour-coded according to the time-point from which the sequence was sampled. Three distinct evolutionary pathways were observed following detection of nAbs. Arrows indicated sequence used to generate infectious molecular clones containing the env of the T/F (black) as well as six representative sequences from the three pathways were constructed (identified by arrows coloured according to pathway). Two of the clones (CAP239 13WPI-9C6 and CAP239 13WPI-9B2) were representative of 13 week viruses; while four viruses (CAP239 19WPI-7B2, CAP239 19WPI-7C2, CAP239 19WPI-7F2 and CAP239 19WPI-7E4) represented 19 week viruses. (B) Env-IMCs were tested against contemporaneous plasma was tested for ADCC activity. (C) Env-IMCs were tested against contemporaneous plasma for neutralization activity. Points on ADCC and neutralisation plots indicate the mean of ≥three independent experiments.
Fig 3
Fig 3. Models of the CAP239 gp120: effect of ADCC and neutralization escape mutations on Env structure.
Trimer models of CAP239 T/F and Envs from each of the three evolutionary pathways were constructed using Modeller [53] and the best scoring model was visualised using Chimera [54]. A single gp120 monomer from the trimer of the T/F or Envs from each pathway were used for further analysis. GlyProt [55] was used to add basic glycans (N276 in pathway two and three). (A) The contact surface was modelled onto the CAP239 T/F gp120 (grey) with any key residue surfaces shown in red. Structural landmarks (grey) and key residues in CAP239 viral evolution (black) are labelled on the CAP239 TF gp120. Changes characteristic of evolution are shown in (B) blue for pathway one (CAP239 19-7F4), (C) purple for pathway two (CAP239 19-7C2), and (D) red for pathway three (CAP239 19-7H2; pathway three).
Fig 4
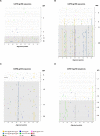
Fig 4. Highlighter amino acid plots showing viral evolution of the HIV-1 envelope in five CAPRISA 002 participants.
Full-length env sequences were generated over time for five CAPRISA 002 participants. In CAP45, 31 single genome sequences were obtained from five time-points over 1 year of infection (A); in CAP63, 84 single genome sequences were obtained from four time-points over six months of infection (B); in CAP88, 52 single genome sequences were obtained from five time-points over six months of infection (C); and lastly, in CAP210, 39 single genome sequences were obtained from six time-points over six months of infection (D). The presence of detectable nAbs is indicated by grey shading. The reference sequence for each participant is the respective T/F sequence.
Fig 5
Fig 5. Escape from both neutralization and ADCC responses in two CAPRISA 002 participants.
Neutralizing and ADCC responses were evaluated against wildtype and mutant viruses where putative ADCC or nAbs escape mutations were introduced into the autologous CAP45 or CAP210 T/F Env-IMCs. The impact of each mutation on sensitivity to autologous nAb and ADCC responses was then tested using longitudinal plasma. (A) Effect of the D462G mutation on neutralization and ADCC responses in CAP45; (B) Effect was A161V and V208I mutations on nAb and ADCC responses. Points on ADCC and neutralisation plots indicate the mean of ≥three independent experiments.
Fig 6
Fig 6. Divergence from T/F sequences in regions targeted by the initial autologous nAb responses in five CAPRISA 002 participants.
A total of 51–12842 consensus sequences were generated per time point (an average of 1493 consensus sequences per time point) using Illumina deep sequencing platform and the primer ID method. Average hamming distances, normalised to the nucleotide length of each amplicon, were calculated for sequences generated at each time-point (black line). The bubble size indicates the size of the viral population, scaled by viral load. The shaded region indicates the time from which the initial autologous antibody response was first detected (IC50). Hamming distances were adjusted that so deletions were calculated as one event.
Fig 7
Fig 7. Jensen-Shannon Divergence (DJS) plots of the region targeted by initial autologous nAb responses in five CAPRISA 002 participants.
DJS for each position at each time-point sequenced was calculated. White arrows indicate sites exhibiting high DJS prior to detectable nAbs: one site (position 397) in CAP63, two sites (161 and 208) in CAP210, and one site in CAP239 (365). Sites exhibiting raised DJS after the detection of nAbs are identified using blue arrows: three sites (positions 460–462) in CAP45, two sites (positions 343 and 350) in CAP88 and five sites (106, 278, 459, 463 and 463.02) in CAP239, which were identified as a second wave of sites which diverged later (blue arrows). The white dotted line indicates the time from which the initial autologous antibody response was first detected (Titers >1:50).

Similar articles

Cited by

References

    1. Tomaras GD, Plotkin SA. Complex immune correlates of protection in HIV-1 vaccine efficacy trials. Immunol Rev. 2017;275: 245–261. doi: 10.1111/imr.12514 - DOI - PMC - PubMed
    1. Haynes BF, Gilbert PB, McElrath MJ, Zolla-Pazner S, Tomaras GD, Alam SM, et al.. Immune-Correlates Analysis of an HIV-1 Vaccine Efficacy Trial. New England Journal of Medicine. 2012. pp. 1275–1286. doi: 10.1056/NEJMoa1113425 - DOI - PMC - PubMed
    1. Li SS, Gilbert PB, Tomaras GD, Kijak G, Ferrari G, Thomas R, et al.. FCGR2C polymorphisms associate with HIV-1 vaccine protection in RV144 trial. J Clin Invest. 2014;124: 3879–3890. doi: 10.1172/JCI75539 - DOI - PMC - PubMed
    1. Rolland M, Edlefsen PT, Larsen BB, Tovanabutra S, Sanders-Buell E, Hertz T, et al.. Increased HIV-1 vaccine efficacy against viruses with genetic signatures in Env V2 [Internet]. Nature. 2012. pp. 417–420. doi: 10.1038/nature11519 - DOI - PMC - PubMed
    1. Baum LL, Cassutt KJ, Knigge K, Khattri R, Margolick J, Rinaldo C, et al.. HIV-1 gp120-specific antibody-dependent cell-mediated cytotoxicity correlates with rate of disease progression. J Immunol. 1996;157: 2168–2173. - PubMed

Publication types