

Cell-morphodynamic phenotype classification with application to cancer metastasis using cell magnetorotation and machine-learning
- PMID: 34788313
- PMCID: PMC8598033
- DOI: 10.1371/journal.pone.0259462
Cell-morphodynamic phenotype classification with application to cancer metastasis using cell magnetorotation and machine-learning
Abstract
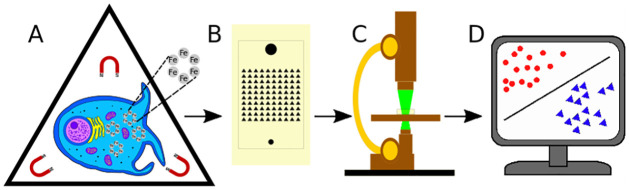
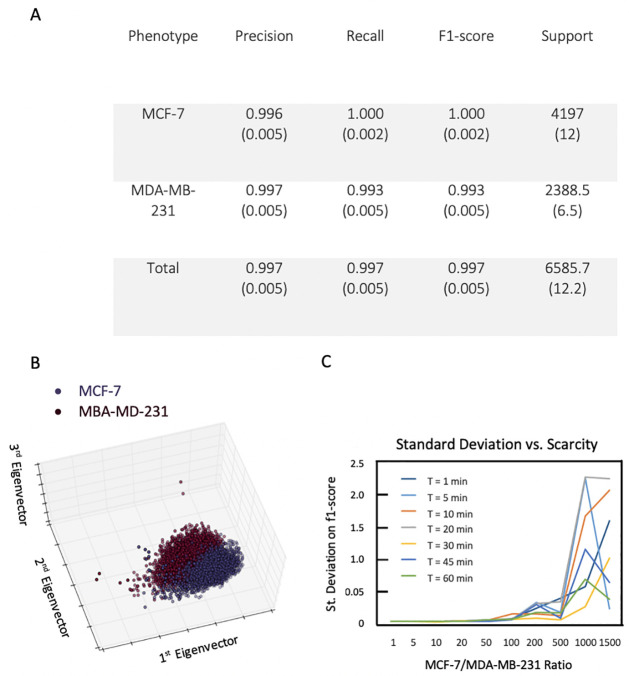
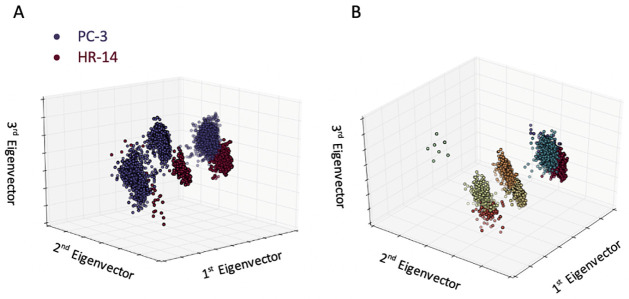
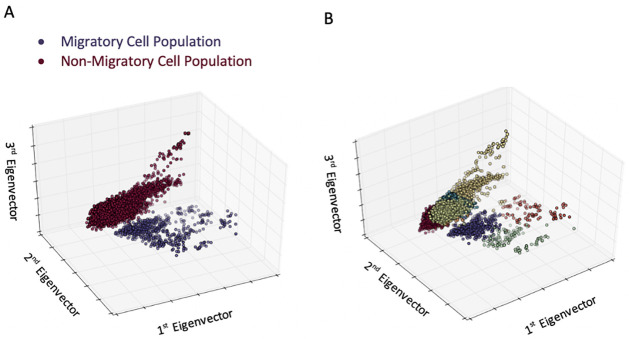
We define cell morphodynamics as the cell's time dependent morphology. It could be called the cell's shape shifting ability. To measure it we use a biomarker free, dynamic histology method, which is based on multiplexed Cell Magneto-Rotation and Machine Learning. We note that standard studies looking at cells immobilized on microscope slides cannot reveal their shape shifting, no more than pinned butterfly collections can reveal their flight patterns. Using cell magnetorotation, with the aid of cell embedded magnetic nanoparticles, our method allows each cell to move freely in 3 dimensions, with a rapid following of cell deformations in all 3-dimensions, so as to identify and classify a cell by its dynamic morphology. Using object recognition and machine learning algorithms, we continuously measure the real-time shape dynamics of each cell, where from we successfully resolve the inherent broad heterogeneity of the morphological phenotypes found in a given cancer cell population. In three illustrative experiments we have achieved clustering, differentiation, and identification of cells from (A) two distinct cell lines, (B) cells having gone through the epithelial-to-mesenchymal transition, and (C) cells differing only by their motility. This microfluidic method may enable a fast screening and identification of invasive cells, e.g., metastatic cancer cells, even in the absence of biomarkers, thus providing a rapid diagnostics and assessment protocol for effective personalized cancer therapy.
Conflict of interest statement
The authors have declared that no competing interests exist.
Figures
Similar articles
-
Machine learning reveals mesenchymal breast carcinoma cell adaptation in response to matrix stiffness.PLoS Comput Biol. 2021 Jul 23;17(7):e1009193. doi: 10.1371/journal.pcbi.1009193. eCollection 2021 Jul. PLoS Comput Biol. 2021. PMID: 34297718 Free PMC article.
-
A cell-to-patient machine learning transfer approach uncovers novel basal-like breast cancer prognostic markers amongst alternative splice variants.BMC Biol. 2021 Apr 12;19(1):70. doi: 10.1186/s12915-021-01002-7. BMC Biol. 2021. PMID: 33845831 Free PMC article.
-
Morphodynamics facilitate cancer cells to navigate 3D extracellular matrix.Sci Rep. 2021 Oct 14;11(1):20434. doi: 10.1038/s41598-021-99902-9. Sci Rep. 2021. PMID: 34650167 Free PMC article.
-
Hybrid epithelial/mesenchymal phenotypes promote metastasis and therapy resistance across carcinomas.Pharmacol Ther. 2019 Feb;194:161-184. doi: 10.1016/j.pharmthera.2018.09.007. Epub 2018 Sep 28. Pharmacol Ther. 2019. PMID: 30268772 Review.
-
Epithelial, mesenchymal and hybrid epithelial/mesenchymal phenotypes and their clinical relevance in cancer metastasis.Expert Rev Mol Med. 2017 Mar 21;19:e3. doi: 10.1017/erm.2017.6. Expert Rev Mol Med. 2017. PMID: 28322181 Review.
Cited by
-
Spatial topology of organelle is a new breast cancer cell classifier.iScience. 2023 Jun 28;26(7):107229. doi: 10.1016/j.isci.2023.107229. eCollection 2023 Jul 21. iScience. 2023. PMID: 37519903 Free PMC article.
-
Quantitative cell imaging approaches to metastatic state profiling.Front Cell Dev Biol. 2022 Oct 25;10:1048630. doi: 10.3389/fcell.2022.1048630. eCollection 2022. Front Cell Dev Biol. 2022. PMID: 36393865 Free PMC article. Review.
References
-
- Institute for Health Metrics and Evaluation (IHME). Findings from the Global Burden of Disease Study 2017. Seattle, WA: IHME, 2018.
Publication types
MeSH terms
Grants and funding
LinkOut - more resources
Full Text Sources
Other Literature Sources
