. 2022 Jan;9(3):e2103065.
doi: 10.1002/advs.202103065. Epub 2021 Nov 17.

Dysmyelination by Oligodendrocyte-Specific Ablation of Ninj2 Contributes to Depressive-Like Behaviors

Affiliations

Dysmyelination by Oligodendrocyte-Specific Ablation of Ninj2 Contributes to Depressive-Like Behaviors

Yuxia Sun et al. Adv Sci (Weinh). 2022 Jan.

Abstract

Depression is a mental disorder affecting more than 300 million people in the world. Abnormalities in white matter are associated with the development of depression. Here, the authors show that mice with oligodendrocyte-specific deletion of Nerve injury-induced protein 2 (Ninj2) exhibit depressive-like behaviors. Loss of Ninj2 in oligodendrocytes inhibits oligodendrocyte development and myelination, and impairs neuronal structure and activities. Ninj2 competitively inhibits TNFα/TNFR1 signaling pathway by directly binding to TNFR1 in oligodendrocytes. Loss of Ninj2 activates TNFα-induced necroptosis, and increases C-C Motif Chemokine Ligand 2 (Ccl2) production, which might mediate the signal transduction from oligodendrocyte to neurons. Inhibition of necroptosis by Nec-1s administration synchronously restores oligodendrocyte development, improves neuronal excitability, and alleviates depressive-like behaviors. This study thus illustrates the role of Ninj2 in the development of depression and myelination, reveals the relationship between oligodendrocytes and neurons, and provides a potential therapeutic target for depression.

Keywords: Ninj2; depression; necroptosis; oligodendrocytes.


Conflict of interest statement

The authors declare no conflict of interest.

Figures

Figure 1
Figure 1
Loss of Ninj2 in oligodendrocytes leads to depressive‐like behaviors. A,B) Tail suspension test (TST), force swimming test (FST), and sucrose preference test (SPT), were performed in Olig1cre/+;Ninj2fl/fl mice (cKO) (n = 6 mice/genotype) (A) or Cnpcre/+;Ninj2fl/fl mice (CcKO) (n = 5 mice/genotype) (B) and their littermate controls. C,D) Whole‐cell patch‐clamp recording was performed to show the representative traces and quantification of frequencies and amplitudes of mEPSCs or mIPSCs from prefrontal cortex pyramidal neurons (mEPSCs: n = 31 neurons for WT mice, n = 25 neurons for cKO mice; mIPSCs: n = 21 neurons for WT mice, n = 23 neurons for cKO mice; from six mice/genotype) (C), or hippocampal CA1 pyramidal neurons (mEPSCs: n = 23 neurons for WT mice, n = 24 neurons for cKO mice; mIPSCs: n = 21 neurons for WT mice, n = 22 neurons for cKO mice; from six mice/genotype) (D). E–H) WT and cKO mice were subjected to Golgi staining. Sholl analysis of dendritic complexity in hippocampal CA1 pyramidal neurons (n = 28 neurons from three mice for each group) was shown in (E,F), Apical distal spine numbers of the pyramidal neurons in hippocampal CA1 regions (n = 42 dendritic segments for WT mice, n = 49 dendritic segments for cKO mice, from three mice/genotype) were shown in (G,H), Scale bars = 20 µm. For all panels, mice were subjected to experiments at P60. All the quantification data are presented as mean ± SEM, p‐values are calculated using two‐tailed unpaired Student's t‐test (A–D,H), or two‐way ANOVA with Tukey's multiple comparisons test (F), F (interaction [F (19, 1080) = 2.014, p = 0.0061]),*p < 0.05, **p < 0.01, ***p < 0.001, ****p < 0.0001.
Figure 2
Figure 2
Loss of Ninj2 in oligodendrocytes inhibits myelination. A,B) Immunofluorescent staining against NEUN, GFAP, Iba1, MBP, and Olig2 in the prefrontal cortex (A) or hippocampal CA1 (B) sections from WT or Olig1cre/+;Ninj2fl/fl (cKO) mice. The quantification of NEUN+ GFAP+, Iba1+, and Olig2+ cell numbers, and the relative MBP intensity, were shown in the right panel. Scale bar = 100 µm (A), 250 µm (B). n = 3 mice/genotype. C) Electron microscopic examination of the optic nerve at P14 and P21 and corpus callosum at P21 and P60 from WT or cKO mice. Scale bar = 2 µm. n = 3 mice/genotype. D) Electron microscopic examination of the corpus callosum at P60 from WT or Cnpcre/+;Ninj2fl/fl (CcKO) mice. The quantified myelinated axon numbers were shown on the right panel. Scale bar = 2 µm. n = 3 mice/genotype. All the quantification data are presented as mean ± SEM, p‐values are calculated using two‐tailed unpaired Student's t‐test, *p < 0.05, **p < 0.01, ***p < 0.001, ****p < 0.0001.
Figure 3
Figure 3
Ablation of Ninj2 in oligodendrocytes induces necroptosis. A) Immunofluorescent staining against Olig2, TUNEL, and cleaved‐caspase3 were performed in the corpus callosum sections from WT or Olig1cre/+;Ninj2fl/fl (cKO) mice at P7, P14, and P30, the number of the Olig2+, TUNEL+ cells, or the percentage of cleaved‐caspase3+ cells in Olig2+ cells, were quantified and shown on the right panel. Scale bar = 50 µm. n = 3 mice/genotype. B) Western blotting analyses against p‐MLKL, MLKL, and cleaved‐caspase3 on the corpus callosum or spinal cord samples from WT or cKO mice at P7. Densitometric quantification of p‐MLKL/MLKL or cleaved‐caspase3/GAPDH ratio was shown at the bottom panel. n = 6 mice/genotype. C) Immunofluorescent staining against MBP, BrdU, TUNEL, and cleaved‐caspase3 in cultured oligodendrocytes from WT or cKO mice, the percentages of MBP+, BrdU+, TUNEL+, and cleaved‐caspase3+ cells were shown at the bottom panel. Scale bar = 50 µm. n = 3 independent experiments. D) Western blot assays with the indicated antibodies in oligodendrocytes from WT or cKO mice. Densitometric quantification of p‐MLKL/MLKL or MBP, CNP, MAG, cleaved‐caspase3/GAPDH ratio was shown at the bottom panel. n = 3 independent experiments. E–G) Oligodendrocytes from WT or cKO mice were treated with vehicle, Nec‐1s (1 µm) or GSK‐872 (0.25 µM) for 48 h respectively, and then subjected to western blot analyses against the indicated proteins (E) or immunofluorescent staining against TUNEL (F) and MBP (G). Densitometric quantification of p‐MLKL/MLKL ratio was shown at the right panel of (E). The percentages of the TUNEL+ or MBP+ in total DAPI+ cells were quantified and shown on the right panels of (F) and (G). Scale bar = 50 µm. n = 3 independent experiments for each group. All the quantification data are presented as mean ± SEM, p‐values are calculated using two‐tailed unpaired Student's t‐test (A–D), or two‐way ANOVA with Tukey's multiple comparisons test (E–G), E (Nec‐1s: interaction [F 1,8 = 10.35, p = 0.0123]; GSK‐872: interaction [F 1,8 = 5.37, p = 0.0491]), F (Nec‐1s: interaction [F 1,8 = 8.443, p = 0.0197], GSK‐872: interaction [F 1,8 = 7.957, p = 0.0225]), G (Nec‐1s: interaction [F 1,8 = 5.520, p = 0.0467], GSK‐872: interaction [F 1,8 = 7.913, p = 0.0227]), *p < 0.05, **p < 0.01, ***p < 0.001, ****p < 0.0001.
Figure 4
Figure 4
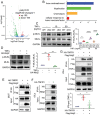
Ninj2 inhibits TNFα‐induced necroptosis through interaction with TNFR1. A) Volcano diagram showing the genes whose expression level was significantly changed in the oligodendrocytes from Olig1cre/+;Ninj2fl/fl (cKO) mice. B) Gene Ontology (GO) analysis showing the biological processes in which the significantly changed genes involved. C,D) Western blotting analyses against p‐MLKL, MLKL in the oligodendrocytes from WT or cKO mice that treated with vehicle, 10 or 50 ng mL−1 of TNFα for 48 h, respectively (C), or in oligodendrocytes transfected with empty or Ninj2‐overexpressing vectors, and then treated with 100 ng mL−1 of TNFα for 48 h (D). Densitometric quantification of p‐MLKL/MLKL ratio from at least three independent assays is shown at the right panel of (C) and (D). E) Co‐immunoprecipitation analysis in HEK293T cells that transfected with Ninj2 and TNFR1‐overexpressing vectors, alone or in combination as indicated. n = 3 independent experiments. F) Co‐immunoprecipitation analysis in rat oligodendrocytes that transfected with empty or TNFR1‐overexpressing vectors. n = 3 independent experiments. G) Co‐immunoprecipitation analysis in rat oligodendrocytes that transfected with empty, Ninj2 or TNFR1‐overexpressing vectors, alone or in combination as indicated. Densitometric quantification of IP/Input (TNFα) ratio from at least three independent assays was shown at the bottom panel. All the quantification data are presented as mean ± SEM, p‐values are calculated using two‐way ANOVA (C) or one‐way ANOVA with Tukey's multiple comparisons test (D,G), C (interaction [F 2,12 = 26.56, p < 0.0001]), D (interaction [F 2,6 = 27.31, p = 0.001]), G (interaction [F 2,6 = 10.91, p = 0.01]), *p < 0.05, **p < 0.01, ****p < 0.0001.
Figure 5
Figure 5
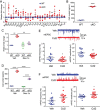
Ccl2 release from necroptotic oligodendrocytes changes the activities of primary pyramidal neurons. A) Expression of inflammatory cytokines in oligodendrocytes derived from WT or Olig1cre/+;Ninj2fl/fl (cKO) mice. n = 3 independent experiments. B) Ccl2 levels in oligodendrocytes cell culture supernatant derived from WT or cKO mice was determined by ELISA. n = 4 independent experiments. C) Ccl2 mRNA levels in primary oligodendrocytes from WT or cKO mice treated with vehicle or Nec‐1s (1 µm). n = 3 independent experiments. D) Ccl2 levels in oligodendrocytes cell culture supernatant derived from WT or Olig1cre/+;Ninj2fl/fl (cKO) mice treated with vehicle or Nec‐1s (1 µm) was determined by ELISA. n = 3 independent experiments. E,F) Whole‐cell patch‐clamp recording was performed to show the representative traces and quantification of frequencies and amplitudes of mEPSCs or mIPSCs from primary culture pyramidal neurons treated with vehicle or Ccl2 (100 ng mL−1) for 48 h. (n = 16 neurons for each group). All the quantification data are presented as mean ± SEM, p‐values are calculated using two‐tailed unpaired Student's t‐test (A,B,E,F) or two‐way ANOVA with Tukey's multiple comparisons test (C,D), C (interaction [F 1,8 = 13.76, p = 0.006]), D (interaction [F 1,8 = 97.49, p < 0.0001]), *p < 0.05, **p < 0.01, ***p < 0.001, ****p < 0.0001.
Figure 6
Figure 6
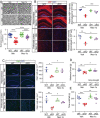
Nec‐1s treatment restores oligodendrocyte development and myelination. WT or Olig1cre/+;Ninj2fl/fl (cKO) mice received i.p. injection with vehicle or Nec‐1s (10 mg kg−1) from P60 to P90, and then subjected to the following experiments. A) Electron microscopic examination was performed in the corpus callosum, the myelinated axon numbers were quantified and shown on the bottom panel. Scale bar = 2 µm. n = 3 mice/group. B,C) Immunofluorescent staining against MBP and Olig2 was performed in the hippocampus CA1 and prefrontal cortex sections from WT and cKO mice. The quantification of the relative MBP intensity or Olig2+ cells was shown in the right panel. Scale bar = hippocampus CA1, 250 µm, prefrontal cortex, 100 µm. n = 3 mice/group. D,E) Forelimb grip strength test (D) and rotarod test (E) were performed, n = 6 mice/group. All the quantification data are presented as mean ± SEM, p‐values are calculated using two‐way ANOVA with Tukey's multiple comparisons test, A (interaction [F 1,58 = 18.81, p < 0.0001]), B (MBP CA1: interaction [F 1,8 = 16.50, p = 0.0036]; MBP PFC: interaction [F 1,8 = 11.45, p = 0.0096]), C (Olig2 CA1: interaction [F 1,8 = 8.327, p = 0.0203], Olig2 PFC: interaction [F 1,8 = 5.692, p = 0.0441]), D (interaction [F 1,20 = 6.294, p = 0.0208), E (interaction [F 1,20 = 4.685, p = 0.0427]), *p < 0.05, **p < 0.01, ***p < 0.001, ****p < 0.0001.
Figure 7
Figure 7
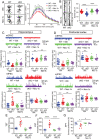
Nec‐1s treatment alleviates depressive‐like behaviors. WT or Olig1cre/+;Ninj2fl/fl (cKO) mice received i.p. injection with vehicle or Nec‐1s (10 mg kg−1) from P60 to P90, and then subjected to the following experiments. A,B) Mice were subjected to Golgi staining. Sholl analysis of dendritic complexity in hippocampal CA1 pyramidal neurons (n = 25 neurons for WT+Veh, n = 29 neurons for cKO+Veh, n = 32 neurons for WT+Nec‐1s, n = 30 neurons for cKO+Nec‐1s, from three mice/group) was shown in (A) (* indicated the significance of comparison between WT+Veh and cKO+Veh, # indicated the significance of comparison between cKO+Veh and cKO+Nec‐1s). Apical distal spine numbers of the pyramidal neurons in hippocampal CA1 regions (n = 41 dendritic segments for WT+Veh, n = 45 dendritic segments for cKO+Veh, n = 40 dendritic segments for WT+Nec‐1s, n = 41 dendritic segments for cKO+Nec‐1s, from 3 mice/group) were shown in (B). C,D) Whole‐cell patch‐clamp recording was performed to show the representative traces and quantification of frequencies and amplitudes of mEPSCs or mIPSCs from hippocampal CA1 pyramidal neurons (mEPSC: n = 15 neurons for WT+Veh, n = 17 neurons for cKO+Veh, n = 18 neurons for WT+Nec‐1s, n = 17 neurons for cKO+Nec‐1s; mIPSC: n = 17 neurons for WT+Veh, n = 17 neurons for cKO+Veh, n = 18 neurons for WT+Nec‐1s, n = 18 neurons for cKO+Nec‐1s; from 5 mice/group) (C), or prefrontal cortex pyramidal neurons (mEPSC: n = 21 neurons for WT+Veh, n = 21 neurons for cKO+Veh, n = 21 neurons for WT+Nec‐1s, n = 15 neurons for cKO+Nec‐1s; mIPSC: n = 19 neurons for WT+Veh, n = 20 neurons for cKO+Veh, n = 17 neurons for WT+Nec‐1s, n = 16 neurons for cKO+Nec‐1s; from 5 mice/group) (D). E–G) Tail suspension test (TST), forced swimming test (FST), and sucrose preference test (SPT), were performed to evaluate their depressive‐like behaviors (n = 6 mice/group). All the quantification data are presented as mean ± SEM, p‐values are calculated using two‐way ANOVA with Tukey's multiple comparisons test, A (interaction [F 57,2238 = 1.683, p = 0.0012]), B (interaction [F 1,163 = 35.64, p < 0.0001]), C (mEPSC frequency: interaction [F 1,63 = 4.438, p = 0.0391]; mEPSC amplitude: interaction [F 1,63 = 4.777, p = 0.0326]; mIPSC frequency: interaction [F 1,66 = 9.326, p = 0.0033]; mIPSC amplitude: interaction [F 1,66 = 0.9254, p = 0.3396]), D (mEPSC frequency: interaction [F 1,74 = 11.25, p = 0.0013]; mEPSC amplitude: interaction [F 1,74 = 1.488, p = 0.2264]; mIPSC frequency: interaction [F 1,68 = 4.863, p = 0.0308]; mIPSC amplitude: interaction [F 1,68 = 0.2138, p = 0.6453]). E (interaction [F 1,20 = 7.317, p = 0.0136]), F (interaction [F 1,20 = 16.71, p = 0.0006]), G (interaction [F 1,20 = 4.841, p = 0.0397]), *p < 0.05, **p < 0.01, ***p < 0.001, ****p < 0.0001.

Similar articles

Cited by

References

    1. Zhou B., Zhu Z., Ransom B. R., Tong X., Mol. Psychiatry 2021, 26, 103. - PMC - PubMed
    1. Malhi G. S., Mann J. J., Lancet 2018, 392, 2299. - PubMed
    1. a) Shen Z. L., Cheng Y. Q., Yang S. R., Dai N., Ye J., Liu X. Y., Lu J., Li N., Liu F., Lu Y., Sun X. J., Xu X. F., Neuroimage: Clin. 2016, 12, 492; - PMC - PubMed
    2. b) Ransome M. I., Renoir T., Hannan A. J., Neural Plast. 2012, 2012, 874387; - PMC - PubMed
    3. c) Zhuo C. J., Zhu J. J., Wang C. L., Qu H. R., Ma X. L., Qin W., Brain Imaging Behav. 2017, 11, 1678. - PMC - PubMed
    1. Baumann N., Pham‐Dinh D., Physiol. Rev. 2001, 81, 871. - PubMed
    1. Nave K. A., Edgar J., Griffiths I. R., Jansen K., Kassmann C. M., Klugmann M., Lappe‐Siefke C., Meyer‐zu‐Horste G., Mobius W., Sereda M. H., Werner H., J. Neuroimmunol. 2006, 178, 36.

Publication types

Substances