. 2021 Nov 16;12(1):6622.
doi: 10.1038/s41467-021-26824-5.

mTOR-mediated phosphorylation of VAMP8 and SCFD1 regulates autophagosome maturation

Affiliations

mTOR-mediated phosphorylation of VAMP8 and SCFD1 regulates autophagosome maturation

Hong Huang et al. Nat Commun. .

Abstract

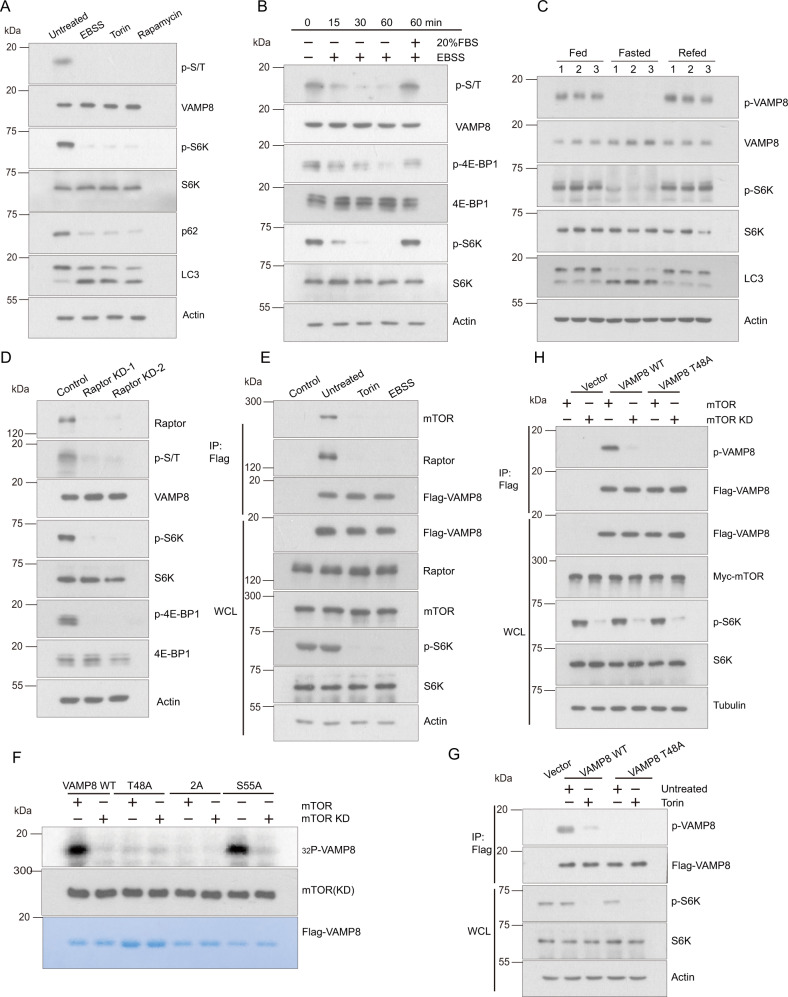
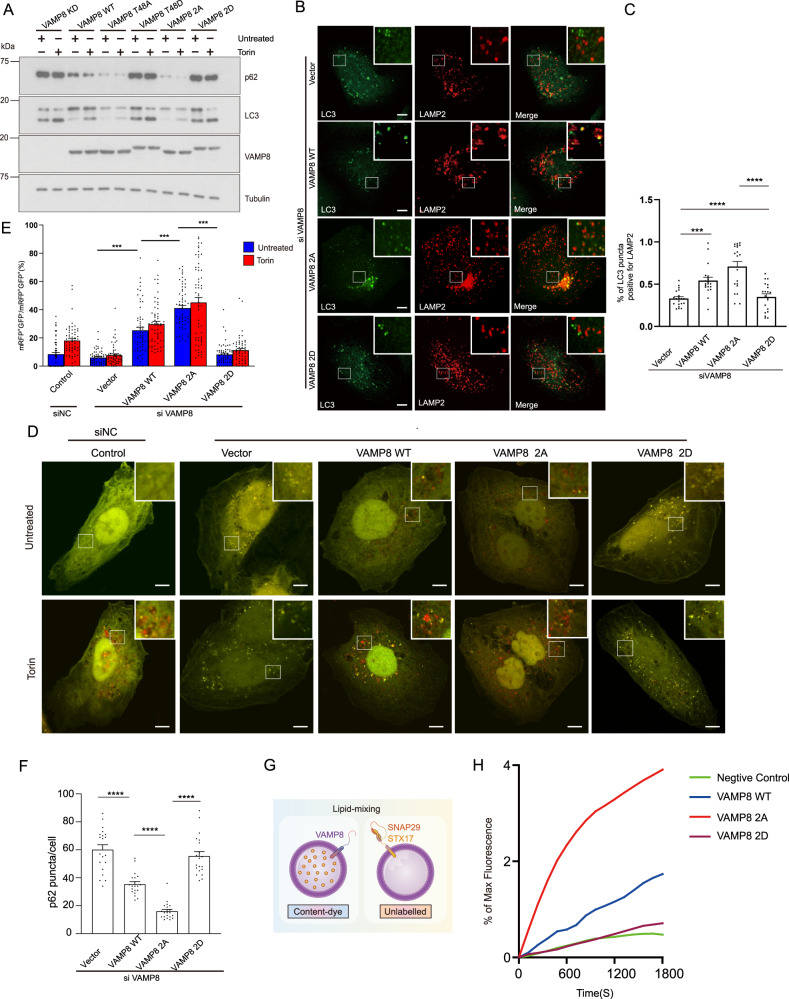
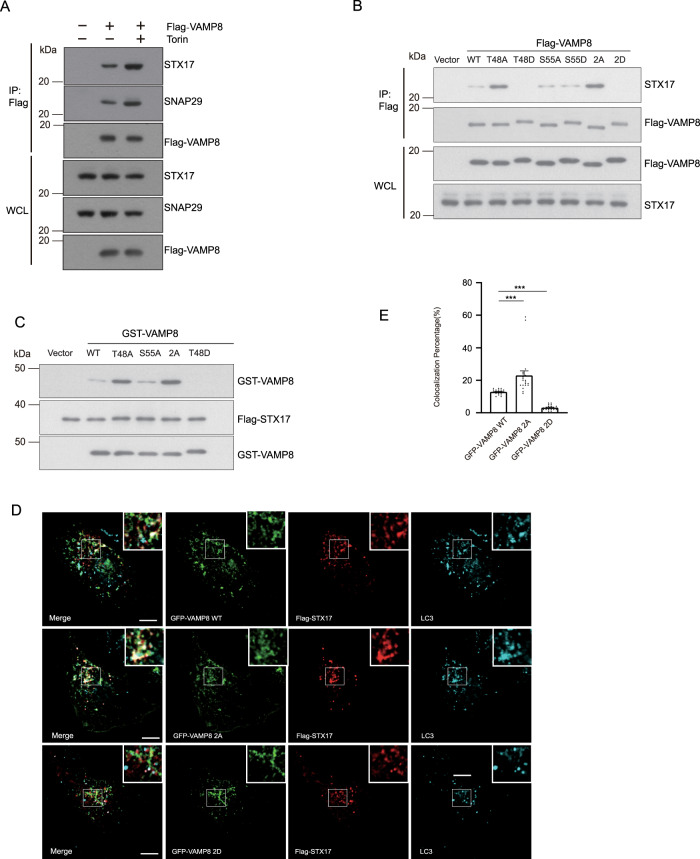
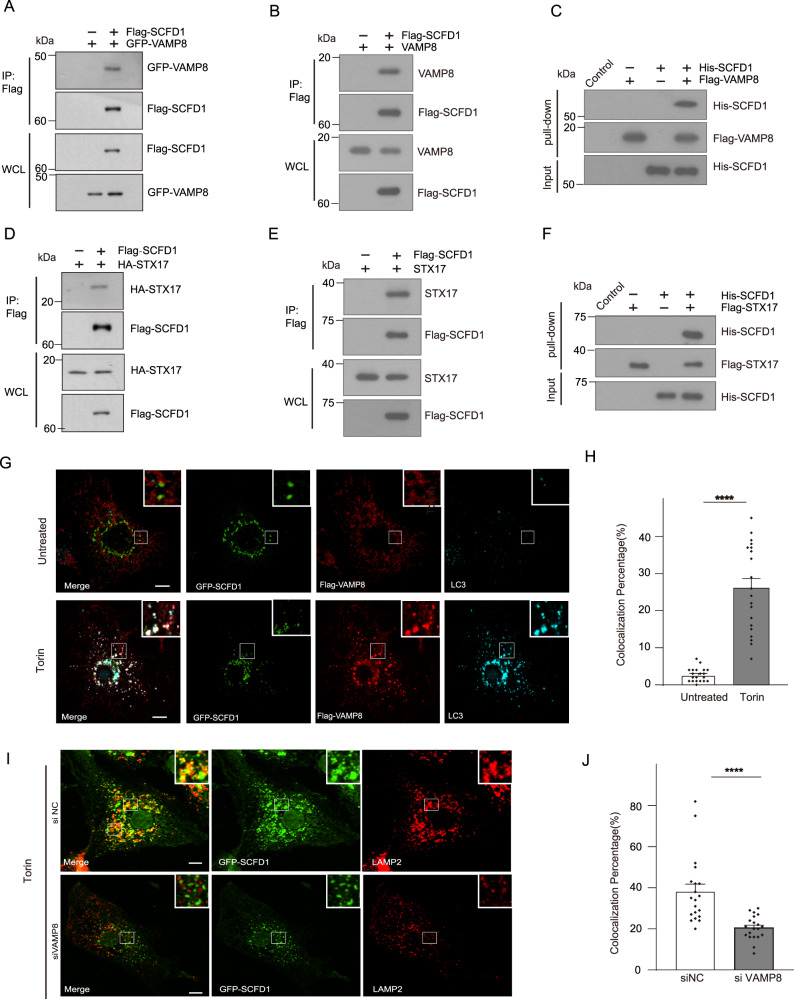
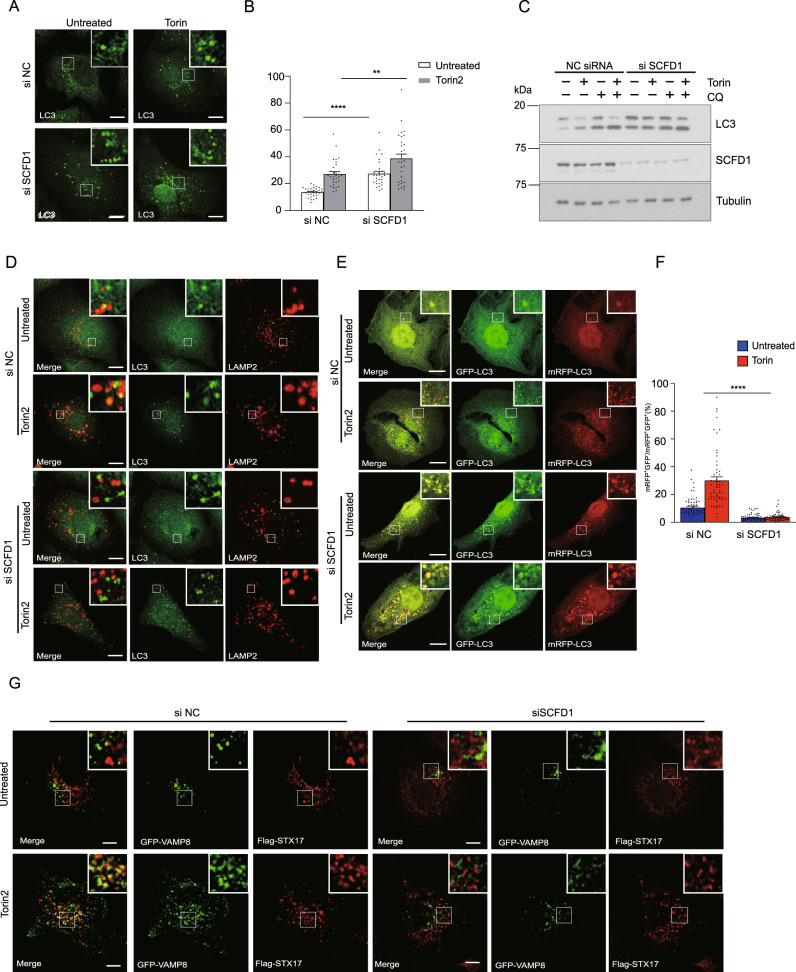
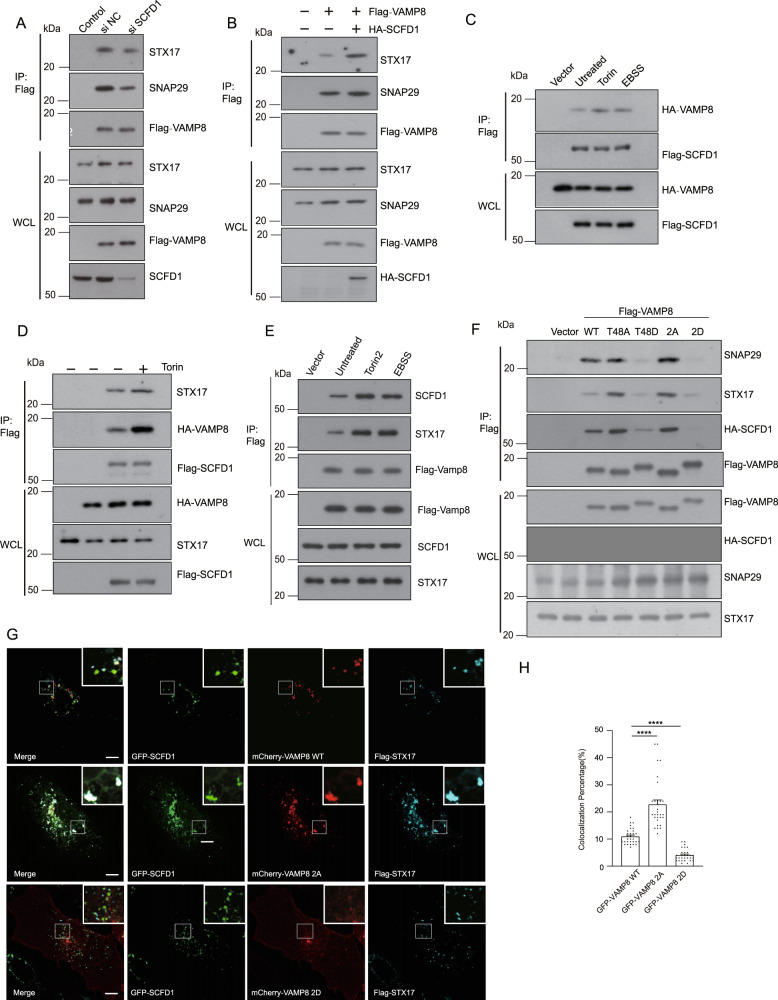
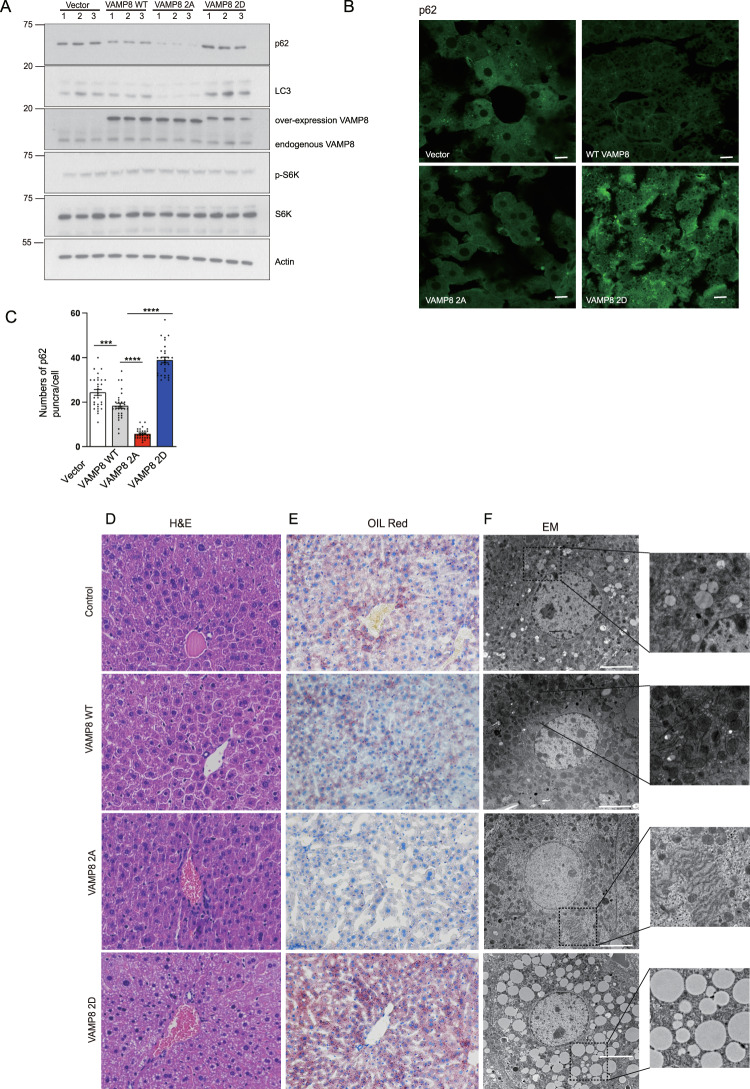
The mammalian target of rapamycin (mTORC1) has been shown to regulate autophagy at different steps. However, how mTORC1 regulates the N-ethylmaleimide-sensitive protein receptor (SNARE) complex remains elusive. Here we show that mTORC1 inhibits formation of the SNARE complex (STX17-SNAP29-VAMP8) by phosphorylating VAMP8, thereby blocking autophagosome-lysosome fusion. A VAMP8 phosphorylation mimic mutant is unable to promote autophagosome-lysosome fusion in vitro. Furthermore, we identify SCFD1, a Sec1/Munc18-like protein, that localizes to the autolysosome and is required for SNARE complex formation and autophagosome-lysosome fusion. VAMP8 promotes SCFD1 recruitment to autolysosomes when dephosphorylated. Consistently, phosphorylated VAMP8 or SCFD1 depletion inhibits autophagosome-lysosome fusion, and expression of phosphomimic VAMP8 leads to increased lipid droplet accumulation when expressed in mouse liver. Thus, our study supports that mTORC1-mediated phosphorylation of VAMP8 blocks SCFD1 recruitment, thereby inhibiting STX17-SNAP29-VAMP8 complex formation and autophagosome-lysosome fusion.


Conflict of interest statement

The authors declare no competing interests.

Figures

Fig. 1
Fig. 1. mTORC1 phosphorylates VAMP8 at T48.
A The extent of VAMP8 phosphorylation decreased upon inhibition of mTORC1. Protein lysates were prepared from HEK293T cells cultured in rich medium (untreated), EBSS medium, or that treated with Torin1 or rapamycin. Phosphorylated VAMP8 was blotted using antibodies against anti-phospho-Ser/Thr. Actin, LC3, p62, S6K, and p-S6K were detected by the indicated endogenous antibodies. B Nutrient-stress-induced VAMP8 dephosphorylation in a time-dependent manner. HEK293T cells were stimulated with EBSS for 15, 30, or 60 min or cultured with complete medium for 2 h after 1 h starvation. The VAMP8 phosphorylation level was detected using anti-phospho-Ser/Thr antibodies. 4EBP1, p4EBP1, S6K, pS6K were detected by the indicated endogenous antibodies. C Fasting decreased VAMP8 phosphorylation in mice liver. Mice were fed with normal diet (Fed), fasted, or refed after fasting. Western blot was employed to analyze the indicated protein levels. D Raptor knockdown inhibits VAMP8 phosphorylation. Raptor expression was inhibited by transfection of HEK293T cells with anti-Raptor siRNA. VAMP8 phosphorylation level was detected by western blot. E mTORC1 associates with VAMP8 in a nutrient-depended manner. HEK293T cells were transfected Flag-VAMP8, and the interaction of Flag-VAMP8 and mTORC1/Raptor was analyzed by immunoprecipitation under full medium or EBSS/Torin treatment. The mTOR/Raptor level was analyzed by anti-mTOR/Raptor antibody. F mTORC1 phosphorylates VAMP8 T48 in vitro. Flag-VAMP8WT/VAMP8T48A/VAMP82A/VAMP8S55A recombinant protein was purified from E. coli and incubated with purified mTORC1 or an mTORD2357E (Kinase Dead) mutant. The phosphorylation level was detected by γ-32P-ATP autoradiography. G The specificity of the antibody for the T48-phosphorylated form of VAMP8. Flag-VAMP8WT/VAMP8T48A proteins were pulled down using Flag beads and incubated with purified mTORC1 or mTORD2357E. The VAMP8 phosphorylation level was detected with anti-phospho-VAMP8(T48) antibodies. H Vector control or Flag-VAMP8WT/VAMP8T48A was co-expressed with either Myc-tagged mTORC1 or mTORD2357E in HEK293T cells. Twenty-four hours after transfection, Flag-tagged proteins were purified by Flag beads and the VAMP8 phosphorylation level was detected by anti-phospho-VAMP8(T48) antibodies.
Fig. 2
Fig. 2. VAMP8 phosphorylation inhibits autophagosome-lysosome fusion.
A VAMP8 phosphorylation blocks autophagic flux. VAMP8 deficient U2OS cells reconstituted with the VAMP8WT, VAMP8T48A, VAMP8T48D, VAMP82A, or VAMP82D proteins. Cells were cultured in full medium, with or without Torin treatment. LC3 and p62 levels were detected by western blot. B VAMP8 phosphorylation impairs LC3-LAMP2 localization. VAMP8-deficient, Torin-treated U2OS cells complemented with VAMP8WT, VAMP82A, or VAMP82D proteins, were stained with anti-LC3/LAMP2 antibodies and analyzed by immunofluorescence microscopy. Scale bar 5 μm. C Quantification of LC3- LAMP2 co-localization in B. Statistical significance was assessed by comparing different VAMP8 variants. One-way ANOVA (Values are shown as means ± SEM. n = 20., ***p < 0.001., ****p < 0.0001). D mRFP-GFP-LC3 assay in U2OS cells. mRFP-GFP-LC3 was expressed in U2OS cells (control siRNA, VAMP8 KD/rescued by vector, VAMP8WT, VAMP82A, or VAMP82D) and analyzed by confocal microscopy. Cells were cultured in full medium with or without Torin treatment. Scale bar 5 µm. E Quantitative analysis of the relative mRFP+-GFP--LC3 puncta, as indicators of autophagosome maturation. One-way ANOVA (Data are shown as the mean ± SEM. ****p < 0.0001., n = 60). F VAMP8 phosphorylation blocks p62 degradation. Quantitative analysis of p62 immunofluorescence in VAMP8-deficient, Torin-treated U2OS cells complemented with VAMP8WT, VAMP82A, or VAMP82D proteins. For quantification, the number of p62 puncta per cells were counted. One-way ANOVA (Data are shown as the mean ± SEM. ****p < 0.0001, n = 20). G Schematic for the experimental procedures used in the reconstituted fusion reactions. Liposomes were reconstituted with the indicated SNAREs to mimic autophagosome-lysosome fusion in vitro. H Fusion of the reconstituted proteoliposomes with phospho-VAMP8 blocks SNARE-dependent membrane fusion in vitro. Lipid mixing of the reconstituted liposome fusion reactions containing wild-type (WT) t-SNAREs (STX17-SNAP29) and WT VAMP8 or the indicated VAMP8 variants. t-SNARE (5 μm) and v-SNARE (1.5 μm) were added in each fusion reaction system. The fusion reactions were measured using NBD-fluorescence-based lipid mixing assays. VAMP8 CD (20 µM) was added at the beginning of the preincubation as a negative control. Fusion data are presented as a percentage of the maximum fluorescence change.
Fig. 3
Fig. 3. VAMP8 phosphorylation impairs SNARE complex formation.
A Flag-Trap assays testing Flag-VAMP8 precipitation of endogenous STX17 and SNAP29 in Torin-treated or untreated control cells. Cell lysates from HEK293T cells transfected with Flag-VAMP8 were immunoprecipitated by Flag-beads with or without Torin treatment. STX17 and SNAP29 were detected by anti-STX17/SNAP29 antibody. B SNARE complex formation was clearly impeded upon disruption of mTORC1-mediated VAMP8 phosphorylation based on a single (T48D) mutation or a double (T48D, S55D) mutation. Flag-VAMP8WT or VAMP8 variants (VAMP8T48A, VAMP8T48D, VAMP8S55A, VAMP8S55D, VAMP82A, or VAMP82D) were transfected into HEK293T cells. The interactions between transfected Flag-tagged proteins and endogenous STX17 were visualized by Flag co-immunoprecipitation and western blotting. C In vitro GST pull-down analysis using GST, GST-Tagged VAMP8WT, or the indicated GST-tagged VAMP8 variants, and Flag-STX17 recombinant proteins, followed by western blotting. D Markedly enhanced Flag-VAMP82A overlap with GFP-STX17 and endogenous LC3 compared with Flag-VAMP8WT. Immunofluorescence of U2OS cells expressing GFP-STX17 and Flag- VAMP8WT, VAMP82A, or VAMP82D variant proteins. Scale bar, 10 µm. E Quantification for E. One-way ANOVA (Data are shown as the mean ± SEM. ***p < 0.001, n = 20).
Fig. 4
Fig. 4. SCFD1 is an autophagic SNARE complex regulator.
A Flag-Trap assays showing the interaction between SCFD1 and VAMP8 upon co-immunoprecipitation (co-IP) using HEK293T cells expressing Flag-SCFD1 and GFP-VAMP8. B Robust interaction between endogenous VAMP8 and Flag-SCFD1. Flag-tagged SCFD1 was transfected into HEK293T cells, Flag-beads were used to pull-down Flag-SCFD1, and VAMP8 was detected by anti-VAMP8 antibody. C Clear signals for Flag-VAMP8 were detected in pull-down analysis of recombinant His-SCFD1 and Flag-VAMP8. D Interaction between transfected Flag-tagged SCFD1 and HA-STX17, observed by Flag co-IP assay. E Robust interaction between Flag-tagged SCFD1 with endogenous STX17, observed in a co-IP assay. STX17 was detected by anti-STX17 antibody. F In vitro pull-down of purified recombinant Flag-STX17 with His-tagged SCFD1, showing the direct interaction between STX17 and SCFD1. G Immunofluorescence under confocal microscopy revealed the colocalization of GFP-SCFD1 with Flag-VAMP8 and endogenous LC3 in U2OS cells under Torin stimulation. Scale bar, 5 μm. H Quantification for Figure G. One-way ANOVA (Data are shown as the mean ± SEM. ****p < 0.0001, n = 20). I The extent of SCFD1/LAMP1 overlap was reduced upon siRNA-mediated knockdown of VAMP8. Immunofluorescence of endogenous LAMP1 and GFP-SCFD1 was observed in U2OS cells with the indicated siRNAs, with Torin treatment. Scale bar, 5 μm. J Quantification for I. One-way ANOVA (Data are shown as the mean ± SEM. ****p < 0.0001, n = 20).
Fig. 5
Fig. 5. SCFD1 regulates autophagosome-lysosome fusion.
A The number of LC3 puncta clearly increased upon SCFD1 knockdown. U2OS cells were transfected with indicated the siRNAs. Cells were cultured in full medium stimulated with Torin. LC3 puncta were detected using an LC3 antibody and observed via confocal microscopy. Scale bar, 10 μm. B Quantification of LC3 puncta per cell. One-way ANOVA (Data are shown as the mean ± SEM. **p < 0.01., ****p < 0.0001, n = 30). C SCFD1 knockdown blocks autophagy flux. U2OS cells transfected with either siSCFD1 or control siRNAs were incubated with full medium, full medium with Torin, or full medium with Torin and chloroquine (CQ). The LC3 was detected by western blotting. D The extent of LC3/LAMP2 overlap was reduced upon siRNA-mediated knockdown of SCFD1. Immunofluorescence of endogenous LC3 and Lamp2 was observed in U2OS cells with the indicated siRNAs, with or without Torin treatment. Scale bar, 10 μm. E SCFD1 depletion results in autophagosome accumulation. mRFP-GFP-LC3 assays performed in U2OS cells transfected with the indicated siRNAs, with or without Torin1 stimulation. Scale bar, 10 µm. F Quantification of data from part G. The ratio of GFP negative mRFP positive LC3 puncta versus both GFP and mRFP positive LC3 puncta. One-way ANOVA (Data are shown as the mean ± SEM. ****p < 0.0001, n = 58). G Localization of VAMP8 and STX17 is dependent on SCFD1. Immunofluorescence of U2OS cells expressing GFP-VAMP8 and Flag-STX17, transfected with indicated siRNAs, treated with or without Torin1. Scale bar, 5 µm. No overlap between STX17 and VAMP8 was detected upon siRNA-mediated knockdown of SCFD1.
Fig. 6
Fig. 6. mTORC1 regulates the SCFD1-SNARE interaction.
A Co-immunoprecipitation (co-IP) assays revealed that STX17-SNAP29-VAMP8 SNARE complex formation was decreased upon siRNA-mediated knockdown of SCFD1. HEK293T cells expressing Flag-VAMP8 were transfected with control siRNA or siSCFD1. STX17, SNAP29, and SCFD1 were detected by western blotting. B Robust enhancement of STX17-SNAP29-VAMP8 SNARE complex formation was detected upon overexpression of Flag-SCFD1 in HEK 293T cells. Flag-tagged VAMP8 was co-expressed with or without HA-SCFD1 after Flag co-IP; STX17 and SNAP29 were detected by western blotting. C Suppression of mTOR activation by Torin or EBSS treatment; the interaction between Flag-SCFD1 and HA-VAMP8 was increased. HEK293T cells were transfected with Flag-SCFD1 and HA-Vamp8. At 24 h post-transfection, cells were incubated with full medium, full medium with Torin, or starvation medium, followed by observation of the SCFD-VAMP8 interaction by Flag-immunoprecipitation. Co-IP assays revealed that the interaction of Flag-SCFD1 and HA-Vamp8/STX17 was robustly increased upon inhibition of mTOR. D The presence of mTOR inhibited the interaction between Flag-SCFD1 and GFP-VAMP8. Flag-SCFD1 and GFP-VAMP8 were co-expressed with Myc-tagged mTORWT in HEK293T cells. Co-IP was performed using Flag beads. E Stimulated autophagy by Torin or EBSS treatment; the interaction between Flag-VAMP8 and endogenous STX17/SCFD1 was increased. HEK293T cells were transfected with Flag-VAMP8. Co-IP assays revealed that the interaction of Flag-VAMP8 and STX17/SCFD1 was robustly increased upon inhibition of mTOR. F VAMP8 mutant variants mimicking mTOR phosphorylation (VAMP8T48D/ VAMP82D) lost their capacity to interact with STX17/SNAP29/SCFD1. Individual VAMP8 mutations mimicking mTOR-mediated phosphorylation (VAMP8T48D/ VAMP82D) or dephosphorylation (VAMP8T48A, VAMP82A) were co-expressed with HA-SCFD1 to analyze their interaction(s) with STX17, SNAP29, and/or SCFD1. The STX17 and SNAP29 levels were detected by anti-STX17/SNAP29 antibody. G Colocalization of VAMP82A and SCFD1 was increased compared with VAMP8WT. U2OS cells stably expressing VAMP8WT or mutants that mimicked (VAMP82A) or resisted (VAMP82D) phosphorylation were transfected with GFP-SCFD1/Flag-STX17 and then treated with or without Torin. Cells were fixed and subjected to immunofluorescence microscopy using GFP/Flag antibody. Scale bar, 5 μm. H Quantification for F. One-way ANOVA (Data are shown as the mean ± SEM. ****p < 0.0001, n = 30).
Fig. 7
Fig. 7. VAMP8 phosphorylation regulates lipid homeostasis in liver.
A VAMP8 mutations mimicking dephosphorylation (VAMP82A) accelerated p62 degradation compared with VAMP8WT in mice livers. In contrast, p62 was dramatically accumulated in liver tissue lysates expressing the phosphorylation mimic VAMP82D variant. The p62 levels from liver tissues from AAV-VAMP8WT, AAV-VAMP82A, or AAV-VAMP82D injected mice were detected by western blotting. B Representative images of immunofluorescence staining for p62 in liver sections from mice liver specific expressing VAMP8, VAMP82A, or VAMP82D. Scale bar, 100 µm. C Quantification of p62 puncta per cell are shown. One-way ANOVA (Data are shown as the mean ± SEM. ***p < 0.001. ****p < 0.0001, n = 30). D Representative images of HE stained liver sections from mice with liver-specific expression of the VAMP8WT, VAMP82A, or VAMP82D proteins. Scale bar, 100 μm. 200×, n = 8/group. E Oil red O staining of liver sections from the indicated mouse livers. Scale bar, 100 µm. 200×, n = 8/group. F Transmission electron microscopy from the indicated mouse livers. Scale bar, 5 µm. 6000×, n = 8/group.

Comment in

Similar articles

Cited by

References

    1. Klionsky, D. J. et al. Guidelines for the use and interpretation of assays for monitoring autophagy (3rd edition). Autophagy12, 1–222 (2016). - PMC - PubMed
    1. Mizushima N, Yoshimori T, Ohsumi Y. The role of Atg proteins in autophagosome formation. Annu Rev. Cell Dev. Biol. 2011;27:107–132. - PubMed
    1. Lahiri V, Hawkins WD, Klionsky DJ. Watch what you (Self-) eat: autophagic mechanisms that modulate metabolism. Cell Metab. 2019;29:803–826. - PMC - PubMed
    1. Yu L, Chen Y, Tooze SA. Autophagy pathway: cellular and molecular mechanisms. Autophagy. 2018;14:207–215. - PMC - PubMed
    1. Stolz A, Ernst A, Dikic I. Cargo recognition and trafficking in selective autophagy. Nat. Cell Biol. 2014;16:495–501. - PubMed

Publication types