. 2021 Nov 16:10:e59912.
doi: 10.7554/eLife.59912.

Microtubules regulate pancreatic β-cell heterogeneity via spatiotemporal control of insulin secretion hot spots

Affiliations

Microtubules regulate pancreatic β-cell heterogeneity via spatiotemporal control of insulin secretion hot spots

Kathryn P Trogden et al. Elife. .

Abstract

Heterogeneity of glucose-stimulated insulin secretion (GSIS) in pancreatic islets is physiologically important but poorly understood. Here, we utilize mouse islets to determine how microtubules (MTs) affect secretion toward the vascular extracellular matrix at single cell and subcellular levels. Our data indicate that MT stability in the β-cell population is heterogenous, and that GSIS is suppressed in cells with highly stable MTs. Consistently, MT hyper-stabilization prevents, and MT depolymerization promotes the capacity of single β-cell for GSIS. Analysis of spatiotemporal patterns of secretion events shows that MT depolymerization activates otherwise dormant β-cells via initiation of secretion clusters (hot spots). MT depolymerization also enhances secretion from individual cells, introducing both additional clusters and scattered events. Interestingly, without MTs, the timing of clustered secretion is dysregulated, extending the first phase of GSIS and causing oversecretion. In contrast, glucose-induced Ca2+ influx was not affected by MT depolymerization yet required for secretion under these conditions, indicating that MT-dependent regulation of secretion hot spots acts in parallel with Ca2+ signaling. Our findings uncover a novel MT function in tuning insulin secretion hot spots, which leads to accurately measured and timed response to glucose stimuli and promotes functional β-cell heterogeneity.

Keywords: biphasic secretion; cell biology; computational cluster analysis; diabetes; medicine; microtubule dynamics; microtubule stability; mouse; stimulus-secretion coupling.


Conflict of interest statement

KT, JL, KB, KH, HM, XZ, GA, TF, AO, MM, MZ, GG, WH, IK No competing interests declared

Figures
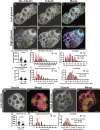
Figure 1.
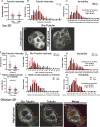
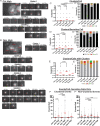
Figure 1.. MT stability decreases in high glucose but remains heterogenous.
(A–F) Disseminated islets treated with low (A–C) and high (D–F) glucose stained for Glu-tubulin (A, D) and tubulin (B, E). β-cells (dashed yellow line) were identified using Ins-Apl red nuclei (yellow, C, F). Red arrows point to differences between cells. Merge (C, F) shows Glu-tubulin (cyan), tubulin (magenta), and red nuclear expression of Ins-Apl (yellow). Single slice from the bottom of the cells. Scale bars: 10 µm. (G) Scatterplot of Glu-tubulin average intensity for each cell. Mean, red bar. Student’s t-test, p<0.0001. n=101 cells per condition. (H) Histogram of Glu-tubulin average intensity in low (black) and high (red) glucose. Bin=100. n=101 cells per condition. (I) Histogram of Glu-tubulin average intensity normalized to the mean of each low (black) and high (glucose). Bin=0.2. Coefficient of variation=standard deviation/mean. n=101 cells per condition. (J) Scatterplot of Glu-tubulin to tubulin ratio of average intensity for each cell. Mean, red bar. Student’s t-test, p<0.0001. n=101 cells per condition. (K) Histogram of Glu-tubulin to tubulin ratio of average intensity in low (black) and high (red) glucose. Bin=0.5, overflow bin of >6. n=101 cells per condition. (L) Histogram of Glu-tubulin to tubulin ratio of average intensity normalized to the mean of each low (black) and high (glucose). Bin=0.2. Coefficient of variation=standard deviation/mean. n=101 cells per condition. (M–O) Disseminated islets placed on ice for 30 min in low (M, N) and high glucose (O, P) and stained for tubulin (M, O). β-cells (dashed yellow line) were identified using red nuclear expression of Ins-Apl (yellow, N, P), merged with tubulin (magenta N, P). Red arrows point to differences between cells. Single slice from the bottom of the cells. Scale bars: 10 µm. (Q) Scatterplot of tubulin average intensity for each cell after 30 min in high glucose. Mean, red bar. Student’s t-test, p<0.0001. n=100–101 cells per condition. (R) Histogram of tubulin average intensity in low (black) and high (red) glucose after 30 min on ice. Bin=50. n=100–101 cells per condition. (S) Histogram of tubulin average intensity normalized to the mean of each low (black) and high (glucose) after 30 min on ice. Bin=0.2. Coefficient of variation=standard deviation/mean. n=100–101 cells per condition. MT, microtubule.
Figure 1—figure supplement 1.
Figure 1—figure supplement 1.. MT stability is regulated by glucose stimulation.
(A) Scatterplot of tubulin average intensity for each cell in low or high glucose. Mean, red bar. n=101 cells per condition. (B) Histogram of tubulin average intensity in low (black) and high (red) glucose. Bin=100. n=101 cells per condition. (C) Histogram of tubulin average intensity normalized to the mean of each low (black) and high (glucose). Bin=0.2. Coefficient of variation=standard deviation/mean. n=101 cells per condition. (D, E) Glu-tubulin staining in disseminated islets after 30 min on ice (corresponds to Figure 1M–O). β-cells outlined in dashed yellow lines. Single slice from the bottom of the cell. Scale bars: 10 µm. (F) Scatterplot of Glu-tubulin average intensity for each cell after 30 min on ice in low or high glucose. Mean, red bar. Student’s t-test, p<0.0001. n=100–101 cells per condition. (G) Histogram of Glu-tubulin average intensity in low (black) and high (red) glucose after 30 min on ice. Bin=100. n=100–101 cells per condition. (H) Histogram of Glu-tubulin average intensity normalized to the mean of each low (black) and high (glucose) after 30 min on ice. Bin=0.2. Coefficient of variation=standard deviation/mean. n=100–101 cells per condition. (I) Scatterplot of Glu-tubulin to tubulin ratio of average intensity for each cell after 30 min on ice. Mean, red bar. Student’s t-test, p=0.135. n=100–101 cells per condition. (J) Histogram of Glu-tubulin to tubulin ratio of average intensity in low (black) and high (red) glucose after 30 min on ice. Bin=1.0. n=100–101 cells per condition. (K) Histogram of Glu-tubulin to tubulin ratio of average intensity normalized to the mean of each low (black) and high (glucose) after 30 min on ice. Bin=0.2. Coefficient of variation=standard deviation/mean. n=100–101 cells per condition. (L–N) Disseminated islets extracted for 1 min and placed in buffer for 20 min. Stained for Glu-tubulin (L) and tubulin (M). β-cells were identified by red nuclear Ins-Apl expression (N, yellow), merged with Glu-tubulin (cyan) and tubulin (magenta). Red arrows pointing to differences between cells. Single slice from the bottom of the cells. Scale bars: 10 µm. MT, microtubule.
Figure 2.
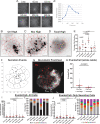
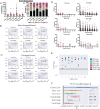
Figure 2.. MT instability increases β-cell activation and insulin secretion.
(A) Example images of a single secretion event pre-processing. Secretion signal starts at 65 ms and dissipates out. (A’) Graph of the average intensities of a circular ROI from images in panel (A). (B–D) Time projections of islets from Figure 2—videos 1–3 inverted. Fluozin-3 flashes are represented as black areas. Cell borders identified via pre-assay imaging (see Materials and methods) overlaid in red. Islets were preincubated in DMSO (control, B), nocodazole (C), or taxol (D) and stimulated with 20 mM glucose. Scale bars: 100 µm. (E) Graph of the percentage of cells in each field of view with at least one secretion event. Red bars, mean. One-way ANOVA and multiple comparison tests, p-value as indicated. N=16–19 islets. Here and below, islets derived from three or more independent isolations per each condition. (F) Glucose-stimulated secretion as detected by FluoZin-3 assay in islets. A representative output image from Matlab script (see Materials and methods) shows cell outlines (black lines) and secretion events (dots). Black dots are non-clustered secretion events, colored dots are clustered secretion events. (G) The same islet as in (F) fixed after the assay and stained for Glu-tubulin (grayscale). Cell outlines within which Glu-tubulin intensity was measured are shown in red. Numbers correspond to cells in (F) with the same number. The outline ‘bkg’ indicates background measurement area. Maximum intensity projection over 1.2 µm at the bottom of the islet. Bar: 10 µm. (H) Correlative analysis between data as in (F) and (G). The number of secretion events per cell with Glu-tubulin intensity below islet average and those above islet average is compared in the graph. Mann-Whitney nonparametric comparison test p-value is shown. N=98 cells from five islets. The same data set as in Figure 2—figure supplement 2A. (I) Graph of secretion events per cell detected by FluoZin-3 assay. All cells in a field of view are analyzed, whether activated during the movie or not. Red bar, mean. Kruskal-Wallis test nonparametric and multiple comparison tests, p-value as indicated, N=495–637 cells from 16 to 19 islets. (I’) Cells from panel (H), graphed as a stacked histogram of the percentage of total cells per condition that had each number of secretion events. (J) Graph of secretion events per cell only including cells with at least one event during the duration of the movie. Red bar, mean. Kruskal-Wallis test nonparametric and multiple comparison tests, p-value as indicated, N=88–407 cells from 16 to 19 islets. (J’) Cells from panel (I), graphed as a stacked histogram of the percentage of cells that had each number of secretion events. MT, microtubule; ROI, region of interest.
Figure 2—figure supplement 1.
Figure 2—figure supplement 1.. Assay protocol and basal glucose conditions are not affected by MT stability.
(A) Overview of Fluozin-3 assays. For more information, see Materials and methods. (B–D) Time projections of islets from Figure 2—videos 1–3 inverted. Fluozin-3 flashes are represented as black areas. Cell borders overlaid in red. Islets were preincubated in DMSO (control, B), nocodazole (C), or taxol (D) and incubated in 2.8 mM glucose. Scale bars: 100 µm. (E–G) Representative images of tubulin following Fluozin-3 imaging as shown in (A). Islets were preincubated in DMSO (control, E), nocodazole (F), or taxol (G) and stimulated with 20 mM glucose. Three-image max projection of the bottom of the islet. Scale bars: 10 µm. MT, microtubule.
Figure 2—figure supplement 2.
Figure 2—figure supplement 2.. Correlation of insulin secretion and MT stability.
(A) Correlation of Glu-tubulin intensity (normalized to islet average) to the number of secretion events per cell in whole islets. Gray field, intensity below islet average (<1). Yellow field, intensityabove islet average (>1). The same data set as in Figure 2F–H. (B) Correlation of Glu-tubulin intensity (normalized to the field of view average) to the number of secretion events per cell in disseminated islets. Correlative analysis between data as in (D) and (E). Gray field, intensity below field average (<1). Yellow field, intensity above field average (>1). (C). The number of secretion events per cell in disseminated islets with Glu-tubulin intensity below field average and those above field average is compared in the graph. The same data set as in (B). Mann-Whitney nonparametric comparison test p-value is shown. N=124 cells. (D) Cell outlines (white line) and secretion events (red circles) from a disseminated islet after 10 min in 20 mM glucose and Fluozin-3 dye. Scale bars: 10 µm. (E, F) Disseminated islet from (E) post-fixed following TIRF imaging for Glu-tubulin (E) and tubulin (F). Cells (yellow dashed lines) correspond to cells in (E) with the same number. Single slice from the bottom of the cells. Scale bars: 10 µm. MT, microtubule; TIRF, Total internal reflection fluorescent.
Figure 3.
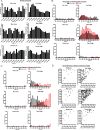
Figure 3.. MT stability suppresses formation of insulin secretion hot spots.
(A) Histogram of nearest neighbor distances obtained by measuring the distance between secretion events in cells with more than one secretion event during the movie. Graphed as the percentage of events within each bin per condition. Bin=0.5 µm. N=91–3255 distances from 16 to 19 islets. (B–D) Representative images of output from Matlab script (see Materials and methods) showing cell outlines (black lines) and secretion events (dots). Black dots are non-clustered secretion events, colored dots are clustered secretion events, each different color denotes a different cluster. Clusters were defined as 3+ secretion events occurring within nine pixels (1.44 µm) by density-based scanning. Islets were pre-treated with DMSO (control, B), nocodazole (C), or taxol (D) and were stimulated with 20 µm glucose. (E) Graph of the percentage of cells in each field of view with at least one cluster. Red bars, mean. One-way ANOVA and multiple comparison tests, p-value as indicated. N=16–19 islets. (F) Graph of the percentage of cells in each field of view with at least one cluster out of cells with at least one secretion event. Red bars, mean. One-way ANOVA and multiple comparison tests, p-value as indicated. N=16–19 islets. (G) Correlation of Glu-tubulin intensity (normalized to islet average) to the number of secretion clusters per cell in whole islets. Gray field, intensity below islet average (<1). Yellow field, intensity above islet average (>1). The same data set as in Figure 2F–H. (H) The number of clusters in cells with Glu-tubulin intensity below islet average and those above islet average is compared in the graph. Mann-Whitney nonparametric comparison test p-value is shown. N=98 cells from five islets. The same data set as in Figure 2F–H. (I) Correlation of Glu-tubulin intensity (normalized to islet average) to the number of clustered secretion events per cell in whole islets. Gray field, intensity below islet average (<1). Yellow field, intensity above islet average (>1). The same data set as in Figure 2F–H. (J) The number of clustered events in cells with Glu-tubulin intensity below islet average and those above islet average is compared in the graph. Mann-Whitney nonparametric comparison test p-value is shown. N=98 cells from five islets. The same data set as in Figure 2F–H. MT, microtubule.
Figure 3—figure supplement 1.
Figure 3—figure supplement 1.. 3+ event clusters are not spurious and a very rare in basal glucose conditions.
(A) Computationally simulated random secretion events in in silico cells using the mean area of the cells analyzed. (B–D) Representative images of output from Matlab script (see Materials and methods) showing cell outlines (black lines) and secretion events (dots). Black dots are non-clustered secretion events, colored dots are clustered secretion events, each different color denotes a different cluster. Clusters were defined as 3+ secretion events occurring with nine pixels (1.44 µm) by density-based scanning. Islets were pre-treated with DMSO (control, B), nocodazole (C), or taxol (D) and were incubated in 2.8 µm glucose.
Figure 4.
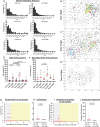
Figure 4.. MT-disruption increases the number of hot spots per cell, increasing clustered secretion.
(A) Representative images of clusters from one cell in a control islet stimulated with 20 mM glucose. Clusters were identified by Matlab script (see Materials and methods). First image is time projection through all clusters in the cell 15.925–194.675 s of the movie, clusters are identified by red text. Time in seconds of each event in the cluster above, red arrowheads identify the secretion event. Scale bars: 5 µm. (B) Representative images of clusters from one cell in a nocodazole pre-treated islet stimulated with 20 mM glucose. Clusters were identified by Matlab script (see Materials and methods). First image is time projection through all clusters in the cell 54.65–407.875 s of the movie, clusters are identified by red text. Time in seconds of each event in each cluster above, red arrowheads identify the secretion event. Scale bars: 5 µm. (C) Graph of clusters per cell in the field of view, with all cells whether activated during the movie or not. Red bar, mean. Kruskal-Wallis test nonparametric and multiple comparison tests, p-value as indicated, N=495–637 cells from 16 to 19 islets. (C’) Cells from panel (C), graphed as a stacked histogram of the percentage of total cells per condition that had each number of clusters. (D) Graph of clusters per cell only including cells with at least one secretion event during the duration of the movie. Red bar, mean. Kruskal-Wallis test nonparametric and multiple comparison tests, p-value as indicated, N=88–407 cells from 16 to 19 islets. (D’) Cells from panel (D), graphed as a stacked histogram of the percentage of cells with secretion events per condition that had each number of clusters. (E) Graph of clusters per cell, only cells with at least cluster during the duration of the movie were included. Red bar, mean. Kruskal-Wallis test nonparametric and multiple comparison tests, p-value as indicated, N=13–143 cells from 16 to 19 islets. (E’) Cells from panel (E), graphed as a stacked histogram of the percentage of cells with clusters per condition that had each number of clusters. (F) Graph of events per cell with at least one secretion event during the movie that were in a cluster. Red bar, mean. Kruskal-Wallis test nonparametric and multiple comparison tests, N=88–407 cells from 16 to 19 islets. (F’) Graph of events per cell with at least one secretion event during the movie that were not in a cluster. Red bar, mean. Kruskal-Wallis test nonparametric and multiple comparison tests, N=88–407 cells from 16 to 19 islets. MT, microtubule.
Figure 5.
Figure 5.. Increased secretion from clusters leads to faster secretion at that site.
(A) Graph of events per cluster (cluster size), Red bar, mean. Kruskal-Wallis test nonparametric and multiple comparison tests found no statistical differences between conditions. N=14–290 clusters from 16 to 19 islets. (A’) Clusters from panel (F), graphed as a stacked histogram of the percentage of clusters with each number of events per condition. (B) Histogram of the time between successively (in time) occurring non-clustered events with the best fit exponential overlaid (KS-statistic is provided for quality of fit). (C) Histogram of the time between successively occurring clustered events with the best fit exponential overlaid (KS-statistic is provided for quality of fit). (D) Graph of time (seconds) between successive events (wait time). Distribution for clusters of different sizes (Red bar=mean). Some conditions lack clusters of particular size (e.g., no clusters with six secretion events in Ctrl low), as indicated by no data. (E) Each distribution in (D) is fit separately to an exponential distribution and the quality of fit is assessed with a KS-test (as in panels (B, C)). The resulting p-value for every test is plotted, with the black line indicating p=0.05. (F) Results of fitting a general linear model to the data from (D) (see Materials and methods for further details) with the assumption that ‘secretion rate=α+β* Cluster Size.’ Bayesian credible intervals for β are plotted for each condition. This model is also compared to a null model where ‘secretion rate=α’ (i.e., lacking size dependence), with model comparison results reported as the difference of WAIC scores (positive indicates the full model provides a better accounting of the data).
Figure 6.
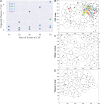
Figure 6.. MTs restrict secretion from hot spots to the first phase of secretion, loss of MTs lengthen this phase.
(A) Histogram of basal and glucose-stimulated secretion events over time. Graphed as the percentage of events within each bin per condition. Time (seconds) since dye and either high (20 mM) or low (2.8 mM) glucose addition. Bin=30 s. N=16–19 islets. (B) Histogram of secretion events over time separated into secretion events not in clusters (black) and in clusters (red). Absolute numer of events is shown. Time (seconds) since dye and either high (20 mM) or low (2.8 mM) glucose addition. Bin=30 s. N=16–19 islets. (C) Histogram of the first event in a cluster (black) and last event in a cluster (red) over time. Absolute numer of events is shown. Time (seconds) since dye and either high (20 mM) or low (2.8 mM) glucose addition. Bin=30 s. N=16–19 islets. (D) Scatterplot of each cluster in each condition with the timing of the first event in a cluster on the x-axis and the timing of the last event in a cluster on the y-axis. Time (seconds) since dye and either high (20 mM) or low (2.8 mM) glucose addition. Bin=30 s. N=16–19 islets. MT, microtubule.
Figure 6—figure supplement 1.
Figure 6—figure supplement 1.. Clustered secretion is mostly restricted to the first phase of secretion in control islets.
(A) Histogram of secretion events over time separated into secretion events not in clusters (black) and in clusters (red). Graphed as percentage of events within each bin per condition. Time (seconds) since dye and either high (20 mM) or low (2.8 mM) glucose. Bin=30 seconds. N=16-19 islets.
Figure 7.
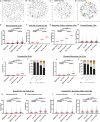
Figure 7.. Calcium signaling is essential for secretion regardless of MT presence.
(A) GSIS as detected by ELISA. Secretion over 30 min upon 20 mM glucose stimulation is shown for DMSO control and nocodazole pre-treated cells in the presence and absence of 5 µM Diazoxide. Tukey’s multiple comparisons test p-values are shown. (B, C) Time frames from attached islets treated with DMSO (B) and nocodazole (C) and incubated with Calbryte 520 (cyan). Time after 20 MM glucose stimulation, seconds. Red, mApple (β-cell marker). Single plane spinning disk confocal microscopy images. Dotted line outlines indicate representative β-cells with detectable concentration of Calbryte 520 used for analyses. Scale bars: 10 µm. (D) Graph of highest amplitudes of Calbryte 520 intensity fluctuation per cell, measured in data as in Figure 7—figure supplement 1. Mann-Whitney nonparametric comparison test p-value is shown. N=78–102 cells from 8 to 12 islets. (E) Summarized increase of Calbryte 520 intensity over the first minute of glucose stimulation per cell, measured in data as in Figure 7—figure supplement 1. Mann-Whitney nonparametric comparison test p-value is shown. N=78–102 cells from 8 to 12 islets. GSIS, glucose-stimulated insulin secretion; MT, microtubule.
Figure 7—figure supplement 1.
Figure 7—figure supplement 1.. Calcium influx over time in glucose-stimulated islets.
(A, B) Analysis of a representative experiment (one islet isolation) summarized in Figure 7D and E. Each curve represents Calbryte 520 intensity dynamics of a single β-cell, 1 min before and 1 min after the fluctuations start. Each graph combines cells from one islet, either control DMSO- (A) or nocodazole-pretreated (B). Fold increase over mean intensity at the time of stimulation is shown. Time after stimulation is shown. Time, minutes.
Figure 8.
Figure 8.. MTs regulate glucose-stimulated secretion in addition to calcium-dependent mechanisms.
(A–D) KCl− (A, B) and KCl+ Glucose-stimulated (C, D) secretion as detected by FluoZin-3 assay in DMSO- (A, C) and nocodazole (B, D) pre-treated islets. Representative output images from Matlab script (see Materials and methods) shows cell outlines (black lines) and secretion events (dots) over 2.5 min after stimulation. Black dots are non-clustered secretion events, colored dots are clustered secretion events. (E) Graph of KCl-induced secretion events per cell over 2.5 min detected by FluoZin-3 assay (data as in (A–D)). Red bar, mean. Kruskal-Wallis test nonparametric and multiple comparison tests, p-value as indicated, N=306–708 cells from 15 to 17 islets. (F) Graph of the percentage of cells in each field of view with at least one cluster in KCl-induced secretion over 2.5 min. Red bar, mean. One-way ANOVA and multiple comparison tests, p-value as indicated, N=15–17 islets. (G) Graph of the percentage of cells in each field of view with at least one cluster out of cells with at least one secretion event. KCl-induced secretion over 2.5 min. Red bar, mean. One-way ANOVA and multiple comparison tests, p-value as indicated, N=15–17 islets. (H) Number of secretion events per cluster (cluster size). KCl-induced secretion over 2.5 min. Red bar, mean. Kruskal-Wallis test nonparametric and multiple comparison tests, no significant difference, N=109–269 clusters from 306 to 708 cells/15–17 islets. (I) Graph of clusters per cell in each condition. KCl-induced secretion over 2.5 min. Red bar, mean. Kruskal-Wallis test nonparametric and multiple comparison tests, p-value as indicated, N=306–708 cells from 15 to 17 islets. (I’) Cells from panel (I), graphed as a stacked histogram of the percentage of total cells per condition that had each number of clusters. (J) Graph of clusters per cell only including cells with at least one secretion event. KCl-induced secretion over 2.5 min. Red bar, mean. Kruskal-Wallis test nonparametric and multiple comparison tests, p-values as indicated, N=218–334 cells from 15 to 17 islets. (J’) Cells from panel J, graphed as a stacked histogram of the percentage of cell with secretion events per condition that had each number of clusters. (K) Graph of clustered events per cell. KCl-induced secretion over 2.5 min. Red bar, mean. Kruskal-Wallis test non-parametric and multiple comparison tests, p values as indicated, N=306–708 cells from 15 to 17 islets. (K’) Graph of non-clustered events per cell. KCl-induced secretion over 2.5 min. Red bar, mean. Kruskal-Wallis test nonparametric and multiple comparison tests, p-values as indicated, N=306–708 cells from 15 to 17 islets. (L) Graph of clustered events per cell out of cells with at least one secretion event. Red bar, mean. Kruskal-Wallis test nonparametric and multiple comparison tests, p-values as indicated, N=218–334 cells from 15 to 17 islets. (L’) Graph of non-clustered events per cell out of cells with at least one secretion event. Red bar, mean. Kruskal-Wallis test nonparametric and multiple comparison tests, p-values as indicated, N=218–334 cells from 15 to 17 islets. MT, microtubule.
Figure 8—figure supplement 1.
Figure 8—figure supplement 1.. Rapid secretion induction by KCL as compared to glucose.
(A) Graph of glucose, KCl− and KCl+ Glucose-stimulated secretion events per cell over 8 min in DMSO- and nocodazole pre-treated islets. Red bar, mean. Kruskal-Wallis test nonparametric and multiple comparison tests, p-value as indicated, N=306–708 cells from 13 to 17 islets. (B) Graph of clusters per cell shown as a stacked histogram of the percentage of total cells per condition that had each number of clusters. Secretion over 8 min. N=306–708 cells from 13 to 17 islets. (C) Number of secretion events per cluster over 8 min (cluster size). Red bar, mean. Kruskal-Wallis test nonparametric and multiple comparison tests, no significant difference, N=72–342 clusters from 306 to 708 cells/13–17 islets. (D) Graph of time between successive events (wait time) in clusters over 8 min (Red bar=mean). Kruskal-Wallis test nonparametric and multiple comparison tests, p-value as indicated, N=72–342 clusters from 306 to 708 cells/13–17 islets. (E) Histogram of secretion events over time (8 min). Graphed as the percentage of events within each bin per condition. Time (seconds) after stimulation (20 mM glucose, 25 mM KCl, or combination of both, as indicated). Bin=30 s. N=13–17 islets.
Figure 9.
Figure 9.. MT regulation of insulin secretion at a hot spot.
(A) Glucose signaling stimulates both insulin granule docking and calcium influx; calcium influx, in turn, promotes secretion of docked graules. MT-dependent transport negatively regulates the process of docking, restricting the number of readily releasable granules and secretion outcome. (B) KCl treatment causes extreme acute calcium influx, which in turn facilitates secretion of pre-docked granules. No additional docking occurs in the absence of glucose stimulation, and MT regulation does not influence the number of pre-docked granules and secretion levels. MT, microtubule.

Similar articles

Cited by

References

    1. Aguayo-Mazzucato C, van Haaren M, Mruk M, Lee TB, Crawford C, Hollister-Lock J, Sullivan BA, Johnson JW, Ebrahimi A, Dreyfuss JM, Van Deursen J, Weir GC, Bonner-Weir S. β Cell Aging Markers Have Heterogeneous Distribution and Are Induced by Insulin Resistance. Cell Metabolism. 2017;25:898–910. doi: 10.1016/j.cmet.2017.03.015. - DOI - PMC - PubMed
    1. Bader E, Migliorini A, Gegg M, Moruzzi N, Gerdes J, Roscioni SS, Bakhti M, Brandl E, Irmler M, Beckers J, Aichler M, Feuchtinger A, Leitzinger C, Zischka H, Wang-Sattler R, Jastroch M, Tschöp M, Machicao F, Staiger H, Häring H-U, Chmelova H, Chouinard JA, Oskolkov N, Korsgren O, Speier S, Lickert H. Identification of proliferative and mature β-cells in the islets of Langerhans. Nature. 2016;535:430–434. doi: 10.1038/nature18624. - DOI - PubMed
    1. Ballian N, Brunicardi FC. Islet vasculature as a regulator of endocrine pancreas function. World Journal of Surgery. 2007;31:705–714. doi: 10.1007/s00268-006-0719-8. - DOI - PubMed
    1. Benninger R, Hutchens T, Head WS, McCaughey MJ, Zhang M, Le Marchand SJ, Satin LS, Piston DW. Intrinsic islet heterogeneity and gap junction coupling determine spatiotemporal Ca2+ wave dynamics. Biophysical Journal. 2014;107:2723–2733. doi: 10.1016/j.bpj.2014.10.048. - DOI - PMC - PubMed
    1. Benninger R, Hodson DJ. New Understanding of β-Cell Heterogeneity and In Situ Islet Function. Diabetes. 2018;67:537–547. doi: 10.2337/dbi17-0040. - DOI - PMC - PubMed

Publication types