

Radiotherapy and High-Dose Interleukin-2: Clinical and Immunological Results of a Proof of Principle Study in Metastatic Melanoma and Renal Cell Carcinoma
- PMID: 34777395
- PMCID: PMC8578837
- DOI: 10.3389/fimmu.2021.778459
Radiotherapy and High-Dose Interleukin-2: Clinical and Immunological Results of a Proof of Principle Study in Metastatic Melanoma and Renal Cell Carcinoma
Abstract
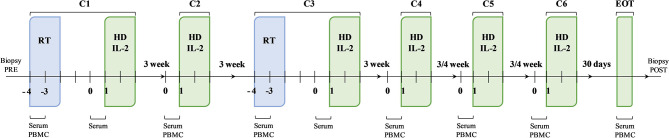
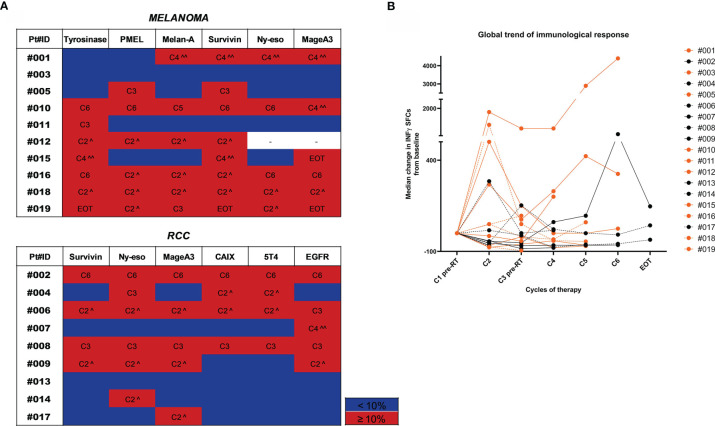
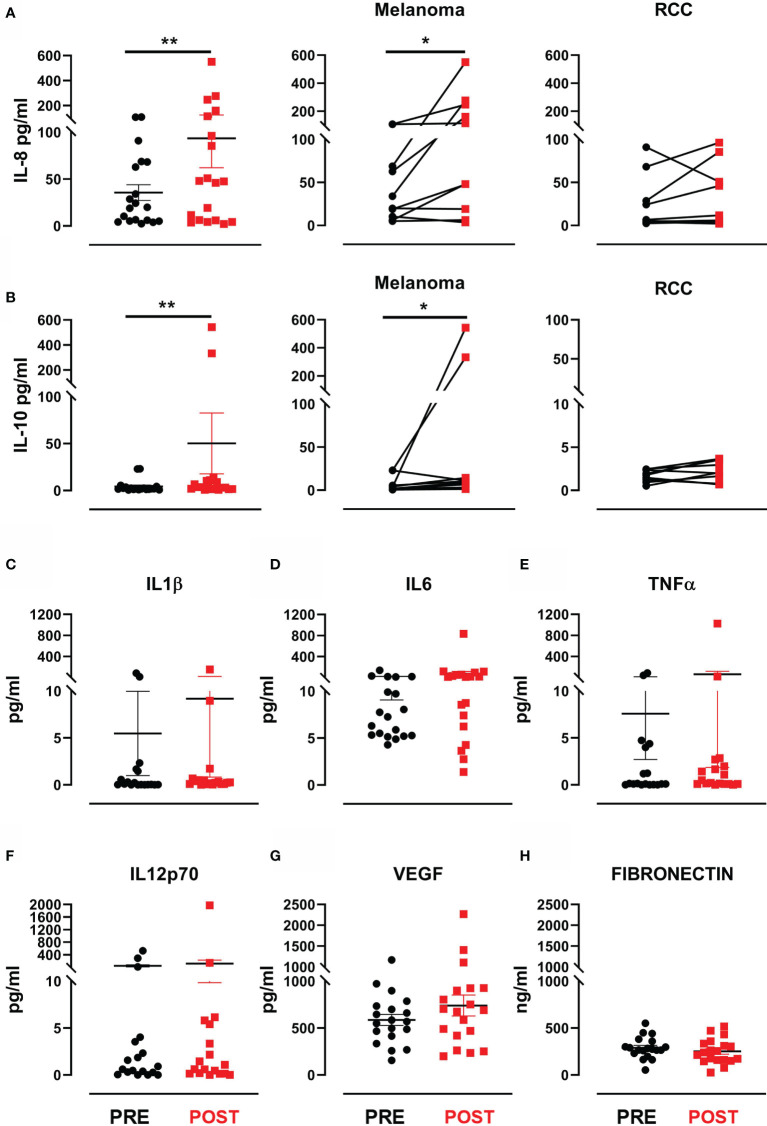
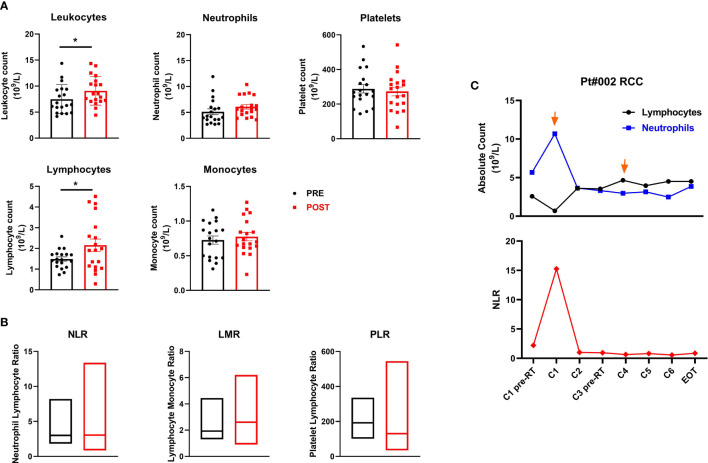
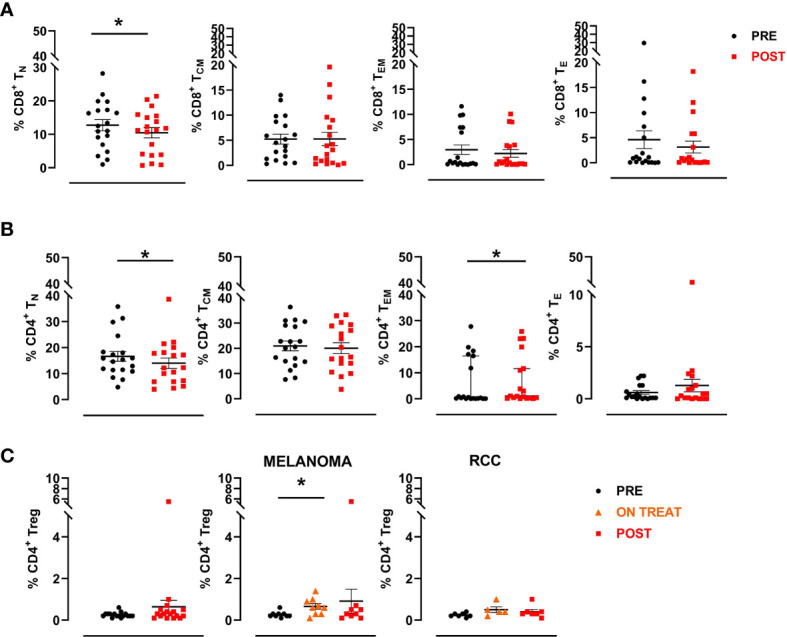
High-dose interleukin-2 (HD IL-2) has curative potential in metastatic melanoma (MM) and renal cell carcinoma (RCC). Radiotherapy (RT) kills cancer cells and induces immunomodulatory effects. Prospective trials exploring clinical and immunological properties of combined RT/HD IL-2 are still needed. We designed a phase II, single-arm clinical trial for patients with MM and RCC. The treatment schedule consisted of 3 daily doses of 6-12 Gy of RT to 1-5 non-index metastatic fields, before IL-2 at the first and third treatment cycle. HD IL-2 was administered by continuous infusion for 72 hours and repeated every 3 weeks for up to 4 cycles, thereafter every 4 weeks for a maximum of 2 cycles. The primary endpoint was the immunological efficacy of the combined RT/HD IL-2 treatment (assessed by IFN-γ ELISPOT). Nineteen out of 22 patients were evaluable for immunological and clinical response. Partial response occurred in 3 (15.7%) patients and stable disease was observed in 7 (36.8%). The disease control rate was 52.6% after a median follow up of 39.2 months. According to Common Terminology Criteria for Adverse Events 4.0 (CTCAE 4.0), the majority of toxicities were grade 1-2. Immunological responses were frequent and detected in 16 (84.2%) patients. Increased levels of IL-8 and IL-10 in melanoma, circulating effector memory CD4+ and intratumoral CD8+ T cells in both tumor types were detected after therapy. Overall the treatment was well tolerated and immunologically active. Immunomonitoring and correlative data on tumor and peripheral blood cell subsets suggest that this combination treatment could be a promising strategy for patients progressing after standard treatments.
Keywords: IFN-γ ELISPOT assay; clinical immunomonitoring; high dose IL-2; metastatic melanoma; radiotherapy; renal cell carcinoma.
Copyright © 2021 Bulgarelli, Piccinini, Petracci, Pancisi, Granato, de Rosa, Guidoboni, Petrini, Ancarani, Foschi, Romeo, Tontini, De Giorgi, Lolli, Gentili, Valmorri, Rossi, Ferroni, Casadei, Cortesi, Crudi and Ridolfi.
Conflict of interest statement
The authors declare that the research was conducted in the absence of any commercial or financial relationships that could be construed as a potential conflict of interest.
Figures
Similar articles
-
Radiotherapy as an immunological booster in patients with metastatic melanoma or renal cell carcinoma treated with high-dose Interleukin-2: evaluation of biomarkers of immunologic and therapeutic response.J Transl Med. 2014 Sep 23;12:262. doi: 10.1186/s12967-014-0262-6. J Transl Med. 2014. PMID: 25245327 Free PMC article. Clinical Trial.
-
Results of two sequential phase II studies of interleukin-2 (IL2) in metastatic renal cell carcinoma and melanoma: high-dose continuous intravenous IL2 infusion and subcutaneous IL2 administration in combination with alpha interferon.Rev Med Univ Navarra. 1996 Jul-Sep;40(3):6-12. Rev Med Univ Navarra. 1996. PMID: 9499820 Clinical Trial.
-
Immune effects of escalating doses of granulocyte-macrophage colony-stimulating factor added to a fixed, low-dose, inpatient interleukin-2 regimen: a randomized phase I trial in patients with metastatic melanoma and renal cell carcinoma.J Immunother. 2003 Mar-Apr;26(2):130-8. doi: 10.1097/00002371-200303000-00005. J Immunother. 2003. PMID: 12616104 Clinical Trial.
-
Current status of interleukin-2 therapy for metastatic renal cell carcinoma and metastatic melanoma.Oncology (Williston Park). 2002 Nov;16(11 Suppl 13):4-10. Oncology (Williston Park). 2002. PMID: 12469934 Review.
-
Overview of interleukin-2 inhalation therapy.Cancer J Sci Am. 2000 Feb;6 Suppl 1:S104-12. Cancer J Sci Am. 2000. PMID: 10685669 Review.
Cited by
-
Multi-ancestry genome-wide meta-analysis identifies novel basal cell carcinoma loci and shared genetic effects with squamous cell carcinoma.Commun Biol. 2024 Jan 5;7(1):33. doi: 10.1038/s42003-023-05753-7. Commun Biol. 2024. PMID: 38182794 Free PMC article.
-
The Applications of ELISpot in the Identification and Treatment of Various Forms of Tuberculosis and in the Cancer Immunotherapies.Methods Mol Biol. 2024;2768:51-58. doi: 10.1007/978-1-0716-3690-9_4. Methods Mol Biol. 2024. PMID: 38502387
-
TLR3 activation enhances abscopal effect of radiotherapy in HCC by promoting tumor ferroptosis.EMBO Mol Med. 2024 May;16(5):1193-1219. doi: 10.1038/s44321-024-00068-4. Epub 2024 Apr 26. EMBO Mol Med. 2024. PMID: 38671318 Free PMC article.
-
Recent advances in immunotherapy and its combination therapies for advanced melanoma: a review.Front Oncol. 2024 Jul 16;14:1400193. doi: 10.3389/fonc.2024.1400193. eCollection 2024. Front Oncol. 2024. PMID: 39081713 Free PMC article. Review.
-
Reigniting hope in cancer treatment: the promise and pitfalls of IL-2 and IL-2R targeting strategies.Mol Cancer. 2023 Jul 29;22(1):121. doi: 10.1186/s12943-023-01826-7. Mol Cancer. 2023. PMID: 37516849 Free PMC article. Review.
References
-
- Fisher RI, Rosenberg SA, Fyfe G. Long-Term Survival Update for High-Dose Recombinant Interleukin-2 in Patients With Renal Cell Carcinoma. Cancer J Sci Am (2000) 6(Suppl 1):S55–7. - PubMed
-
- Atkins MB, Kunkel L, Sznol M, Rosenberg SA. High-Dose Recombinant Interleukin-2 Therapy in Patients With Metastatic Melanoma: Long-Term Survival Update. Cancer J Sci Am (2000) 6(Suppl 1):S11–4. - PubMed
-
- Diab A, Tannir NM, Bentebibel SE, Hwu P, Papadimitrakopoulou V, Haymaker C, et al. . Bempegaldesleukin (NKTR-214) Plus Nivolumab in Patients With Advanced Solid Tumors: Phase I Dose-Escalation Study of Safety, Efficacy, and Immune Activation (PIVOT-02). Cancer Discov (2020) 10(8):1158–73. doi: 10.1158/2159-8290.CD-19-1510 - DOI - PubMed
Publication types
MeSH terms
Substances
LinkOut - more resources
Full Text Sources
Medical
Research Materials