Review
. 2021 Dec;16(12):5673-5706.
doi: 10.1038/s41596-021-00630-1. Epub 2021 Nov 12.

Genome-wide quantification of transcription factor binding at single-DNA-molecule resolution using methyl-transferase footprinting

Affiliations
Review

Genome-wide quantification of transcription factor binding at single-DNA-molecule resolution using methyl-transferase footprinting

Rozemarijn W D Kleinendorst et al. Nat Protoc. 2021 Dec.

Abstract

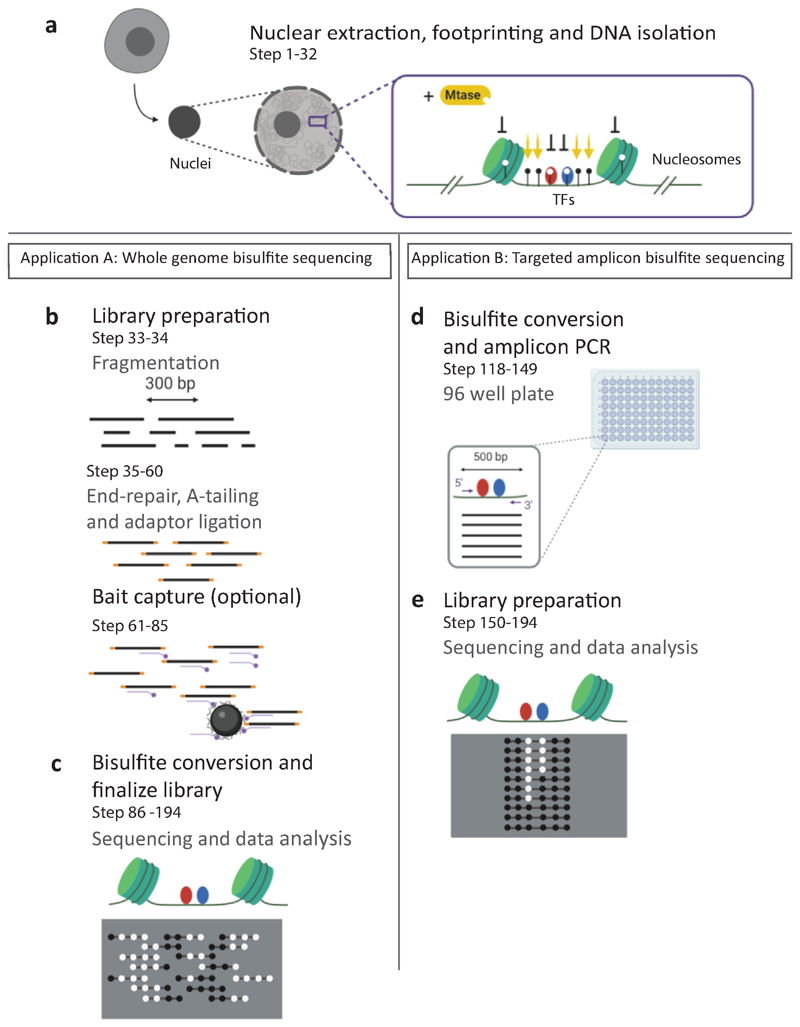
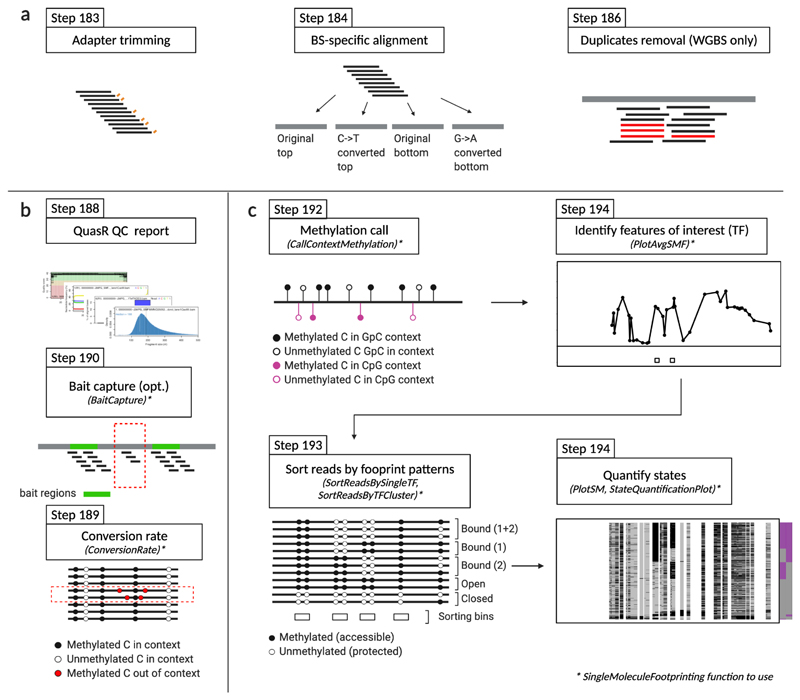
Precise control of gene expression requires the coordinated action of multiple factors at cis-regulatory elements. We recently developed single-molecule footprinting to simultaneously resolve the occupancy of multiple proteins including transcription factors, RNA polymerase II and nucleosomes on single DNA molecules genome-wide. The technique combines the use of cytosine methyltransferases to footprint the genome with bisulfite sequencing to resolve transcription factor binding patterns at cis-regulatory elements. DNA footprinting is performed by incubating permeabilized nuclei with recombinant methyltransferases. Upon DNA extraction, whole-genome or targeted bisulfite libraries are prepared and loaded on Illumina sequencers. The protocol can be completed in 4-5 d in any laboratory with access to high-throughput sequencing. Analysis can be performed in 2 d using a dedicated R package and requires access to a high-performance computing system. Our method can be used to analyze how transcription factors cooperate and antagonize to regulate transcription.


Conflict of interest statement

Competing Interests

The authors declare no competing interests.

Figures

Figure 1
Figure 1. Overview of the experimental workflow.
a, Nuclei are extracted using a hypotonic buffer. Methylation footprinting is performed by incubating the nuclei with a GpC (M.CviPI), and optionally CpG (M.SssI) methyltransferase (Mtase). Regions accessible to the enzymes are methylated, while regions bound by proteins (TFs, nucleosomes) are protected, creating footprints of various sizes. DNA is extracted and used for whole genome (left panel), or targeted amplicon (right panel) analysis. b, For whole genome analysis, DNA is fragmented to a target size range of 300-500 bp. DNA is end-repaired and sequencing adapters are ligated. An optional capture step can be performed to enrich the library for regions of interest such as CREs and reduce the sequencing depth required for single molecule analysis. c, DNA is bisulfite converted and the library is amplified before sequencing on Illumina MiSeq and NextSeq platforms. d, Alternatively to the whole genome approach, primers can be designed to target 96 loci using amplicon bisulfite PCR. Amplicons are typically designed to cover 300-500 bp of the CRE. e, Amplicons are pooled, and the library is prepared. Up to 12 libraries can be multiplexed and sequenced on a MiSeq instrument. The read ends in amplicon data are identical for every molecule, creating focused high coverage views of the targeted loci.
Figure 2
Figure 2. Number of TFBSs that can be studied by SMF.
Classification of the single molecules at a TFBS requires the presence of informative cytosines in each of the classification bins. The scatterplot shows the percentages of TFBSs that can be analyzed when performing SMF with the GpC methyltransferase M.CviPI (single enzyme - SE, y axis) or in combination with the CpG methyltransferase M.SssI (double enzyme - DE, x axis). The percentages are calculated with respect to the total number of TFBSs (dot size) mapped to the mouse genome using JASPAR PWMs and confirmed via publicly available ChIP-seq evidence (the datasets used are detailed in Table S1 of Sönmezer et al). For TFs such as NRF1, E2F1 and Klf4 there is quite a clear advantage in performing DE, dual enzyme, SMF as compared to SE, single enzyme, SMF.
Figure 3
Figure 3. Methylation efficiency of M.SssI and M.CviPI is not affected by the sequence context when saturating conditions are used.
In vitro methylation of naked lambda DNA using various concentrations of M.SssI (left panel) or M.CviPI (right panel) shows moderate sequence preferences at non-saturating enzyme concentrations (up to 2 Units/μg of DNA). Importantly, these differences become negligible under saturating conditions (>10 Units/μg of DNA), such as the ones used during SMF experiments (200 Units/1μg of DNA).
Figure 4
Figure 4. Quality controls during the preparation of bait-captured SMF samples.
Bioanalyzer traces after various steps of the protocol. a, Footprinted DNA is fragmented with Covaris (300-500 bp)(step 34). b, and subjected to end-repair and A-tailing (step 49). c, A ~50 bp shift in size distribution is detected at the adapter ligation step (step 60). The library is then subjected to bait-capture and bisulfite conversion. d, The size distribution is further shifted upon library amplification to a final library size of 300-600 bp representing DNA fragments of ~150-500 bp (step 115).
Figure 5
Figure 5. Overview of the computational workflow.
a, The sequencing reads are pre-processed. Illumina adapters are removed and low-quality bases are trimmed. The reads are aligned against a bisulfite-converted genome. PCR duplicates are removed only for whole genome bisulfite sequencing experiments (WGBS). b, The quality of the library is assessed by performing several generic quality controls including estimating the mapping rate, duplication rates, and fragment length distribution. In addition, SMF specific controls such as estimating bait capture efficiency and the conversion rate are implemented. c, A series of functions have been implemented in the SingleMoleculeFootpring R package to facilitate data interpretation. These include functions to call average methylation in the relevant genomic contexts (GpC and CpG); sort the reads according to their footprint patterns; and plot average and single molecule footprints at individual loci.
Figure 6
Figure 6. Controlling footprinting efficiency with low-coverage sequencing data.
The efficiency of footprinting can be controlled using low-coverage samples (<1 106 reads) and comparing them to existing reference datasets. The comparison is made under the assumption that most of the SMF signal is invariable between conditions since it mostly represents nucleosome occupancy across the genome. a, Comparison of expected versus observed methylation rate values for several low-coverage samples, two of which were identified to be undermethylated (red lines). The high-coverage reference sample is used to group cytosines based on their reference methylation. The methylation of each group of cytosines is calculated using all reads covering cytosines of a given group that have similar accessibility profiles. b, The deviation of each sample from the reference dataset where the observed values perfectly equal the expected values is quantified as the Mean squared error (MSE), successfully identifying undermethylated samples. This procedure allows control for the efficiency of footprinting before investing in deep sequencing of SMF samples.
Figure 7
Figure 7. SMF data visualisation.
Single molecule analysis of a Mus musculus genomic locus harbouring two NRF1 binding sites using a, whole genome bisulfite sequencing (WGBS) or b, amplicon bisulfite sequencing data. The upper panels show the average SMF signal (1-methylation). The lower panels show stacks of single DNA molecules sorted according to the occupancy pattern of the two NRF1 binding sites. The frequency of the states is displayed in the barplot next to the single molecule stacks. In this particular case, both NRF1 binding sites are co-occupied in 30% and 26% of the reads in the WGBS and amplicon sequencing experiment, respectively. Binding at individual NRF1 sites is observed at between 11% and 18% of the reads and the region is accessible in about 40% of the molecules. Signal amplification in the amplicon experiment increases coverage to 5513 reads versus the 206 of the genome-wide experiment.
Figure 8
Figure 8. Single molecule sorting.
a, Single reads can be sorted according to the occupancy pattern over a genomic feature of interest. Here, a transcription factor binding site (TFBS) is depicted as the white box in the lower part of the average SMF plot. Three collection bins are drawn: one centered on the TFBS (red box), one upstream and one downstream of it (green boxes). For each read, the methylation information is averaged and rounded within the bins (as shown in the callout windows). The result is that each read is now reduced to three binary values. b, There are 23 possible methylation patterns. One of those is “101” which represents the cases where the TFBS bin is found occupied (unmethylated) and the two surrounding bins are found accessible (methylated). When the methylation pattern of a read corresponds to “101”, it is interpreted as in the “TF bound” state. Alternatively, the sequence “111” would correspond to the “accessible” state. The remaining combinations are interpreted as “nucleosome occupied” states. c, Single reads can also be sorted according to the occupancy pattern over multiple genomic features, such as TFBS clusters. In this case, the number of bins that are drawn is n+2, where n equals the number of TFBS in the cluster. Notably, the number of possible states, and therefore the complexity of the biological interpretation, increases with the number of TFBSs. This figure was adapted from Sönmezer et al.
Figure 9
Figure 9. Quality controls during the preparation of amplicon SMF samples.
1-2 μg of footprinted DNA is bisulfite converted and used as an input for 96 parallel PCR reactions. a, PCR efficiency is checked by loading an aliquot on a 2% agarose gel. With standard bisulfite primer design parameters, 80-90% of the reactions lead to a detectable product and amplicon size ranges between 300-500 bp (step 137). An aliquot of each PCR product is pooled and used as an input for sequencing library preparation. b, The size distribution of the final library is verified on an Agilent Bioanalyzer, with an expected size of 430-630 bp (step 176).

Similar articles

Cited by

References

    1. Raha D, Hong M, Snyder M. ChIP-Seq: A Method for Global Identification of Regulatory Elements in the Genome. Current Protocols in Molecular Biology. 2010;91 - PubMed
    1. Skene PJ, Henikoff S. An efficient targeted nuclease strategy for high-resolution mapping of DNA binding sites. eLife. 2017;6:e21856. - PMC - PubMed
    1. Song L, Crawford GE. DNase-seq: A High-Resolution Technique for Mapping Active Gene Regulatory Elements across the Genome from Mammalian Cells. Cold Spring Harbor Protocols. 2010;2010:pdb.prot5384-pdb.prot5384 - PMC - PubMed
    1. Buenrostro JD, Giresi PG, Zaba LC, Chang HY, Greenleaf WJ. Transposition of native chromatin for fast and sensitive epigenomic profiling of open chromatin, DNA-binding proteins and nucleosome position. Nat Methods. 2013;10:1213–1218. - PMC - PubMed
    1. Reiter F, Wienerroither S, Stark A. Combinatorial function of transcription factors and cofactors. Current Opinion in Genetics & Development. 2017;43:73–81. - PubMed

Publication types

MeSH terms