

Characterisation of Collagen Re-Modelling in Localised Prostate Cancer Using Second-Generation Harmonic Imaging and Transrectal Ultrasound Shear Wave Elastography
- PMID: 34771715
- PMCID: PMC8582793
- DOI: 10.3390/cancers13215553
Characterisation of Collagen Re-Modelling in Localised Prostate Cancer Using Second-Generation Harmonic Imaging and Transrectal Ultrasound Shear Wave Elastography
Abstract
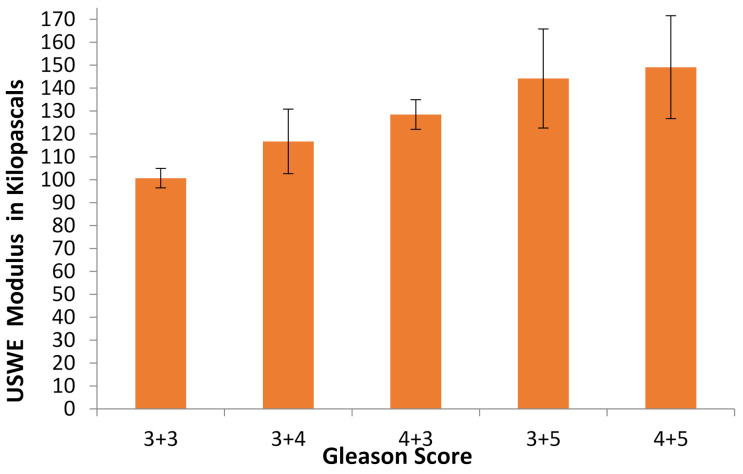
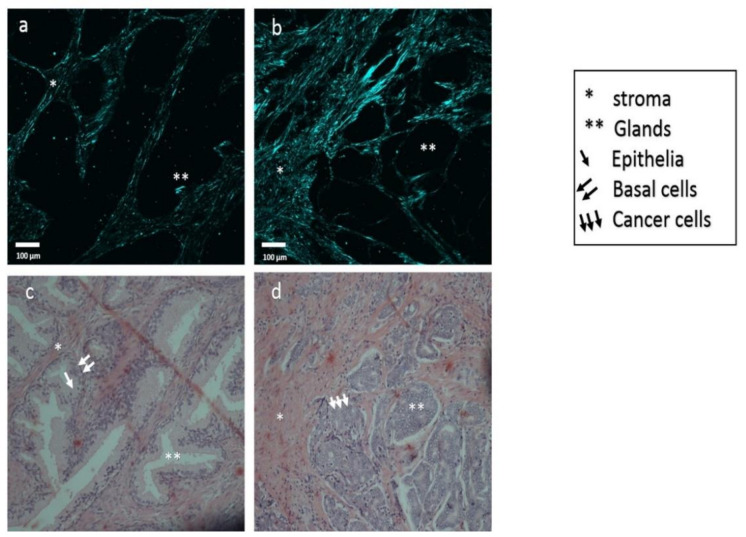
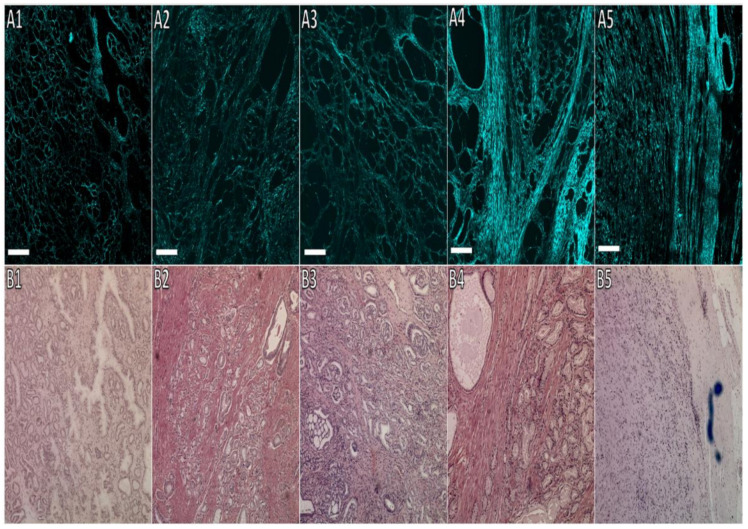
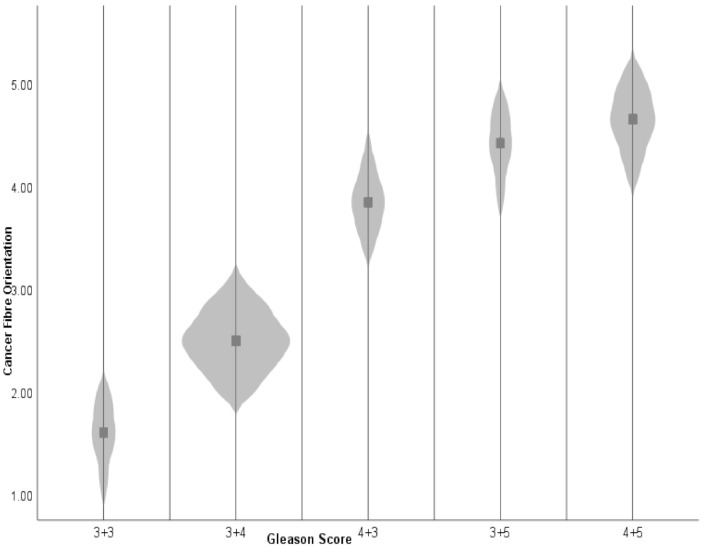
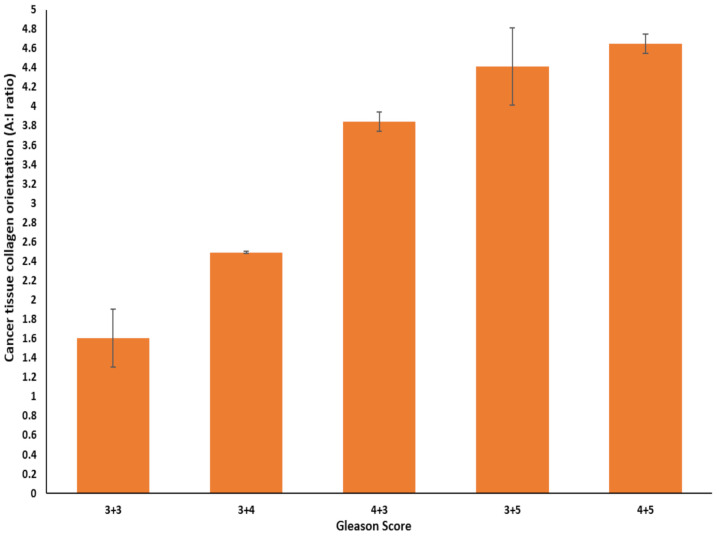
Prostate cancer has a poor prognosis and high mortality rate due to metastases. Extracellular matrix (ECM) re-modelling and stroma composition have been linked to cancer progression, including key components of cell migration, tumour metastasis, and tissue modulus. Moreover, collagens are one of the most significant components of the extracellular matrix and have been ascribed to many aspects of neoplastic transformation. This study characterises collagen re-modelling around localised prostate cancer using the second harmonic generation of collagen (SHG), genotyping and ultrasound shear wave elastography (USWE) measured modulus in men with clinically localised prostate cancer. Tempo-sequence assay for gene expression of COL1A1 and COL3A1 was used to confirm the expression of collagen. Second-harmonic generation imaging and genotyping of ECM around prostate cancer showed changes in content, orientation, and type of collagen according to Gleason grades (cancer aggressivity), and this correlated with the tissue modulus measured by USWE in kilopascals. Furthermore, there were clear differences between collagen orientation and type around normal and cancer tissues.
Keywords: collagen; elastography; prostate; second-generation harmonics; shear wave; ultrasound.
Conflict of interest statement
The authors declare no conflict of interest.
Figures

Similar articles
-
Multimodality Characterization of Cancer-Associated Fibroblasts in Tumor Microenvironment and Its Correlation With Ultrasound Shear Wave-Measured Tissue Stiffness in Localized Prostate Cancer.Front Oncol. 2022 Apr 21;12:822476. doi: 10.3389/fonc.2022.822476. eCollection 2022. Front Oncol. 2022. PMID: 35530322 Free PMC article.
-
Microscale characterization of prostate biopsies tissues using optical coherence elastography and second harmonic generation imaging.Lab Invest. 2018 Mar;98(3):380-390. doi: 10.1038/labinvest.2017.132. Epub 2017 Dec 18. Lab Invest. 2018. PMID: 29251735 Free PMC article. Clinical Trial.
-
Second harmonic generation (SHG) imaging of cancer heterogeneity in ultrasound guided biopsies of prostate in men suspected with prostate cancer.J Biophotonics. 2017 Jun;10(6-7):911-918. doi: 10.1002/jbio.201600090. Epub 2016 Aug 22. J Biophotonics. 2017. PMID: 27545683
-
The Evolving Role of Shear Wave Elastography in the Diagnosis and Treatment of Prostate Cancer.Ultrasound Q. 2018 Dec;34(4):245-249. doi: 10.1097/RUQ.0000000000000385. Ultrasound Q. 2018. PMID: 30531430 Review.
-
Ultrasound elastography of the prostate: state of the art.Diagn Interv Imaging. 2013 May;94(5):551-60. doi: 10.1016/j.diii.2013.01.017. Epub 2013 Apr 19. Diagn Interv Imaging. 2013. PMID: 23607924 Review.
Cited by
-
Fiber Bundle Image Reconstruction Using Convolutional Neural Networks and Bundle Rotation in Endomicroscopy.Sensors (Basel). 2023 Feb 23;23(5):2469. doi: 10.3390/s23052469. Sensors (Basel). 2023. PMID: 36904673 Free PMC article.
-
The Potential of Extracellular Matrix- and Integrin Adhesion Complex-Related Molecules for Prostate Cancer Biomarker Discovery.Biomedicines. 2023 Dec 28;12(1):79. doi: 10.3390/biomedicines12010079. Biomedicines. 2023. PMID: 38255186 Free PMC article. Review.
-
Evidence of the Link between Stroma Remodeling and Prostate Cancer Prognosis.Cancers (Basel). 2024 Sep 21;16(18):3215. doi: 10.3390/cancers16183215. Cancers (Basel). 2024. PMID: 39335188 Free PMC article. Review.
-
Multimodality Characterization of Cancer-Associated Fibroblasts in Tumor Microenvironment and Its Correlation With Ultrasound Shear Wave-Measured Tissue Stiffness in Localized Prostate Cancer.Front Oncol. 2022 Apr 21;12:822476. doi: 10.3389/fonc.2022.822476. eCollection 2022. Front Oncol. 2022. PMID: 35530322 Free PMC article.
-
Melatonin Modulates the SIRT1-Related Pathways via Transdermal Cryopass-Laser Administration in Prostate Tumor Xenograft.Cancers (Basel). 2023 Oct 10;15(20):4908. doi: 10.3390/cancers15204908. Cancers (Basel). 2023. PMID: 37894275 Free PMC article.
References
-
- Hanahan D. Hallmarks of cancer: A 2012 perspective. Ann. Oncol. 2012;23:ix23.
LinkOut - more resources
Full Text Sources
Miscellaneous
