. 2021 Oct 21;22(21):11369.
doi: 10.3390/ijms222111369.

The SR Splicing Factors: Providing Perspectives on Their Evolution, Expression, Alternative Splicing, and Function in Populus trichocarpa

Affiliations

The SR Splicing Factors: Providing Perspectives on Their Evolution, Expression, Alternative Splicing, and Function in Populus trichocarpa

Xijuan Zhao et al. Int J Mol Sci. .

Abstract

Serine/arginine-rich (SR) proteins are important splicing factors in plant development and abiotic/hormone-related stresses. However, evidence that SR proteins contribute to the process in woody plants has been lacking. Using phylogenetics, gene synteny, transgenic experiments, and RNA-seq analysis, we identified 24 PtSR genes and explored their evolution, expression, and function in Popolus trichocarpa. The PtSR genes were divided into six subfamilies, generated by at least two events of genome triplication and duplication. Notably, they were constitutively expressed in roots, stems, and leaves, demonstrating their fundamental role in P. trichocarpa. Additionally, most PtSR genes (~83%) responded to at least one stress (cold, drought, salt, SA, MeJA, or ABA), and, especially, cold stress induced a dramatic perturbation in the expression and/or alternative splicing (AS) of 18 PtSR genes (~75%). Evidentially, the overexpression of PtSCL30 in Arabidopsis decreased freezing tolerance, which probably resulted from AS changes of the genes (e.g., ICE2 and COR15A) critical for cold tolerance. Moreover, the transgenic plants were salt-hypersensitive at the germination stage. These indicate that PtSCL30 may act as a negative regulator under cold and salt stress. Altogether, this study sheds light on the evolution, expression, and AS of PtSR genes, and the functional mechanisms of PtSCL30 in woody plants.

Keywords: Populus trichocarpa; PtSCL30; abiotic stress; alternative splicing; serine/arginine-rich (SR) protein.


Conflict of interest statement

The authors declare no conflict of interest.

Figures

Figure 1
Figure 1
Phylogenetic relationships and exon/intron and domain architectures of SR-family genes in P. trichocarpa and Arabidopsis. Phylogenetics of SR genes. Multiple alignment of the Arabidopsis and P. trichocarpa SR proteins were performed by MAFFT to construct a maximum likelihood (ML) tree by IQ-TREE. (A) The ML tree was assessed by an ultrafast bootstrap with 5000 replicates, and bootstrap values greater than 50% are shown. The six clusters in shaded colors indicate the known conserved subfamilies (i.e., SCL, SC, RSZ, RS2Z, SR, and RS); (B) exon/intron structures of PtSR genes. UTR and CDS indicate the untranslated region and coding sequences, respectively; (C) protein domains of PtSR genes. The visualizations of exon/intron and protein-domain architectures were created by TBtools, using their gene- and protein-information datasets; (D) a heatmap showing the numbers of the six subfamilies of Arabidopsis and P. trichocarpa SR genes.
Figure 2
Figure 2
Chromosomal distribution and expansion events of PtSR gene family. (A) The chromosomal distribution and collinearity gene blocks the containing PtSR genes. The outer circle indicates P. trichocarpa’s 19 chromosomes (Chr) and scaffolds (s), marked with a distribution of PtSR genes; the middle circle indicates gene density on the corresponding chromosomes; and the inner grey curves indicate gene collinearity blocks between and within chromosomes, where the close paralogous pairs of PtSR genes are marked in blue or red curves, according to their expansion events; (B) the frequency of Ks values of the collinearity of gene pairs within the P. trichocarpa genome and between the P. trichocarpa and Arabidopsis genomes. The blue circles indicate the PtSR gene pairs generated by genome triplication event (i.e., γ) before the divergence of P. trichocarpa and Arabidopsis, and the red circles indicate the PtSR gene pairs generated by the recent genome duplication of P. trichocarpa after the divergence from Arabidopsis. The collinearity of the PtSR gene pairs and their Ks values are provided in Table S2.
Figure 3
Figure 3
GO term enrichment and promoter cis-element analysis of PtSR genes. (A) GO term enrichments of PtSR genes. The dot sizes represent the numbers of enriched genes and the colored bars represent the significant levels of GO term enrichment; (B) the numbers of PtSR genes containing various cis-acting elements. Purple, red, and blue bars represent the cis-acting elements in response to abiotic stresses, phytohormones, and the fundamental core elements in PtSR gene promoters, respectively.
Figure 4
Figure 4
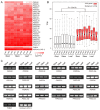
The expression profiles of PtSR genes in P. trichocarpa tissues. (A) A heatmap of the expression profiles of PtSR family genes in roots, stems, and leaves. Transcripts per million reads (TPM) was used to represent the expression of each gene and log2 transformed to generate the heatmap; (B) A boxplot showing expression differences between PtSR genes and background genes. Except for PtSR genes, the other genomic expressed genes were selected as background, and the differential level in expression between PtSR genes and the background was assessed by Wilcoxon test.
Figure 5
Figure 5
The expression profiles of PtSR genes under hormones and abiotic stresses. (A) The expression profile of all 24 PtSR genes. The red-colored PtSR genes represent the genes that were differentially regulated by at least one of the six stresses, and an asterisk above the bars represents a significant difference between treatments and control (* p value < 0.01 and factor of change >2). Error bars represent the standard deviations of three biological replicates; (B) A boxplot showing expression differences of PtSR genes between the treatments and CK control. The differential significance between the treatment and control of each PtSR expression was shown on the corresponding treatment. Relative expression level of PtSR genes were normalized with Histone3 genes HIS-1 (Potri.002G026800) and HIS-2 (Potri.005G072300) under cold (4 °C), drought (20% PEG6000), salt (200 mM NaCl), SA (5 mM), MeJA (1 mM), and ABA (100 μM) treatments.
Figure 6
Figure 6
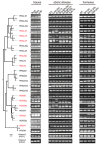
The alternative splicing of PtSR genes in P. trichocarpa tissues and under hormones and abiotic stresses. The left panel indicates the phylogenetics of PtSR genes. The AS patterns of PtSR genes were determined in the tissues (root, stem, and leaf) under normal condition and in leaf tissue under different stress treatments, including cold (4 °C), drought (20% PEG6000), salt (200 mM NaCl), SA (5 mM), MeJA (1 mM), and ABA (100 μM). The red genes labels represent genes that underwent AS events in the tissues and/or under abiotic/hormone stresses. Asterisks represent a basic transcript of the PtSR gene. Primers used for investigating alternative splicing isoforms of PtSR genes were provided in Table S5.
Figure 7
Figure 7
PtSCL30 is involved in the freezing stress response. (A) Freezing tolerance of PtSCL30 overexpression lines (OE2, OE10, and OE16) and wild-type plants (Col-0) after being exposed to −7 °C for 6 h; (B) the survival rate of Col-0 and 35S::PtSCL30 OE lines after being exposed to −7 °C for 6 h. Asterisks indicate significant differences between Col-0 and 35S::PtSCL30 OE lines (** p < 0.01).
Figure 8
Figure 8
Overexpression of PtSCL30 changes the alternative splicing profiles of genes under cold stress. (A) The number of differentially expressed genes (DEGs) and alternatively spliced genes (DASGs) in 35S::PtSCL30 OE lines under cold stress; (B) the AS types and numbers induced by the overexpression of PtSCL30; (C) the GO-enriched network and the relevant DASGs. The big circles indicate the GO terms and the small circles represent the DASGs. The gene network involved in abiotic stress, including cold stress, is shown in red shadow; (D) four examples of DASGs after the overexpression of PtSCL30 under cold stress from RNA-seq data. The RNA-seq coverage (black or blue) and junction reads (on the arcs) for the samples are shown above the reference genes. The differential AS loci are marked in red shadow with their AS type.
Figure 8
Figure 8
Overexpression of PtSCL30 changes the alternative splicing profiles of genes under cold stress. (A) The number of differentially expressed genes (DEGs) and alternatively spliced genes (DASGs) in 35S::PtSCL30 OE lines under cold stress; (B) the AS types and numbers induced by the overexpression of PtSCL30; (C) the GO-enriched network and the relevant DASGs. The big circles indicate the GO terms and the small circles represent the DASGs. The gene network involved in abiotic stress, including cold stress, is shown in red shadow; (D) four examples of DASGs after the overexpression of PtSCL30 under cold stress from RNA-seq data. The RNA-seq coverage (black or blue) and junction reads (on the arcs) for the samples are shown above the reference genes. The differential AS loci are marked in red shadow with their AS type.
Figure 9
Figure 9
Salt and drought tolerance of PtSCL30 transgenic plants. (A) Seed germination assay of Col-0 and 35S::PtSCL30 OE lines growing in 1/2 MS medium supplemented with NaCl; (B,C) Germination rate of Col-0 and 35S::PtSCL30 OE lines under salt treatments; (D) cotyledon-greening rate of Col-0 and 35S::PtSCL30 OE lines under salt treatments; (E) salt tolerance assay of Col-0 and 35S::PtSCL30 OE lines growing in 1/2 MS medium supplemented with NaCl; (F) root length of Col-0 and 35S::PtSCL30 OE lines under salt treatments; (G) drought tolerance assay of Col-0 and 35S::PtSCL30 OE lines growing in 1/2 MS medium supplemented with mannitol; (H) root length of Col-0 and 35S::PtSCL30 OE lines under drought treatments; (I) fresh weight of Col-0 and 35S::PtSCL30 OE lines under drought treatments. Error bars indicate the standard deviation. Asterisks indicate significant different levels between Col-0 and 35S::PtSCL30 OE lines (* p < 0.05 and ** p < 0.01).

Similar articles

Cited by

References

    1. Reddy A.S. Plant serine/arginine-rich proteins and their role in pre-mRNA splicing. Trends Plant Sci. 2004;9:541–547. doi: 10.1016/j.tplants.2004.09.007. - DOI - PubMed
    1. Reddy A.S., Marquez Y., Kalyna M., Barta A. Complexity of the alternative splicing landscape in plants. Plant Cell. 2013;25:3657–3683. doi: 10.1105/tpc.113.117523. - DOI - PMC - PubMed
    1. Wang E.T., Sandberg R., Luo S., Khrebtukova I., Zhang L., Mayr C., Kingsmore S.F., Schroth G.P., Burge C.B. Alternative isoform regulation in human tissue transcriptomes. Nature. 2008;456:470–476. doi: 10.1038/nature07509. - DOI - PMC - PubMed
    1. Nilsen T.W., Graveley B.R. Expansion of the eukaryotic proteome by alternative splicing. Nature. 2010;463:457–463. doi: 10.1038/nature08909. - DOI - PMC - PubMed
    1. Zhu F.Y., Chen M.X., Ye N.H., Shi L., Ma K.L., Yang J.F., Cao Y.Y., Zhang Y., Yoshida T., Fernie A.R., et al. Proteogenomic analysis reveals alternative splicing and translation as part of the abscisic acid response in Arabidopsis seedlings. Plant J. 2017;91:518–533. doi: 10.1111/tpj.13571. - DOI - PubMed