. 2022 Feb;28(2):177-193.
doi: 10.1261/rna.078949.121. Epub 2021 Nov 10.

A conserved arginine in NS5 binds genomic 3' stem-loop RNA for primer-independent initiation of flavivirus RNA replication

Affiliations

A conserved arginine in NS5 binds genomic 3' stem-loop RNA for primer-independent initiation of flavivirus RNA replication

Sai Wang et al. RNA. 2022 Feb.

Abstract

The commitment to replicate the RNA genome of flaviviruses without a primer involves RNA-protein interactions that have been shown to include the recognition of the stem-loop A (SLA) in the 5' untranslated region (UTR) by the nonstructural protein NS5. We show that DENV2 NS5 arginine 888, located within the carboxy-terminal 18 residues, is completely conserved in all flaviviruses and interacts specifically with the top-loop of 3'SL in the 3'UTR which contains the pentanucleotide 5'-CACAG-3' previously shown to be critical for flavivirus RNA replication. We present virological and biochemical data showing the importance of this Arg 888 in virus viability and de novo initiation of RNA polymerase activity in vitro. Based on our binding studies, we hypothesize that ternary complex formation of NS5 with 3'SL, followed by dimerization, leads to the formation of the de novo initiation complex that could be regulated by the reversible zipping and unzipping of cis-acting RNA elements.

Keywords: Dengue NS5 protein; Dengue virus; Dengue virus 3' stem–loop; de novo initiation; flaviral RNA replication.


Figures

FIGURE 1.
FIGURE 1.
Mutational analysis of NS5 carboxy-terminal residues Y838 and R888 in DENV2 by reverse genetics. (A) 3D structure of a DENV3 NS5 monomer (PDB access code: 5CCV.A [Klema et al. 2016]) with an enlarged view of the NS5 carboxy-terminal region showing hydrogen bond formation between Tyrosine 838 and Arginine 888 through their side chains. Replication characteristics of DENV2 WT NS5 and NS5 mutants are shown in BE. BHK-21 cells were electroporated with 10 µg of DENV2 WT or mutant infectious clone RNA and the replication kinetics was followed until 96 h post-transfection. The replication-deficient NS5 mutant GAA was included as negative control. (B) Real-time PCR quantification of intracellular viral RNA at the indicated timepoints. The dotted line represented the detection level for mock-transfected cells. (C) Real-time PCR quantification of extracellular viral RNA in the supernatants of the transfected cells at the indicated timepoints. The dotted line represented the detection level in the supernatant of mock-transfected cells. (D) Virus titer in the supernatants of transfected BHK-21 cells measured by plaque assay. (E) Pictures showing plaque morphologies of DENV2 WT and NS5 mutant viruses. The dilution at which plaques can be observed is indicated. The data in BD are presented as average ± SD from two independent experiments. Differences in intracellular (B) and extracellular (C) viral RNA kinetics between groups were compared by two-way ANOVA with Bonferroni correction. Mean values of the virus titers (D) between WT and the respective mutants are compared by unpaired Student's t-test, and a P-value <0.05 was considered significant (*) P < 0.05, (**) P < 0.01, (****) P < 0.0001.
FIGURE 2.
FIGURE 2.
Subcellular distribution of NS5 and dsRNA in WT and mutant DENV transfected cells. BHK-21 cells were transfected with DENV2 WT (A), R888K (B), and Y838F (C) mutants as in Figure 1B and analyzed at 72 h post-transfection for NS5 (green) and dsRNA (red) by immunofluorescence assay. Digitized images were captured by Zeiss LSM710 upright confocal microscope using a 63× oil immersion lens. The % infectivity is indicated, and the insets in the bottom panes show the zoom-in views of the dotted box regions. Two independent experiments were performed, and the representative images were observed for more than 99% of the cells. Intensity quantification of (D) NS5 and (E) dsRNA fluorescence of WT, R888K, and Y838F infected cells. Data are presented as bar graphs with average ± SD obtained from n = 30 infected cells (nine field images for WT, 24 field images for R888K, and 15 field images for Y838F). Values indicated on top of the bars of graph in D are the % infectivity of the respective viruses. Difference in fluorescence intensity between WT and R888K or Y838F was compared by Student's t-test and a P-value <0.05 was considered significant (*) P < 0.05.
FIGURE 3.
FIGURE 3.
Assessment of primer-independent de novo initiation/elongation and primer-dependent elongation polymerase activities of WT NS5 and mutant. (A) SDS-PAGE analysis of WT NS5 and NS5 mutant recombinant proteins expressed in E. coli and purified by His-tag affinity and size exclusion chromatography. Samples from left to right are (1) protein ladder, (2) WT, (3) Y838F, (4) R888A, (5) R888K, (6) D146A, (7) GAA, (8) D146A + GAA. (B) The cartoon depicts de novo initiation/elongation on the DENV 2 mini-replicon (Zhao et al. 2015b) (left) and elongation from a primed template (right). The de novo initiation/elongation and elongation polymerase activities of NS5 mutants Y838F, R888A, R888K, D146A, GAA, and D146A + GAA are compared with WT NS5 which was normalized to 100%. The data is presented as average ± SD from two to four independent repeat experiments. The statistical significance of difference between the two groups was evaluated by Student's t-test, and a P-value <0.05 was considered significant (≤0.0001, ≤0.001, ≤0.01, ≤0.05 were represented by [****], [***], [**], [*], respectively).
FIGURE 4.
FIGURE 4.
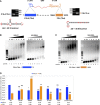
Analysis of DENV2 NS5 binding to 5′ SLA or 3′SL RNA. (A) Schematic illustration of DENV2 genome showing the position, sequence, and size of 5′ terminal stem–loop A (5′ SLA) and 3′ terminal stem–loop (3′SL) within the 5′ and 3′ untranslated regions (UTRs). The purity of the in vitro synthesized and purified 5′ SLA and 3′SL RNA samples were analyzed by agarose gel electrophoresis. Secondary structures of 5′SLA and 3′SL were predicted by mfold web server (Zuker 2003) with the thermodynamic free energy ΔG of the folding process at 37°C indicated. (B,C) RNA electrophoretic mobility shift assay (REMSA) for 5′ SLA (B) or 3′ SL (C) with WT NS5 or NS5 R888A mutant, analyzed on 1.2% agarose gel with lane number indicated at the bottom. Lane 1 in each of the four gels represented 5′ SLA (B) or 3′ SL (C) RNA alone in binding buffer. Lanes 27 represented binding reactions of NS5 with RNA at molar ratios of 0:1, 0.5:1, 1:1, 2:1, 4:1, 8:1, and 16:1 as indicated on top of each lane. (D) Binding affinity of 5′ SLA or 3′ SL with WT NS5 or NS5 mutants Y838F, R888A, D146A, GAA, D146A + GAA reflected by apparent dissociation constant (Kd) was calculated from band intensities using ImageJ from two to four independent repeat experiments represented as average ± SD. The statistical significance of difference between the two groups was evaluated by Student's t-test and a P-value <0.05 was considered significant (≤0.0001, ≤0.001, ≤0.01, ≤0.05 were represented by [****], [***], [**], [*], respectively).
FIGURE 5.
FIGURE 5.
Western blot analysis of WT NS5 binding to biotinylated 5′SLA RNA following coimmunoprecipitation. (A) WT NS5 was incubated with immobilized biotinylated 5′SLA. After excess unbound NS5 was removed, increasing amounts of 3′SL were added (left). Quantitation of the NS5 band was performed using ImageJ and normalized to 100% for the sample with no added 3′SL (right). (B) WT NS5 was incubated with immobilized biotinylated 5′SLA as in A, but increasing amounts of 3′SL were added without removal of excess unbound NS5 (left). Quantitation of the NS5 was done as in (A) (right). Molar ratio of 3′SL to 5′SLA is shown on top of the gel image, and NS5 was detected using the 5M1 antibody. The statistical significance of the difference between two groups was evaluated by Student's t-test and a P-value <0.05 was considered significant (≤0.0001, ≤0.001, ≤0.01, ≤0.05 were represented by [****], [***], [**], [*], respectively).
FIGURE 6.
FIGURE 6.
Analysis of 3′SL RNA interaction with WT and mutant NS5 by coimmunoprecipitation and dynamic light scattering. (A) Western blot analysis showing pull-down of WT NS5, R888A mutant, and GAA mutant through 3′SL RNA immobilized on streptavidin Sepharose beads or the “no-RNA” mock coupled Sepharose beads as control. NS5 was detected by in-house 5M1 antibody (ref) which recognizes the MTase domain. (B) Quantification of pull-down WT, R888A, and GAA with the amount of WT normalized to 100%. The data were represented as average ± SD from two independent repeat experiments. The statistical significance of difference between the two groups was evaluated by Student's t-test and a P-value <0.05 was considered significant (≤0.0001, ≤0.001, ≤0.01, ≤0.05 were represented by [****], [***], [**], [*], respectively). (C,D) Intensity-based size distribution profiles from dynamic light scattering (DLS) experiments showing 3′SL RNA, NS5 WT, or molar ratio 1:1 mixture of NS5 and 3′SL complex (C) or R888A mutant (D) and the molar ratio 1:1 mixture of NS5 R888 and 3′SL. The DLS experiments were repeated twice with similar size distribution profiles for each sample.
FIGURE 7.
FIGURE 7.
Analysis of DENV2 NS5 binding to 3′SL RNA and 3′SL RNA with top-loop or side-loop deletion. (A) Secondary structures of 3′SL RNA and 3′SL with deleted top lop (3′SL-TLdel) or side-loop (3′SL-SLdel) were predicted by mfold web server with folding free energy ΔG at 37°C shown below. Corresponding RNA samples produced by in vitro transcription followed by purification were analyzed by agarose gel electrophoresis. (B,C) RNA electrophoretic mobility shift assay (REMSA) for NS5 WT (B) or R888A mutant (C) with 3′ SL, 3′SL-TLdel, or 3′SL-SLdel analyzed on 1.2% agarose gel with lane number indicated at the bottom. Lanes 2, 8, and 15 in both gels represented 3′SL, 3′SL-TLdel, 3′SL-SLdel RNA alone in binding buffer. Lanes 37, 913, and 1519 represented binding reactions of NS5 with RNA at molar ratios of 0:1, 1:1, 2:1, 4:1, 8:1, and 16:1 as indicated on top of each lane. The REMSA experiments were performed three times with similar results. (D) Binding affinity of WT NS5 or R888A mutant with 3′ SL, 3′SL-TLdel, or 3′SL-SLdel reflected by apparent dissociation constant (Kd) was calculated from three independent repeat experiments represented as average ± SD. The statistical significance of difference between the two groups was evaluated by Student's t-test and a P-value <0.05 was considered significant (≤0.0001, ≤0.001, ≤0.01, ≤0.05 were represented by [****], [***], [**], [*], respectively).
FIGURE 8.
FIGURE 8.
A mechanistic model of de novo initiation and elongation of flavivirus genomic RNA, highlighting the critical events of genome circularization, NS5 dimerization, and UFS-mediated de novo initiation and elongation (see text for details). NS5 (green) bound to 5′ UTR (SLA and SLB) is well established by Gamarnik group (Filomatori et al. 2006, 2011; Lodeiro et al. 2009) and the present study showed the specific interaction between a molecule of NS5 (purple) through R888 at its carboxy-terminal region and the top-loop of 3′SL. Long-range RNA interactions within the open reading frame region (Huber et al. 2019) juxtaposes the 5′ and 3′ CS and DAR for RNA cyclization supported by NS5–RNA complex formation. The cis-acting tunable UFS region ensures primer-independent RNA replication by serving as a gate keeper to ensure the formation of a productive stable de novo initiation complex that can carry out processive RNA replication in concert with viral and host proteins.
Sai Wang
Sai Wang

Similar articles

Cited by

References

    1. Akiyama BM, Laurence HM, Massey AR, Costantino DA, Xie X, Yang Y, Shi PY, Nix JC, Beckham JD, Kieft JS. 2016. Zika virus produces noncoding RNAs using a multi-pseudoknot structure that confounds a cellular exonuclease. Science 354: 1148–1152. 10.1126/science.aah3963 - DOI - PMC - PubMed
    1. Alvarez DE, De Lella Ezcurra AL, Fucito S, Gamarnik AV. 2005a. Role of RNA structures present at the 3′UTR of dengue virus on translation, RNA synthesis, and viral replication. Virology 339: 200–212. 10.1016/j.virol.2005.06.009 - DOI - PubMed
    1. Alvarez DE, Lodeiro MF, Ludueña SJ, Pietrasanta LI, Gamarnik AV. 2005b. Long-range RNA-RNA interactions circularize the dengue virus genome. J Virol 79: 6631–6643. 10.1128/JVI.79.11.6631-6643.2005 - DOI - PMC - PubMed
    1. Appleby TC, Perry JK, Murakami E, Barauskas O, Feng J, Cho A, Fox D, Wetmore DR, McGrath ME, Ray AS, et al. 2015. Structural basis for RNA replication by the hepatitis C virus polymerase. Science 347: 771. 10.1126/science.1259210 - DOI - PubMed
    1. Ashour J, Laurent-Rolle M, Shi P-Y, García-Sastre A. 2009. NS5 of dengue virus mediates STAT2 binding and degradation. J Virol 83: 5408. 10.1128/JVI.02188-08 - DOI - PMC - PubMed

Publication types