Association of cardiometabolic microRNAs with COVID-19 severity and mortality
- PMID: 34755842
- PMCID: PMC8689968
- DOI: 10.1093/cvr/cvab338
Association of cardiometabolic microRNAs with COVID-19 severity and mortality
Abstract
Aims: Coronavirus disease 2019 (COVID-19) can lead to multiorgan damage. MicroRNAs (miRNAs) in blood reflect cell activation and tissue injury. We aimed to determine the association of circulating miRNAs with COVID-19 severity and 28 day intensive care unit (ICU) mortality.
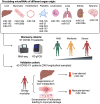
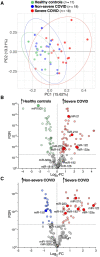
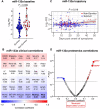
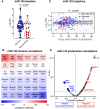
Methods and results: We performed RNA-Seq in plasma of healthy controls (n = 11), non-severe (n = 18), and severe (n = 18) COVID-19 patients and selected 14 miRNAs according to cell- and tissue origin for measurement by reverse transcription quantitative polymerase chain reaction (RT-qPCR) in a separate cohort of mild (n = 6), moderate (n = 39), and severe (n = 16) patients. Candidates were then measured by RT-qPCR in longitudinal samples of ICU COVID-19 patients (n = 240 samples from n = 65 patients). A total of 60 miRNAs, including platelet-, endothelial-, hepatocyte-, and cardiomyocyte-derived miRNAs, were differentially expressed depending on severity, with increased miR-133a and reduced miR-122 also being associated with 28 day mortality. We leveraged mass spectrometry-based proteomics data for corresponding protein trajectories. Myocyte-derived (myomiR) miR-133a was inversely associated with neutrophil counts and positively with proteins related to neutrophil degranulation, such as myeloperoxidase. In contrast, levels of hepatocyte-derived miR-122 correlated to liver parameters and to liver-derived positive (inverse association) and negative acute phase proteins (positive association). Finally, we compared miRNAs to established markers of COVID-19 severity and outcome, i.e. SARS-CoV-2 RNAemia, age, BMI, D-dimer, and troponin. Whilst RNAemia, age and troponin were better predictors of mortality, miR-133a and miR-122 showed superior classification performance for severity. In binary and triplet combinations, miRNAs improved classification performance of established markers for severity and mortality.
Conclusion: Circulating miRNAs of different tissue origin, including several known cardiometabolic biomarkers, rise with COVID-19 severity. MyomiR miR-133a and liver-derived miR-122 also relate to 28 day mortality. MiR-133a reflects inflammation-induced myocyte damage, whilst miR-122 reflects the hepatic acute phase response.
Keywords: Biomarkers; COVID-19; MicroRNAs; Proteomics; RNA-Seq; SARS-CoV-2.
© The Author(s) 2021. Published by Oxford University Press on behalf of the European Society of Cardiology.
Figures


Similar articles
-
Circulating microRNA signatures associated with disease severity and outcome in COVID-19 patients.Front Immunol. 2022 Aug 11;13:968991. doi: 10.3389/fimmu.2022.968991. eCollection 2022. Front Immunol. 2022. PMID: 36032130 Free PMC article.
-
Addressing the unsolved challenges in microRNA-based biomarker development: Suitable endogenous reference microRNAs for SARS-CoV-2 infection severity.Int J Biol Macromol. 2024 Jun;269(Pt 2):131926. doi: 10.1016/j.ijbiomac.2024.131926. Epub 2024 Apr 28. Int J Biol Macromol. 2024. PMID: 38688344
-
Thrombosis-related circulating miR-16-5p is associated with disease severity in patients hospitalised for COVID-19.RNA Biol. 2022 Jan;19(1):963-979. doi: 10.1080/15476286.2022.2100629. RNA Biol. 2022. PMID: 35938548 Free PMC article.
-
Alterations in Circulating miRNA Levels after Infection with SARS-CoV-2 Could Contribute to the Development of Cardiovascular Diseases: What We Know So Far.Int J Mol Sci. 2023 Jan 25;24(3):2380. doi: 10.3390/ijms24032380. Int J Mol Sci. 2023. PMID: 36768701 Free PMC article. Review.
-
Role of miRNAs as biomarkers of COVID-19: a scoping review of the status and future directions for research in this field.Biomark Med. 2021 Dec;15(18):1785-1795. doi: 10.2217/bmm-2021-0348. Epub 2021 Nov 17. Biomark Med. 2021. PMID: 34784802 Free PMC article. Review.
Cited by
-
Circulating microRNA signatures associated with disease severity and outcome in COVID-19 patients.Front Immunol. 2022 Aug 11;13:968991. doi: 10.3389/fimmu.2022.968991. eCollection 2022. Front Immunol. 2022. PMID: 36032130 Free PMC article.
-
Dysregulated miRNAs network in the critical COVID-19: An important clue for uncontrolled immunothrombosis/thromboinflammation.Int Immunopharmacol. 2022 Sep;110:109040. doi: 10.1016/j.intimp.2022.109040. Epub 2022 Jul 11. Int Immunopharmacol. 2022. PMID: 35839566 Free PMC article. Review.
-
Cross-Linking Mass Spectrometry Uncovers Interactions Between High-Density Lipoproteins and the SARS-CoV-2 Spike Glycoprotein.Mol Cell Proteomics. 2023 Aug;22(8):100600. doi: 10.1016/j.mcpro.2023.100600. Epub 2023 Jun 19. Mol Cell Proteomics. 2023. PMID: 37343697 Free PMC article.
-
Therapeutic prospects of ceRNAs in COVID-19.Front Cell Infect Microbiol. 2022 Sep 20;12:998748. doi: 10.3389/fcimb.2022.998748. eCollection 2022. Front Cell Infect Microbiol. 2022. PMID: 36204652 Free PMC article. Review.
-
In silico identification of potential miRNAs -mRNA inflammatory networks implicated in the pathogenesis of COVID-19.Hum Gene (Amst). 2023 May;36:201172. doi: 10.1016/j.humgen.2023.201172. Epub 2023 Apr 11. Hum Gene (Amst). 2023. PMID: 37520333 Free PMC article.
References
-
- Sunderland N, Skroblin P, Barwari T, Huntley RP, Lu R, Joshi A, Lovering RC, Mayr M.. MicroRNA biomarkers and platelet reactivity. Circ Res 2017;120:418–435. - PubMed
-
- Schulte C, Barwari T, Joshi A, Theofilatos K, Zampetaki A, Barallobre-Barreiro J, Singh B, Sörensen NA, Neumann JT, Zeller T, Westermann D, Blankenberg S, Marber M, Liebetrau C, Mayr M.. Comparative analysis of circulating noncoding RNAs versus protein biomarkers in the detection of myocardial injury. Circ Res 2019;125:328–340. - PMC - PubMed
Publication types
MeSH terms
Substances
Grants and funding
- FC001093/CRUK_/Cancer Research UK/United Kingdom
- CH/1999001/11735/BHF_/British Heart Foundation/United Kingdom
- RE/18/2/34213/BHF_/British Heart Foundation/United Kingdom
- FS/18/60/34181/BHF_/British Heart Foundation/United Kingdom
- FC001093/WT_/Wellcome Trust/United Kingdom
- MR/V040162/1/MRC_/Medical Research Council/United Kingdom
- CH/16/3/32406/BHF_/British Heart Foundation/United Kingdom
- MR/R017751/1/MRC_/Medical Research Council/United Kingdom
- RG/16/14/32397/BHF_/British Heart Foundation/United Kingdom
- WT_/Wellcome Trust/United Kingdom
- FC001093/ARC_/Arthritis Research UK/United Kingdom
LinkOut - more resources
Full Text Sources
Medical
Molecular Biology Databases
Research Materials
Miscellaneous

