Review
. 2021 Oct;73(4):298-487.
doi: 10.1124/pharmrev.120.000131.

Structure, Function, and Pharmacology of Glutamate Receptor Ion Channels

Affiliations
Review

Structure, Function, and Pharmacology of Glutamate Receptor Ion Channels

Kasper B Hansen et al. Pharmacol Rev. 2021 Oct.

Abstract

Many physiologic effects of l-glutamate, the major excitatory neurotransmitter in the mammalian central nervous system, are mediated via signaling by ionotropic glutamate receptors (iGluRs). These ligand-gated ion channels are critical to brain function and are centrally implicated in numerous psychiatric and neurologic disorders. There are different classes of iGluRs with a variety of receptor subtypes in each class that play distinct roles in neuronal functions. The diversity in iGluR subtypes, with their unique functional properties and physiologic roles, has motivated a large number of studies. Our understanding of receptor subtypes has advanced considerably since the first iGluR subunit gene was cloned in 1989, and the research focus has expanded to encompass facets of biology that have been recently discovered and to exploit experimental paradigms made possible by technological advances. Here, we review insights from more than 3 decades of iGluR studies with an emphasis on the progress that has occurred in the past decade. We cover structure, function, pharmacology, roles in neurophysiology, and therapeutic implications for all classes of receptors assembled from the subunits encoded by the 18 ionotropic glutamate receptor genes. SIGNIFICANCE STATEMENT: Glutamate receptors play important roles in virtually all aspects of brain function and are either involved in mediating some clinical features of neurological disease or represent a therapeutic target for treatment. Therefore, understanding the structure, function, and pharmacology of this class of receptors will advance our understanding of many aspects of brain function at molecular, cellular, and system levels and provide new opportunities to treat patients.


Figures

Fig. 1
Fig. 1
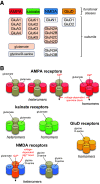
Structural and functional diversity of iGluRs. (A) Ionotropic glutamate receptors are divided into four functional classes: AMPA, kainate, NMDA, and GluD receptors. Multiple subunits have been cloned in each of these classes that bind either glutamate or glycine/D-serine. (B) Subunits from separate functional classes are unable to assemble as functional ion channels, but subunits within each functional class can assemble guided by specific sets of rules. AMPA receptor subunits can form functional homomers and heteromers, but GluA2-containing heteromers prevail throughout the CNS. Kainate receptor subunits GluK1-3 can assemble as functional homomers and heteromers, but GluK4-5 must coexpress with GluK1-3 to form functional receptors. NMDA receptors are strictly heteromeric receptors with two GluN1 subunits and two GluN2 subunits (GluN1/2) or two GluN3 subunits (GluN1/3). Triheteromeric NMDA receptors (not shown) contain two GluN1 subunits and two different GluN2 subunits (i.e., three types of subunits). GluD subunits form homomers that appear incapable of mediating ionotropic signaling.
Fig. 2
Fig. 2
Common architecture of iGluRs. (A and B) Linear representation of the iGluR subunit polypeptide chain and cartoon of the iGluR subunit topology, illustrating the NTD, the S1 and S2 segments that together form the ABD, the TMD formed by M1-M2-M3 and M4, and the CTD. (C and D) Structures of distinct subunit conformations adopted in homomeric GluA2 receptors with similarly oriented ABDs. Oval in (C) indicates the NTD-ABD interface that is present in subunit positions A and C but not in positions B and D. Different orientations of NTD and TMD in subunit B compared with subunit A are indicated in (D). (E) Structure of GluA2 homomer (PDB: 3KG2) viewed parallel to the membrane, with interfaces indicated by ovals and labeled with numbers that increase as the interface surface area decreases. (F–H) The NTD (F), ABD (G), and TMD (H) layers viewed extracellularly perpendicular to the membrane, with the black ovals indicating the receptor overall (larger symbols at dimer-dimer interface) and NTD and ABD dimers local (smaller symbols within dimers) 2-fold rotational symmetry and black square indicating the 4-fold symmetry of the TMD layer. The subunit domains arrange as dimer-of-dimers, but switch dimer partner between the ABD and NTD layers (i.e., subunit crossover).
Fig. 3
Fig. 3
Representative structures of iGluR subtypes. (A) Homomeric GluA2 AMPA receptor in complex with competitive antagonist ZK 200775 (ZK) (PDB: 3KG2). (B) Homomeric GluK2 kainate receptor in complex with agonist SYM2081 (MG) (PDB: 5KUF). (C) GluN1/2B NMDA receptor in complex with Glu and Gly and the allosteric inhibitor ifenprodil (PDB: 4PE5). (D) Homomeric GluD1 receptor in complex with Ca2+ and the competitive antagonist 7-CKA (ligands not resolved) (PDB: 6KSS). The upper row shows iGluRs viewed parallel to the membrane, and the lower row shows ABD layers viewed extracellularly (GluK2 is presumably in the desensitized state). Black ovals indicate the receptor overall (larger symbols at dimer-dimer interface) and NTD and ABD dimers local (smaller symbols within dimers) 2-fold rotational symmetry, and black square indicates the 4-fold symmetry. GluD1 is unique by not having domain swapping between ABD and NTD layers.
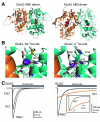
Fig. 4
Fig. 4
Conformational changes in the AMPA receptor ABDs during activation and desensitization. Crystal structures of the GluA2 ABD homodimer in conformations representing the resting apo state (PDB: 1FT0), the activated glutamate-bound state (PDB: 1FTJ), and the desensitized state (PDB: 2I3V). The ABDs are shaped as bilobed structures, with the agonist binding site located within the cleft between the two lobes referred to as D1 and D2. The Gly-Thr (GT) peptide linker positioned at the bottom of D2 replaces the TMDs in the full-length subunits. Agonist binding induces cleft closure in the ABD, thereby separating the linkers that replace the TMD. By contrast, the Cα-Cα distance between Gly residues at the top of the dimer remains relatively unchanged between apo and glutamate-bound ABD structures. After glutamate binding and ABD cleft closure, separation of the linkers can trigger reorientation of the transmembrane helices and channel opening. The activated receptor conformation is unstable, resulting in either reopening of the ABD or rearrangement at the ABD dimer interface, which results in desensitization by permitting repositioning the transmembrane helices to close the channel while glutamate remains bound.
Fig. 5
Fig. 5
Transmembrane domain topology of iGluRs. (A) Organization within a single subunit monomer illustrating the general arrangement of the upper and lower lobes of the ABD (D1 and D2), the TMD, and the ABD-TMD (ABD-TMD linkers) (PDB: 5WEK). (B) Side view of TMD composed of M1, M3, and M4 transmembrane helices and the membrane re-entrant loop M2. Only the two subunits at positions B and D of the receptor are shown. (C) Cytoplasmic view of the TMD through the central ion channel pore. (D) Key functional features of the TMD pore. The M3 segments contain SYTANLAAF, the most highly conserved motif in iGluRs. At their apex, the M3 segments form an activation gate that prevents the flux of ions in the closed state. The M2 pore loop forms the narrow constriction. (E) M4 wrapping, in which the M4 segment of one subunit is associated with the M1-M2-M3 segment of an adjacent subunit. In AMPA receptors, the M4 is required for receptor assembly, which is presumably stabilized by interactions between M4 and M1-M2-M3 of an adjacent subunit. Positions in M4 where single Trp substitutions block tetramerization are located along a specific face of the helix (red), referred to as “VLGAVE” (V, valine; L, leucine; G, glycine; A, alanine; V, valine; E, glutamate).
Fig. 6
Fig. 6
Interactions with scaffolding, anchoring, adaptor, and signaling protein complexes in the postsynaptic density (PSD). Depictions of representative CTD binding partners for NMDA receptors (top, left), AMPA receptors (top, right), GluD receptors (bottom, left), and kainate receptors (bottom, right). Note PSD interactions are only shown for select iGluR subunits as indicated and PDZ domain scaffold proteins (medium blue), other scaffolding proteins (peach), kinase/phosphatase anchoring proteins (aqua), protein kinases (green), protein phosphatases (red), second messenger-generating enzymes (dark gray), regulators of small GTPases (light yellow), adaptor proteins (olive), ATPase trafficking regulator (light purple), and F-actin (orange). GKAP, guanylate kinase-associated protein; NSF, N-ethylmaleimide sensitive factor; PICK1, protein interacting with PRKCA 1; Pyk, proline-rich tyrosine kinase; SAP, synapse-associated protein; SHANK, SH3 and multiple ankyrin repeat domains protein; SPAR, spine-associated RapGAP; STEP, striatal-enriched protein tyrosine phosphatase; SynGAP, synaptic Ras GTPase-activating protein; nNOS, neuronal nitric oxide synthase.
Fig. 7
Fig. 7
RNA editing and alternative splicing of iGluR subunits. Linear depictions of the polypeptide chains illustrate sites of amino acid changes resulting from RNA editing (indicated by arrows) and isoforms resulting from alternative RNA splicing (indicated by dashed lines). The subunits are not scaled accurately but indicate the relative sizes. (A) AMPA receptor subunits exist as either flip or flop isoforms that differ in the S2 region of the ABD. Alternative splicing also produces two isoforms of GluA2 and GluA4 with different lengths of their CTDs. RNA editing at the Gln/Arg (Q/R; also denoted Q/R/N) site in the M2 region of GluA2 regulates Ca2+ permeability and channel rectification of GluA2-containing AMPA receptors. GluA3 and GluA4 also undergo RNA editing at the Arg/Gly (R/G) site in the S2 region of the ABD. (B) Alternative splicing results in GluK1 isoforms with (GluK1-1) or without (GluK1-2) an insertion in the NTD. GluK1-3 also have variable CTDs as a result of alternative splicing. GluK1 and GluK2 undergo RNA editing at Q/R site in the M2 region, similar to GluA2. GluK2 undergoes additional RNA editing at Ile/Val (I/V) and Tyr/Cys (Y/C) sites in the M1 region. (C) GluN1 exists in 8 different isoforms because of alternative splicing of exon 5, exon 21, and exon 22; N1 (21 aa) in the NTD is encoded by exon 5, and C1 (37 aa) in the CTD is encoded by exon 21, whereas C2 (38 aa) in the CTD is encoded by exon 22. Deletion of exon 22 creates a shift in the open reading frame, resulting in the alternate exon 22′ that encodes C2′ (22 aa). GluN2A exists in two isoforms with short and long CTDs, although the short form appears to be primate-specific (i.e., not found in rodents). Alternative splicing creates the GluN3A-L isoform with a 20-aa insertion in the CTD, but this long isoform is not found in human. (D) GluD subunits do not appear to exist in multiple isoforms.
Fig. 8
Fig. 8
Functional effects of different classes of AMPA receptor auxiliary subunits. The top panel illustrates membrane topologies of AMPA receptor auxiliary subunits (CKAMPs and SynDIG4 are based on prediction). The lower panel summarizes functional characteristics of AMPA receptors associated with the respective auxiliary subunits. Adapted with permission from Kamalova and Nakagawa (2021).
Fig. 9
Fig. 9
Examples of the action of AMPA receptor auxiliary subunits. (A) Recordings from cerebellar granule cells from wild type and stargazer (stg) mice that lack TARP γ-2. Left panel: whole cell synaptic currents evoked by mossy fiber stimulation. A near-complete loss of AMPA receptor-mediated synaptic transmission was observed in stg mice (slower NMDA receptor component remains). Right panel: Spontaneous synaptic currents were significantly reduced in homozygous stg/stg mice compared with heterozygous +/stg mice. (B) Outside-out patch-clamp recording of recombinant GluA4 and GluA4 with TARP γ-2 (stg) expressed in HEK cells. Receptors were activated by fast glutamate application and single-channel unitary currents were resolved in the tails of peak currents. Longer bursts or clusters of openings were observed in in the presence of the TARP γ-2. (C) Right panel: whole cell current recordings from hippocampal CA1 pyramidal cells evoked by stimulation of Schaffer collaterals before and after LTP induction in wild type (+/+) and TARP γ-8 KO mice. Left panel: average amplitudes of evoked synaptic responses before and after the induction of LTP. (D) Whole-cell current recordings from mossy hilar cells in the hippocampus. Spontaneous synaptic currents were compared between cells treated with short hairpin RNA (shRNA) of CNIH2 (red and blue are different cells) and untreated wild-type cells. Reproduced with permission from Hashimoto et al. (1999) (Copyright 1999 Society for Neuroscience) (A), Chen et al. (2000) (A), Tomita et al. (2005a) (B), Rouach et al. (2005) (C), and Boudkkazi et al. (2014) (D).
Fig. 10
Fig. 10
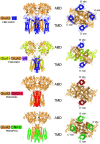
Structures of AMPA receptor in complex with various auxiliary subunits. Ribbon diagrams are derived from cryo-EM maps of AMPA receptors in complex with TARP γ-2 (PDB: 5WEO), TARP γ-8 (PDB: 6QKC), GSG1L (PDB:5WEL), and CNIH3 (PDB: 6PEQ). Only the ABD and TMD of the AMPA receptor tetramers (GluA2: light orange, GluA1: light yellow) are shown. Side (left) and bottom (right) views are displayed. γ-2, γ-8, GSG1L, and CNIH3 bind to identical surfaces of AMPA receptor tetramer. The binding sites are indicated as A′, B′, C′, and D′ site. The overall 2-fold symmetric architecture of AMPA receptor tetramers produces two types of binding interfaces: the equivalent B′/D′ sites and equivalent A′/C′ sites.
Fig. 11
Fig. 11
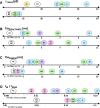
Gating modulation of GluA1 and GluA1/GluA2 AMPA receptors by auxiliary subunits. (A) Channel conductance (γMEAN), (B) deactivation time constant (TauDEACTIVATE), (C) desensitization time constant (TauDESENS), and (D) ratio of amplitudes of steady state (ISS) over peak currents (IPEAK) are depicted by the location of the colored balloon that represents various auxiliary subunits in complex with the indicated receptor. The upper number line represents effects on the homomeric GluA1 (A1), whereas the lower number line represents effects on the heteromeric GluA1/2 (A1/A2). The white balloons indicate values for AMPA receptors without any auxiliary subunits. Values are from Table 2 and associated references. GL, GSG1L; CN, CNIH; CK, CKAMP; SD, SynDIG4. TARP subtypes are indicated as γ-2, γ-3, γ-4, γ-5 and γ-8.
Fig. 12
Fig. 12
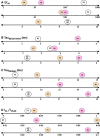
Gating modulation of GluK1, GluK2, and GluK2/GluK5 kainate receptors by Neto auxiliary subunits. (A) Glutamate EC50 (µM), (B) deactivation time constant (TauDEACTIVATE), (C) desensitization time constant (TauDESENS), and (D) ratio of amplitudes of steady state (ISS) over peak currents (IPEAK) are depicted by the location of the colored balloon that represents Neto1 (N1, orange) and Neto2 (N2, red) auxiliary subunits. White balloons indicate values for kainate receptors without auxiliary subunits. Values are from Table 3 and associated references.
Fig. 13
Fig. 13
Neto proteins modulate kainate receptor function. (A) Architecture of the Neto proteins is shown, adapted with permission from Copits and Swanson (2012). (B) The response time course of heteromeric GluK2/5 receptors to brief 1–2 milliseconds (arrow) or prolonged application of glutamate in the absence (black) and presence (red) of Neto1. (C) The response time course of GluK2/5 to brief 1–2 milliseconds (arrow) or prolonged application of glutamate in the absence (black) and presence (blue) of Neto2. Adapted with permission from Straub et al. (2011a) and Straub et al. (2011b). See Table 3 for time constants describing deactivation and desensitization.
Fig. 14
Fig. 14
Time course of glutamate receptor–mediated EPSCs. (A) The average waveform for synaptic mEPSCs recorded from a hippocampal CA1 pyramidal cell in tetrodotoxin and 0.1 mM Mg2+; shaded area is the S.E.M. The AMPA receptor–mediated mEPSCs were isolated by inclusion of the NMDA receptor antagonist AP5, and NMDA receptor-mediated mEPSCs were the difference current in the absence and presence of AP5. Reproduced with permission from Perszyk et al. (2016). (B) Evoked mossy fiber synaptic currents recorded in hippocampal CA3 pyramidal neurons were mediated by AMPA receptors (black, VHOLD −70 mV) and kainate receptors (red) revealed by 50 µM GYKI 53655. The NMDA receptor-mediated component (blue) was recorded at +40 mV in CNQX. Modified from Straub et al. (2016) and unpublished data from Toshihiro Nomura and Anis Contractor. (C) The left panel shows an evoked AMPA receptor–mediated EPSC from a cerebellar unipolar brush cell. The right panel illustrates multiple release sites from a cerebellar mossy fiber onto a unipolar brush cell with synaptic geometry that restricts diffusion and confines glutamate to the synaptic space, thereby prolonging the postsynaptic response, especially after a train of EPSCs. Reproduced with permission from Kinney et al. (1997).
Fig. 15
Fig. 15
Glutamate receptor response time course. (A1) Responses to glutamate applications (gray bars) from GluA4 + γ-5 in an outside-out patch (VHOLD −60 mV). Reproduced with permission from Soto et al. (2009). (A2) Ten individual responses from a single GluA4-γ-2 tandem receptor in an outside-out patch (VHOLD, −100 mV) illustrate random channel activation and occasional lack of openings despite saturating glutamate that will produce full receptor occupancy. Reproduced with permission from Zhang et al. (2014a). (B1) Response from GluK2 with and without Neto2 in an outside-out patch (VHOLD −100 mV) illustrates rapid and intermediate time course of desensitization. (B2) Ten individual responses from a single GluK2+Neto2 receptor in an outside-out patch (−100 mV) illustrate an occasional lack of channel openings despite saturating glutamate. Reproduced with permission from Zhang et al. (2009b). (C1) Normalized whole-cell current responses from GluN1/2A, GluN1/2B, or GluN1/2A/2B receptors (VHOLD −60 mV) to 5-millisecond glutamate application. Reproduced with permission from Hansen et al. (2014). (C2) Ten individual responses from a single GluN1/2B receptor in an outside-out patch (VHOLD −80 mV) illustrate occasional lack of channel openings despite full agonist occupancy. Reproduced with permission from Erreger et al. (2005a). Glycine was present in all solutions.
Fig. 16
Fig. 16
Multiple conductance levels of AMPA receptors. Upper panel: Schematic of slow NBQX unbinding from an AMPA receptor, which allows the time course of channel activation by glutamate to be observed. Lower panel: Response from a single GluA1 + γ-2 (tandem) receptor in an outside-out patch that has NBQX bound to all subunits after rapid exchange into a solution lacking NBQX and containing 10 mM glutamate (VHOLD −60 mV). Each of four antagonist unbinding events is evident as glutamate occupies the available site following NBQX dissociation, which enables the opening to an individual sublevel, with chord conductance given (in pS). Reproduced with permission from Coombs et al. (2017).
Fig. 17
Fig. 17
Single-channel properties of triheteromeric NMDA receptors. (A) Unitary currents for GluN1/2A, GluN1/2C, and GluN1/2A/2C NMDA receptors (VHOLD −80 mV). Openings of diheteromeric GluN1/2A and triheteromeric GluN1/2A/2C receptors are clustered into bursts (gray bars) separated by inactive periods. In contrast, openings of diheteromeric GluN1/2C receptors show no apparent burst structure. (B) Unitary currents in (A) are expanded to illustrate multiple conductance levels with direct sublevel transitions (asterisks). (C) Fitted amplitude histograms for GluN1/2A (left axis), GluN1/2A/2C (right axis), or GluN1/2C receptors (right axis) were fitted by the sum of 2–3 Gaussian distributions (smooth lines). (D) Representative open duration histograms for GluN1/2A, GluN1/2C, and GluN1/2A/2C receptors were fitted by multiple exponential components. Reproduced with permission from Bhattacharya et al. (2018).
Fig. 18
Fig. 18
The mechanism linking agonist binding to channel opening at the M3 gate. (A) Structure of GluA2 AMPA receptor illustrates the different subunit positions within the tetramer, termed A/C (occupied by GluN1 in NMDA receptors, blue) and B/D (occupied by GluN2, gray). The green arrows illustrate the glutamate binding site within the bilobed, clamshell-like ABD (PDB: 5WEK). (B1) Clamshell arrangement of an ABD dimer (left) and the two A/C (middle) and B/D (right) ABDs bound to glutamate, which produces clamshell closure. (B2) The left panel shows resting arrangement of the M3-S2 linkers and the M3/M2 membrane regions, which form the core of the ion permeation pathway. M1 and M4 transmembrane helices are omitted for clarity. The middle panel illustrates how agonist binding repositions the M3 helices of the A/C subunits, with a movement vertically displaced (red) distal to the extracellular surface of the membrane. The right panel illustrates how glutamate binding to the B/D subunits laterally displaces the M3 helices (red), causing a splaying at the Ala within the SYTANLAAF conserved motif. (B3) View of the extracellular side of the ion channel down the axis of the permeation path for closed (PDB: 5WEK) and open receptors (PDB: 5WEO). The side chains of Thr625, which form part of M3 activation gate, are shown.
Fig. 19
Fig. 19
Agonist-induced displacements of the outer structures prime the channel for pore opening. (A) Top-down view of a cartoon representation of the gating triad comprising the pre-M1 helix, the M3 helix, and the pre-M4 linker of the adjacent subunit. The cartoon illustrates two distinct steps required for channel opening that include movement of the pre-M1 helix and repositioning of the M4 linker (green, Pre-active state) that is hypothesized to occur prior to a secondary repositioning of the M3 helix and splaying at the Ala hinge (red) to reach the Active state and open the channel pore. (B) The GluN2 (B/D position in the tetramer) pre-M1 helix that lies parallel to the membrane, the GluN2 M3 transmembrane helix, and the GluN1 M4 transmembrane helix from one gating triad are shown as ribbon structures. In the transition from the closed (left, PDB: 5WEK) to the open (right, PDB: 5WEO) states, all three elements—the pre-M1 helix, and the tops of M4 and M3—undergo coordinated movements. The splaying of the M3 segments highlighted in red (right) is the final step in ion channel opening. It seems likely that the outer structures undergo displacements (pre-M1, and M4, green) prior to the final M3 displacement.
Fig. 20
Fig. 20
Structure of the ion permeation pathway. (A) Open-state structure of a homomeric GluA2 AMPA receptor (PDB: 5WEO). The ion conduction pathway is shown in gray, the pore-forming re-entrant M2 loop is in yellow, and the M3 gating helix is in green. Only two (B and D) out of four subunits are shown; the other two subunits (A and C) are removed for clarity. The blue mesh illustrates cryo-EM density. Residues in the SYTANLAAF motif, including the gating hinge Ala618 (blue) and the Q/R/N site glutamine (red), are labeled. (B) Electrostatic surface potential of the open pore with blue indicating a positive charge, red negative charge, and white neutral. (C) The re-entrant M2 pore loop for a GluN1/2 NMDA receptor is shown as a ribbon structure with the Q/R/N site Asn red, and a downstream adjacent Asn in GluN2 is green (indicated as N+1). (D) Summary of the Q/R/N site identity for iGluR subunits and qualitative assessment of Ca2+ permeability. Supplemental Table 2 summarizes measured Ca2+ permeabilities. KAR, kainate receptor. Panels C and D adapted with permission from Wollmuth (2018).
Fig. 21
Fig. 21
AMPA receptor biogenesis in the ER. (A) The intrinsic assembly of AMPA receptor dimers occurs largely through interactions between their NTDs, whereas tetramerization (i.e., the dimerization of dimers) involves mostly TMDs and ABDs. These steps are aided by chaperones and assembly factors. (B) Extrinsic regulators based on the proposed “assembly line” model (Schwenk et al., 2019) are shown: (1) AMPA receptor monomers are associated with ABDH6, (2) dimerization is induced by coassociation with preassembled FRRS1L/CPT1c complexes, and (3) tetramerization is followed by (4) dissociation of ABDH6 and association of auxiliary subunits (TARP and/or CNIH). Dissociation of FRRS1L/CPT1c renders the AMPA receptor/auxiliary subunit complex competent for ER export via COPII vesicular carriers.
Fig. 22
Fig. 22
Roles of glutamate receptors in the CNS. The different iGluRs control diverse neuronal function beginning in embryonic development (left) and continuing in the mature neuron (right). NMDA receptors contribute to neuron development by regulating (1) neural progenitor cell proliferation, (2) migration, and (3) neurogenesis. NMDA receptor activation can either inhibit or enhance proliferation and migration. (4) NMDA and AMPA receptors play key roles in dendrite development, whereas NMDA and kainate receptors regulate axon growth and (5) axon guidance toward appropriate synaptic targets. (6) Synapse formation is regulated by postsynaptic GluD and NMDA receptors as well as presynaptic NMDA and kainate receptors, with kainate receptors playing a role in axon terminal maturation. (7) Synapse maturation involves the recruitment of AMPA receptors as well as continued activity of NMDA, kainate, and/or GluD receptors, whereas (8) synapse pruning involves NMDA and GluD receptors and the removal of AMPA receptors. (9) Extrasynaptic NMDA and kainate receptors regulate neuronal excitability in response to glutamate release from astrocytes. (10) Postsynaptic AMPA, NMDA, and GluD receptors have roles in short- and long-term synaptic plasticity, and NMDA and kainate receptors are implicated in presynaptic mechanisms underlying plasticity. (11) All iGluR subtypes (except GluD receptors) mediate depolarizing EPSPs that increase neuronal excitability and promote action-potential generation. (12) NMDA and kainate receptors have metabotropic signaling capabilities. (13) Presynaptic NMDA and kainate receptors are expressed at GABAergic synapses where they enhance inhibitory synaptic transmission.
Fig. 23
Fig. 23
Developmental roles of iGluRs in the CNS. The timeline shows receptors that play a developmental role in multiple early processes (left), as well as roles in adult neuronal function (right). The developmental expression patterns as well as subcellular localization of iGluR subunits result in subunit-specific functional roles through neuronal development. Only GluN1 and GluN2B are known to play roles in each developmental stage and across all subcellular compartments from neural progenitor cell proliferation through mature neuron function. Specific kainate receptors regulate axon and dendrite growth along with GluN1 and GluN2B, whereas GluN2D and specific AMPA receptor subunits regulate dendrite growth. Most subunits have established roles in synapse formation and/or maturation except for GluN2C and GluN2D. All receptor subtypes are expressed in the postsynaptic compartment and most contribute to synaptic plasticity. NMDA and kainate receptors are prominent in presynaptic and extrasynaptic compartments and can signal through noncanonical metabotropic pathways.
Fig. 24
Fig. 24
AMPA receptor expression in different neurons. (A) Upper panel: Current recordings illustrate how neuronal firing properties match AMPA receptor signaling. In the hippocampus, the CA1 pyramidal cells, hilar mossy cells, and hilar interneurons can be distinguished by their distinct firing properties. Lower panel: Current responses in excised outside-out patches to 1 millisecond (red) or prolonged (black) glutamate reveal that the gating kinetics of AMPA receptors are slower in pyramidal cells and mossy cells than in interneurons. Unpublished current and voltage-clamp records are from Ryan Alexander, Yuhao Yan, and Derek Bowie. (B) Upper panel: In the cerebellum, stellate and Purkinje cells show distinct firing properties. Lower panel: AMPA receptors in patches pulled from these neurons showed different responses to brief (green) and prolonged (black) application of glutamate. Reproduced with permission from Alexander et al. (2019) and Dawe et al. (2019).
Fig. 25
Fig. 25
AMPA receptor/TARP stoichiometry influences function in a cell-specific manner in cerebellar neurons. (A) Left panel: Cryo-EM structures of GluA2-tandem TARP γ-2 complex with a stoichiometry of 2 auxiliary subunits (PDB: 5KBU). Right panel: Native and recombinant AMPA GluA1/2 receptor responses exhibit a linear relationship between the rate of the onset of desensitization (τ) and the degree of desensitization (steady-state/peak current ratio as %). The relationship between rate and extent of desensitization for stellate cells best matched that for recombinant AMPA receptors that had a constrained stoichiometry of two TARP γ-2 subunits per AMPA receptor. (B) Left panel: Cryo-EM structures of GluA2-tandem TARP γ-2 complex with a stoichiometry of 4 auxiliary subunits (PDB: 6DLZ). Right panel: Purkinje cell relationship between rate and extent of desensitization best matched with recombinant AMPA receptors that had a constrained stoichiometry of four TARP γ-2 subunits per AMPA receptor. Adapted with permission from Dawe et al. (2019).
Fig. 26
Fig. 26
Neuronal functions of kainate receptors. (A1) Kainate receptors (KARs) regulate presynaptic GABA and glutamate release through second messenger-mediated signaling that involves G protein or by current flow. GABAR, GABA receptor. (A2) Upper panel: The kainate receptor agonist domoate reduced fEPSPs in CA1 stratum pyramidale, which was blocked by injection of pertussis toxin (PTX) into the hippocampus prior to slicing. Lower panel: Kainate reduced the frequency of GABAergic miniature inhibitory postsynaptic currents (mIPSCs) in CA1 pyramidal cells. (B1) Activation of kainate receptors on CA3 pyramidal cells alters intrinsic excitability by (B2, Upper panel) decreasing the afterhyperpolarization. Lower panel: The kainate receptor agonist ATPA decreased the AHP in CA3 interneurons. (C1) Kainate receptors mediate postsynaptic currents in response to presynaptic release of glutamate. (C2 upper panel) Evoked EPSCs recorded from a CA3 pyramidal cell in response to 20-Hz stimulation of mossy-fiber input or (lower panel) thalamocortical EPSCs in presence or absence of selective AMPA receptor inhibitor. Adapted with permission from Frerking et al. (2001), Rodriguez-Moreno and Lerma (1998) (A), Fisahn et al. (2005) (B), Segerstrale et al. (2010) (B), Rebola et al. (2007) and Kidd and Isaac (1999) (C) (Copyright 2001, 2007, 2010 Society for Neuroscience).
Fig. 27
Fig. 27
Organization of the glutamatergic synapse. (A) The center of the PSD contains several NMDA receptors with adjacent AMPA receptor clusters. Presynaptic vesicular release machinery is positioned above each AMPA receptor cluster with transsynaptic anchoring proteins (e.g., neuroligins, neurexins) flanking the release sites. This alignment of presynaptic release machinery with postsynaptic AMPA receptors encased by neuroligins forms a 70–100-nm diameter domain. Intracellular postsynaptic scaffolding proteins have been omitted for clarity, as have mobile NMDA and AMPA receptors. (B) Simulations of glutamate concentration within the synaptic cleft after release of a single quanta suggest that neighboring AMPA receptor nanodomains might not see a sufficient concentration of glutamate for rapid activation. (C) Stimulated emission depletion (STED) imaging of cultured neurons demonstrates how AMPA receptors are clustered in dendrites (left), and single-particle tracking photoactivation localization microscopy (sptPALM) enables visualization of AMPA receptor nanodomains within dendritic spines (right, scale bar 200 nm). (D) sptPALM imaging revealed greater mobility of GluA2 than GluA1 within dendritic spines (left). Imaging of surface-expressed GluA2 subunits by universal point accumulation in nanoscale topography (uPAINT) imaging demonstrated its restricted mobility. (E) Stochastic optical reconstruction microscopy (STORM) imaging of immunostained AMPA and NMDA receptors in mouse brain revealed a diversity in the synaptic organization of receptor nanodomains, with some synapses displaying higher AMPA receptor content (top, left) and others higher NMDA receptor content (top, right). AMPA and NMDA receptor distribution within the postsynaptic area differed as some synapses displayed a high level of centrally located NMDA receptors (bottom, right), and other synapses had both AMPA and NMDA receptors located toward the periphery of the synapse. Adapted with permission from Choquet and Hosy (2020) (B), Nair et al. (2013) (C and D), and Dani et al. (2010) (E).
Fig. 28
Fig. 28
Control of synaptic strength through modification of AMPA receptors. (A) Summary of four ways an excitatory synapse can change its properties through changes in either the number or subtype of AMPA receptors at the postsynaptic density (PSD). (B) Mechanisms underlying AMPA receptor trafficking during NMDA receptor-dependent LTP and LTD at hippocampal CA1 synapses. Under basal conditions (center), AMPA receptors undergo dynamic lateral exchange into and out of the PSD and recycling between the plasma membrane and endosomes. During induction of LTP (right), brief, high levels of Ca2+ influx through NMDA receptors activate a variety of protein kinase signaling pathways that promote PSD trapping of both Ca2+-permeable and Ca2+-impermeable AMPA receptors through lateral exchange and increased delivery to the extrasynaptic plasma membrane by exocytosis from recycling endosomes. During the induction LTD, prolonged, low, levels of NMDA receptors Ca2+ influx activate a variety of protein phosphatase and kinase pathways that promote AMPA receptor loss from the PSD and removal from the extrasynaptic plasma membrane by endocytosis. AMPA receptor trafficking during LTP and LTD is regulated by changes in both AMPA receptor CTD and TARP phosphorylation/dephosphorylation. AMPA receptor synaptic recruitment in LTP and removal in LTD are also coordinated with structural changes that increase and decrease, respectively, the number of PSD “slots” for AMPA receptors.
Fig. 29
Fig. 29
AMPA receptor expression in hippocampal neurons. (A) Left panel: Hippocampal CA1 pyramidal cell filled with biotin, reproduced with permission from Yankova et al. (2001) (Copyright 2001 National Academy of Sciences, U.S.A.). Right panels: Evoked AMPA receptor-mediated EPSCs from CA1 pyramidal cells in hippocampal slices from floxed Gria1, Gria2, Gria3, or Gria1/2 mice injected with an rAAV1-Cre-GFP virus, which produced single-cell elimination of the desired gene product (green). Recordings from adjacent wild-type cells are in black; scale bars are 5 pA, 10 milliseconds. Adapted with permission from Lu et al. (2009). Reconstructions of MGE-derived (B) and CGE-derived (C) CA1 interneurons. MGE-derived interneurons are more sensitive to an inhibitor of GluA2-lacking AMPA receptors (PhTX-433), than CGE interneurons, suggesting that MGE-derived interneurons express more Ca2+-permeable AMPA receptors. Scale bars are 50 pA and 10 milliseconds. CRE, cAMP response element. Adapted with permission from Matta et al. (2013) and Lee et al. (2011).
Fig. 30
Fig. 30
Kainate receptor expression in hippocampal CA3 pyramidal cells. (A) Electron micrograph showing mossy-fiber boutons (MFBs) and thorny excrescence spines (SPs) with gold particles for GluK2/3 labeling at the postsynaptic (blue) or the presynaptic membranes (red). (B) Left panel: GluK4 immunoperoxidase staining is evident in CA3 stratum lucidum (SL, arrowheads) but absent from the CA3 pyramidal cells in stratum pyramidale (SP, asterisk). Right panel: GluK5 staining is present in CA3 stratum lucidum and stratum pyramidale; SR indicates stratum radiatum. (C) Pairs of evoked mossy-fiber CA3 EPSCs recorded at several interstimulus intervals reveal paired-pulse facilitation in hippocampal slices from wild-type mice. Paired pulse facilitation is reduced in slices from GluK4 and GluK5 double-KO mice. (D) Mossy-fiber CA3 kainate receptor-mediated EPSCs isolated using the AMPA receptor inhibitor GYKI 53655 were evoked with short trains of stimulation (5 stimuli, 100 Hz) in slices from wild-type mice. Slices from GluK4 and GluK5 double KO mice show no detectable kainate receptor–mediated EPSCs. Reproduced with permission from Fernandes et al. (2009) (A, C, and D) and Darstein et al. (2003) (Copyright 2003 Society for Neuroscience) (B).
Fig. 31
Fig. 31
NMDA receptor expression in hippocampal CA1 neurons. (A) Upper panel: fluorescence in situ hybridization for CB1 cannabinoid receptor, parvalbumnin, and Grin2d mRNA. Lower panel: the percentage of CA1 interneurons showing the GluN2 subunit expression based on interneuron classification as determined by single-cell reverse transcription PCR (RT-PCR). PV, parvalbumin; CCK, cholecystokinin; SOM, somatostatin; NPY, neuropeptide Y. Adapted with permission from Perszyk et al. (2016). (B) Paired recordings of outward NMDA receptor–mediated evoked EPSCs (VHOLD +40 mV) from wild-type CA1 pyramidal neurons (black) and pyramidal neurons lacking GluN2A, GluN2B, or both subunits (green). Scale bars as are 25 pA and 100 milliseconds. Adapted with permission from Gray et al. (2011). (C) Whole-cell current recording of evoked EPSCs from either CA1 pyramidal cells (C1) or interneurons (C2) in the absence (black) or presence (blue) of the GluN2A-selective negative allosteric modulator MPX-004, the GluN2B-selective negative allosteric modulator CP-101,606, or the GluN2C/D-selective negative allosteric modulator NAB-14. These data demonstrate pyramidal cell expression of GluN2A/B and interneuron expression of GluN2B/2D. Scale bars are 20 pA and 100 milliseconds. Adapted with permission from Yi et al. (2019) and Swanger et al. (2018) (Copyright 2018 American Chemical Society).
Fig. 32
Fig. 32
Agonist binding pockets in iGluR subunits. (A) Binding of glutamate (yellow) in the agonist binding pocket of GluA2 (PDB: 1FTJ), GluA3 (PDB: 3DLN), and GluA4 (PDB: 3EPE). Only side chains of key interacting residues are shown. (B) Binding of glutamate in GluK1 (PDB: 2F36), GluK2 (PDB: 1S7Y), and GluK3 (PDB: 4MH5). Compared with the agonist binding pocket of GluA2, there is a loss of a direct hydrogen bond to the α-amino group of glutamate at position Ala518 in GluK2, which is equivalent to Thr501 in GluA2. An additional water molecule forms a hydrogen bond to the α-amino group of glutamate in GluK2 (not shown). (C) Binding of glutamate in GluN2A (PDB: 5I57) and GluN2D (PDB: 3OEL). Compared with GluA2, the salt bridge between Asp731 and the α-amino group of glutamate is absent. Instead, the α-amino group of glutamate forms water-mediated hydrogen bonds to Asp731, Glu413, or Tyr761 (W indicates water). (D) Binding of glycine in GluN1 (PDB: 5I57). Specificity of GluN1 for glycine can be explained by the hydrophobic environment created by Val689 and the steric barrier formed by Trp731. (E) Binding of glycine in GluN3A (PDB: 2RC7) and GluN3B (PDB: 2RCA). Trp731 of GluN1 is replaced by GluN3A Met844. (F) Binding of D-serine in GluD2 (PDB: 2V3U).
Fig. 33
Fig. 33
Glycine site NMDA receptor agonists with GluN2-specific activity. Concentration-response data for glycine site NMDA receptor agonists normalized to the maximal responses to glycine. All ligands are superagonists at GluN1/2C receptors, and D-cycloserine, 16a, and AICP display varying extents of partial agonism at GluN1/2A, GluN1/2B, and GluN1/2D receptor subtypes. Data are adapted with permission from Maolanon et al. (2017) (Copyright 2017 American Chemical Society) for D-serine and 16a and Jessen et al. (2017) for D-cycloserine and AICP.
Fig. 34
Fig. 34
Distinct binding modes of competitive NMDA receptor antagonists with GluN2 subunit preference. (A) Cartoon illustrating the GluN1/2A ABD heterodimer with glycine bound in GluN1 and antagonist bound in GluN2A. The upper D1 and lower D2 lobes are indicated. Below is an alignment of the amino-acid sequences of GluN2 subunits highlighting nonconserved residues that mediate the GluN2 preference of competitive antagonists. The GluN1 ABD is omitted for clarity in panels B–D. (B) Structure of the GluN2A ABD in complex with the GluN2C/D-preferring antagonist UBP791 (PDB: 6UZW). The phenanthrene rings of UBP791 are oriented along the cleft formed by the D1 and D2 lobes and contact nonconserved residues shown in blue in subsite II. (C and D) Structures of the GluN2A ABD in complex with the GluN2A-preferring antagonists ST3 (PDB: 5DDX) or NVP-AAM077 (PDB: 5U8C). These antagonists have substituents directed into a cavity of the GluN2A agonist binding site toward the subunit interface between GluN1 and GluN2A ABDs (subsite I).
Fig. 35
Fig. 35
Polyamine binding within the AMPA receptor channel pore. (A) Structure of the endogenous polyamine spermine is shown within a cross-section of the GluA2(Q) AMPA receptor pore to illustrate the electroneutral cavity (white) above the Q/R/N site and electronegative cavity (red) of the inner pore where endogenous polyamines (yellow for carbon and blue for nitrogen) are proposed to bind. (B) Structure of the pore illustrates residues in the M2 reentrant loop that participate in polyamine binding (PDB: 6DM1). Adapted with permission from Twomey et al. (2018). (C) Electrophysiological traces of polyamine block of GluK2 (left) and GluK2 + Neto2 (right). (D) Current-voltage plots show the rectifying nature of polyamine block (indicated as gold), which is weaker when kainate receptors are coassembled with Neto1 or Neto2. Adapted with permission from Brown et al. (2016).
Fig. 36
Fig. 36
Voltage-dependent Mg2+ block of NMDA receptors. (A) Space fill of GluN1 (blue)/GluN2B (gray) NMDA receptor (PDB: 6WHS). The red box denotes the TMD. (B1) Cartoon illustrates direction of net current flow during periods when Mg2+ block occurs (red), when block Mg2+ is absent or modest (orange), and for outward current with no Mg2+ block (blue). (B2) Current-voltage relationship was recorded in the absence and presence of Mg2+; the smooth curve is a fit of the Woodhull equation to the data. Adapted with permission from Perszyk et al. (2020b). (C) Single channels recorded in outside-out patches obtained from cultured neurons in response to NMDA in the absence and presence of extracellular Mg2+. The red arrows indicate brief closures that increase in frequency with increasing Mg2+ concentration and likely reflect well-resolved individual blockages by Mg2+. Reproduced with permission from Ascher and Nowak (1988).
Fig. 37
Fig. 37
Cation binding pockets of non-NMDA glutamate receptors in the ABD dimer interface. (A) Structures of the isolated ABD dimers of GluK2 (left, PDB: 3G3F) and GluA2 (right, PDB: 4IGT) highlight the cation binding sites (magenta) for Na+, Li+, and Ca2+ located at the apex of ABD dimer interface. The single-anion (Cl-, green) pocket of GluK2 is absent from AMPA receptors (left). (B) Expanded view highlights the residues that make up the cation binding pocket of GluK2 (left) and GluA2 (right) (C) Glutamate-activated currents from GluK2 kainate receptors (left) or GluA2 AMPA receptors (right) were recorded in different external cations. Adapted with permission from Wong et al. (2006) (Copyright 2006 Society for Neuroscience) and Dawe et al. (2016).
Fig. 38
Fig. 38
Negative allosteric modulation of NMDA receptors by extracellular Zn2+. (A) Concentration-response curve shows inhibition by Zn2+ of GluN1/2 receptors recorded at +50 mV at which voltage-dependent channel block does not contribute to inhibition. (B) GluN1-N615G/2A channels, which are not sensitive to channel block by Zn2+, recorded in cell-attached patches in the absence or presence of extracellular Zn2+. (C) GluN1/2A responses recorded at +40 mV in response to rapid application of glutamate with or without buffered Zn2+. The relaxation reflects a time-dependent Zn2+ association. (D) Proton inhibition curves recorded in the absence and presence of Zn2+ revealed a Zn2+-induced enhancement of proton inhibition. GluN1/2A responses recorded at +40 mV show greater Zn2+ inhibition at pH 6.8 than at pH 7.8, as predicted by the shift in the proton inhibition curve. (E) Cartoon illustrating corelease of Zn2+ and glutamate from presynaptic terminals. Simulation of NMDA-component EPSCs from a model that incorporates the positive allosteric regulation between Zn2+ and glutamate and corelease of Zn2+ (Erreger and Traynelis, 2005). The association rates determined for Zn2+ are too slow to allow synaptically released submicromolar Zn2+ to bind to NMDA receptors during the first EPSC, but inhibition is established with higher frequency release. Panels were reproduced or adapted with permission from Rachline et al. (2005) (Copyright 2005 Society for Neuroscience) (A), Amico-Ruvio et al. (2011) (B), Erreger et al. (2005a) (C and E), Low et al. (2000) (Copyright 2000 National Academy of Sciences, U.S.A.) (D), and Zheng et al. (2001) (D).
Fig. 39
Fig. 39
Coordination site for Zn2+ binding in GluN2A and GluN2B NTDs. (A) Crystal structure of GluN1 (slate)/GluN2B (gray) heterodimeric NTDs (PDB: 5TPW). Zn2+ binds within the cleft of the bilobed clamshell-like NTD. (B) Four residues within the bilobed GluN2A NTD coordinate Zn2+, resulting in high-affinity binding. (C) Crystal structure of Zn2+-bound GluN2B NTD (PDB: 3JPY). Zn2+ is coordinated by only two residue side chains, which accounts for its lower affinity compared with GluN2A.
Fig. 40
Fig. 40
Structural basis of allosteric modulation of GluN1/2A NMDA receptors. (A) Structures of GluN1/2A NMDA receptors in the presence of glycine and glutamate (Gly and Glu) and in the presence and absence of Zn2+ at various pH values. Structures in surface presentation for Super-splayed (PDB: 6MMJ), Extended (PDB: 6MMM), 1-knuckle (PDB: 6MMK or 6IRF), and 2-knuckle (PDB: 6MMP or 6IRA). Intermediate conformational states are omitted for simplicity. GluN1 and GluN2A subunits are blue and gray, respectively. (B) Schematic presentations of domain and subunit arrangements of GluN1/2A NMDA receptors in various conformations in panel A. The 1-knuckle and 2-knuckle structures are similar to Non-active1 and Non-active2 structures, respectively, in which 2-knuckle contains open GluN2A NTD clamshells and 1-knuckle has closed GluN2A NTD clamshells. At neutral to high pH (7.4 to 8) with no Zn2+, the receptors are in 2-knuckle whereas at low pH (pH 6.3) with no Zn2+ (PDB: 6IRF) they are in 1-knuckle. Addition of Zn2+ at 1 µM at pH 6.1 splits GluN1-GluN2A NTD dimer pairs into Extended and Super-splayed conformations. At pH 7.4, the populations of Extended and Super-splayed increase as the Zn2+ concentration increases from low (1 µM) to high (1 mM). Currents at the bottom were recorded in the presence versus absence of EDTA and show inhibition by contaminant Zn2+ (unpublished data from Lonnie P. Wollmuth). (C) The relative occurrence of these structure classes in various conditions (no, low, high Zn2+; low, neutral, high pH). The pairs of structure classes, 2-Knuckle-Sym and 2-Knuckle-Asym, Extended and Extended-2, and Splayed and Super Splayed were combined for simplicity.
Fig. 41
Fig. 41
Sites of AMPA receptor modulation. (A) Structure of GluA2 AMPA receptor (PDB: 6DM1) with four subunits colored pink, gray, light green, and light blue. The positive allosteric modulator Conus striatus cone snail toxin con-ikot-ikot (PDB: 4U5B) is shown in red, and small-molecule regulators are shown in sticks (yellow). (B) An expanded view of the ABD dimer with glutamate and cyclothiazide (CTZ) bound (PDB: 1LBC). The inset shows an expanded view of the positive allosteric modulator binding site at the ABD dimer interface with CTZ (yellow; PDB: 1LBC), aniracetam (green; PDB: 2AL5), LY404187 (pink; PDB: 3KGC), CX614 (cyan; PDB: 2AL4), and a dimeric biarylpropylsulfonamide (BPSA, dark blue; PDB: 3BBR). (C) An expanded view of the TMD, with the front and back subunits (B and D) removed for clarity. The negative allosteric modulators perampanel (PDB: 5L1F) and 4-BCCA (PDB: 6XSR) are shown. The inset shows an expanded view of the binding site at the ion channel extracellular collar with CP-465,022 (blue; PDB: 5L1E), perampanel (yellow; PDB: 5L1F), and GYKI53655 (dark green; PDB: 5L1H).
Fig. 42
Fig. 42
Modulation of AMPA receptors by PAMs is sensitive to RNA splicing and auxiliary subunits. Left panels: The whole cell current response of homomeric GluA4-flip (A) or GluA4-flop (B) splice isoforms recorded in response to brief application of 10 mM glutamate in the absence or presence of 10 µM of the AMPA receptor PAM BIIB104. Right panels: The current response of GluA4-flip and GluA4-flop receptors in response to prolonged application of 10 mM glutamate in the absence or presence of 10 µM BIIB104 to measure the rate and extent of desensitization. (C) The effect of 1 µM BIIB104 is shown on hippocampal Schaffer collateral to CA1 pyramidal cell EPSCs (upper panel) or on mossy fiber to cerebellar granule cell EPSCs. Reproduced with permission from Ishii et al. (2020). (D) Left panels: Outside-out patch recordings of glutamate-evoked currents from cells expressing AMPA receptors coexpressed with either γ-2 or γ-8 TARPs in the presence (red) and absence (black) of 1 µM JNJ-55511118. Right panels: Outside-out patch recordings of glutamate-evoked currents in patches from hippocampal or cerebellar neurons in the presence (red) and absence (black) of 1 µM JNJ-55511118. Glutamate (10 mM) was applied during the time depicted by the gray bar. Reproduced with permission from Maher et al. (2016).
Fig. 43
Fig. 43
Protein-protein domain and subunit interfaces in NMDA receptors. A) Surface presentation of GluN1/2B structure (PDB: 6WHS). B) The subunits and domains are translationally shifted to reveal and emphasize the inter– and intra–protein-protein interfaces within the multimeric protein complex. These sites indicated by red lines are locations for potential allosteric modulator binding.
Fig. 44
Fig. 44
Mechanism of negative allosteric modulation by GluN2A-selective NMDA receptor antagonists. (A) Model for inhibition by negative modulation of glycine binding without changing agonist efficacy (E). A is the agonist, B is the NAM, and R is the receptor. KA and KB are equilibrium association constants for agonist and NAM, respectively. KA is changed by the allosteric constant α upon NAM binding and vice versa. DR is the dose ratio (i.e., the ratio of agonist EC50 values in presence and absence of modulator). Kb is the NAM dissociation constant. (B) Glycine concentration-response data for GluN1/2A in the absence or presence of the NAM, TCN-201, are analyzed by simultaneously fitting all data to the DR equation and the Hill equation using global nonlinear regression, yielding glycine EC50, TCN-201 binding constant (Kb), and allosteric constant α that describe all the experimental data. (C) DR values derived from fitting individual concentration-response data shown in (B) are plotted as a function of TCN-201 concentration, which also illustrates the effects of changing the allosteric constant α but with constant Kb. Competitive antagonists have α = 0 (dashed line). (D) Crystal structure of the agonist-bound GluN1/2A ABD heterodimer in complex with TCN-201 (PDB: 5I56). (E) Cartoon illustrating conformations of GluN1/2A ABD crystal structures that represent states in the NAM inhibition cycle [i.e., a Monod-Wyman-Changeux (MWC) model] (PDB codes are listed). Glutamate is continuously bound to the GluN2A ABD, and the competitive antagonist DCKA stabilizes the open (i.e., glycine-lacking) state of the GluN1 ABD. NAM binding stabilizes the inactive receptor with no glycine bound to GluN1 subunits. (F) Structural changes in modulatory binding site during the NAM inhibition cycle. Binding of NAM, in this case MPX-007, displaces GluN2A V783, and this “push” is accompanied by a steric effect on GluN1 F754, which undergoes movements during opening and closure of the GluN1 ABD. DCKA is omitted from PDB: 4NF4 and PDB: 5JTY. Modified with permission from Yi et al. (2016).
Fig. 45
Fig. 45
NMDA receptor modulators can have multiple effects on the receptor function. (A) Modulators can increase the open probability, estimated here from the current amplitude ratio in presence to absence of drug for responses to saturating concentrations of agonists. Modulators can also alter the deactivation time course in response to rapid removal of agonist. (B) Modulators can alter the agonist potency both through direct actions on agonist affinity or through efficacy-induced changes in EC50. Some modulators can modify unitary conductance, suggesting they alter the shape, configuration, and properties of the open channel. Modified with permission from Perszyk et al. (2020b) (A and C) and Hackos et al. (2016) (B).
Fig. 46
Fig. 46
Multiple binding poses for GluN2B-selective negative allosteric modulators. (A) Binding site for GluN2B-selective NAMs at the GluN1/2B NTD heterodimer interface. The structure is the hybrid from GluN1/2B heterotetramer (PDB: 6WHR) and GluN1/2B NTD heterodimer (PDB: 6E7U). (B) Binding poses for different GluN2B-selective NAMs show occupancy of each arm or both arms of the binding pocket at the interface between the GluN1/2B NTD heterodimer (PDB: 3QEL, 5EWM, 6E7U for ifenprodil-, EVT-101-, and EU93-31–bound structures). (C) The proposed binding site for the GluN2C-selective PAM PYD-106 is shown at the interface between the GluN2C NTD and ABD in a model from Kaiser et al. (2018).
Fig. 47
Fig. 47
Structural basis of allosteric modulation of GluN1/2B NMDA receptors. Structures of GluN1/2B in the presence of agonists and the NAM ifenprodil. (A) Structures representing GluN2B-NAM–bound (PDB: 4PE5), Non-active1 (PDB: 6WHR), Non-active2 (PDB: 6WHS), and Active states (PDB: 6WI1). The GluN1 and GluN2B subunits are colored in slate and gray, respectively. The two ifenprodil molecules are represented by magenta spheres. In all of the structures, glycine (Gly) and glutamate (Glu) are present at ABDs but are omitted for clarity. (B) Schematic illustration of domain and subunit arrangement of GluN1/2B in conformations from (A). In Active state, the GluN2B NTD clamshell is open, the GluN1/2B NTD heterodimer interfaces roll (1), and the GluN1-GluN2B ABD heterodimers roll (2) to create tensions in the ABD-TMD linkers, that leads to channel opening. In Non-active1 and Non-active2, no rolling occurs in NTDs and ABDs, however, they differ by whether the GluN2B NTD clamshell is open (Non-active2) or closed (Non-active1). The population of Non-active1 increases with lower pH. GluN2B-NAMs targeting the subunit interfaces of GluN1/2B NTDs stabilize the closed GluN2B NTD clamshell, thereby stabilizing the conformation similar to Non-active1.
Fig. 48
Fig. 48
Multiple binding pockets at the TMD-ABD interface. (A) The GluN1/2D structure [model built from PDB: 6WHS, Strong et al. (2021)] with GluN1 shown in blue and GluN2D in gray. The pre-M1/M3 domain of NMDA receptors exhibits pseudo–4-fold symmetry due to the tetrameric arrangement GluN1-GluN2-GluN1-GluN2. (B) The pseudo–4-fold symmetry creates two distinct binding pockets for modulators that include either the GluN1 pre-M1/M3 helices shown with (S)-EU1180-55 docked or GluN2D pre-M1/M3 helices shown with (R)-EU1180-55 docked. Modified with permission from Strong et al. (2021) (Copyright 2021 American Chemical Society).
Fig. 49
Fig. 49
Mechanism for the antidepressant effect of NMDA receptor antagonists. Synaptic potentiation on the vertical axis is a hypothetical construct that captures 1) the fact that blocking NMDA receptors reduces activity at some synapses in the CNS, and 2) the wealth of preclinical and clinical data that indicate there is an increase in synaptic strength after NMDA receptor blockade, putatively resulting from the insertion of AMPA receptors into some population of synapses. Initially, acute NMDA receptor (NMDAr) inhibition reduces synaptic potentiation. This correlates closely in time with, and putatively causes, the psychotomimetic side effects (psychosis) that track the drug-exposure time course. NMDA receptor inhibition also triggers a synaptic potentiation (rebound) that outlasts the period of acute NMDA receptor inhibition. When synaptic potentiation exceeds a theoretical threshold (depression threshold), depressive symptoms are reduced (antidepressant response). In most cases, the NMDA receptor induced synaptic potentiation is transient and when this potentiation wanes to below the depression threshold, depressive symptoms return. The population of NMDA receptors that mediate the antidepressant response are not known at present. However, clinical data indicate that ketamine and the GluN2B-selective NAM CP-101,606 cause psychotomimetic effects and a subsequent antidepressant response.
Fig. 50
Fig. 50
Regional genetic intolerance in NMDA receptor GRIN genes. (A) The ratio of observed/expected GRIN variants in the general population (OE-ratio) below the 10th percentile are red and indicate the regions under selection (Traynelis et al., 2017). The 21 amino acids in GluN1 encoded by exon 5 are highlighted in blue and show almost no variation in the general population. The regions highlighted with a dashed box have insufficient data available. Data shown are a sliding average of ratios for 31 residues. (B) NMDA receptor ABD/TMD domains are intolerant to genetic variation. Observed/expected variant ratios (OE-ratio) below the 10th percentile are colored magenta, indicating the regions under selection. Homology models for diheteromeric GluN1/2A receptor were generated from two template structures (PDB: 5FXH and 4PE5).
Fig. 51
Fig. 51
Variants in the pre-M1 helix, M3, and pre-M4/M4 regions identify a region controlling gating. (A) Three intolerant regions lie close to one another, potentially allowing side chains to be in van der Waals contact to form a gating control element. These three regions include the adjacent GluN1 pre-M1 helix (magenta), GluN1 M3/SYTANLAAF (gray), and GluN2 pre-M4 linker/M4 (green) of the NMDA receptor. A second gating triad (not shown) also exists for the GluN2 pre-M1 helix, GluN2 M3/SYTANLAAF, and GluN1 pre-M4 linker/M4. (B) M3 variant GRIN2D-p.V667I prolongs the deactivation time course and increases channel open probability. (C) Pre-M1 variant GRIN2A-p.P552R enhances agonist potency, slows activation and prolongs deactivation time course. (D) Pre-M4 linker variant GRIN2A-p.L812M enhances agonist potency, prolongs the deactivation time course, and increases channel open probability. WT, wildtype. C: closed, O: open. Adapted with permission from Yuan et al. (2015a) (A), Li et al. (2016a) (B), Ogden et al. (2017) (C), and Yuan et al. (2014) (D).
Fig. 52
Fig. 52
Regional intolerance in AMPA glutamate receptor genes. (A) The ratio of observed/expected GRIA variants (OE-ratio) below the 10th percentile are shown in red and suggest regions/domains that are under selection (Traynelis et al., 2017). Regions highlighted with a dashed box have insufficient data available. M1 and M4 are sites for TARP, GSG1L, and CNIH binding, highlighted by blue squares. (B) Intolerance analysis of genetic variation across functional domains of GluA1 and GluA2. (A–D) Side views of the tetrameric receptor (upper panels) and a single subunit (chain A for GluA1, chain D for GluA2, lower panels) of a GluA/2 receptor based on the crystal structure (PDB: 6QKZ). GluA1 subunit is light yellow, and GluA2 subunit is light blue; regions with an OE-ratio below the 10th percentile are magenta and indicate the regions under selection.

Similar articles

Cited by

References

    1. Aamodt SM, Shi J, Colonnese MT, Veras W, Constantine-Paton M (2000) Chronic NMDA exposure accelerates development of GABAergic inhibition in the superior colliculus. J Neurophysiol 83:1580–1591. - PubMed
    1. aan het Rot M, Collins KA, Murrough JW, Perez AM, Reich DL, Charney DS, Mathew SJ (2010) Safety and efficacy of repeated-dose intravenous ketamine for treatment-resistant depression. Biol Psychiatry 67:139–145. - PubMed
    1. Abbott LF, Nelson SB (2000) Synaptic plasticity: taming the beast. Nat Neurosci 3 (Suppl):1178–1183. - PubMed
    1. Abdallah CG (2020) (2R,6R)-Hydroxynorketamine (HNK) plasma level predicts poor antidepressant response: is this the end of the HNK pipeline? Neuropsychopharmacology 45:1245–1246. - PMC - PubMed
    1. Abdallah CG, Sanacora G, Duman RS, Krystal JH (2015) Ketamine and rapid-acting antidepressants: a window into a new neurobiology for mood disorder therapeutics. Annu Rev Med 66:509–523. - PMC - PubMed

Publication types