. 2021 Nov 8;17(11):e1010069.
doi: 10.1371/journal.ppat.1010069. eCollection 2021 Nov.

Suppression of inflammatory arthritis by the parasitic worm product ES-62 is associated with epigenetic changes in synovial fibroblasts

Affiliations

Suppression of inflammatory arthritis by the parasitic worm product ES-62 is associated with epigenetic changes in synovial fibroblasts

Marlene Corbet et al. PLoS Pathog. .

Abstract

ES-62 is the major secreted protein of the parasitic filarial nematode, Acanthocheilonema viteae. The molecule exists as a large tetramer (MW, ~240kD), which possesses immunomodulatory properties by virtue of multiple phosphorylcholine (PC) moieties attached to N-type glycans. By suppressing inflammatory immune responses, ES-62 can prevent disease development in certain mouse models of allergic and autoimmune conditions, including joint pathology in collagen-induced arthritis (CIA), a model of rheumatoid arthritis (RA). Such protection is associated with functional suppression of "pathogenic" hyper-responsive synovial fibroblasts (SFs), which exhibit an aggressive inflammatory and bone-damaging phenotype induced by their epigenetic rewiring in response to the inflammatory microenvironment of the arthritic joint. Critically, exposure to ES-62 in vivo induces a stably-imprinted CIA-SF phenotype that exhibits functional responses more typical of healthy, Naïve-SFs. Consistent with this, ES-62 "rewiring" of SFs away from the hyper-responsive phenotype is associated with suppression of ERK activation, STAT3 activation and miR-155 upregulation, signals widely associated with SF pathogenesis. Surprisingly however, DNA methylome analysis of Naïve-, CIA- and ES-62-CIA-SF cohorts reveals that rather than simply preventing pathogenic rewiring of SFs, ES-62 induces further changes in DNA methylation under the inflammatory conditions pertaining in the inflamed joint, including targeting genes associated with ciliogenesis, to programme a novel "resolving" CIA-SF phenotype. In addition to introducing a previously unsuspected aspect of ES-62's mechanism of action, such unique behaviour signposts the potential for developing DNA methylation signatures predictive of pathogenesis and its resolution and hence, candidate mechanisms by which novel therapeutic interventions could prevent SFs from perpetuating joint inflammation and destruction in RA. Pertinent to these translational aspects of ES-62-behavior, small molecule analogues (SMAs) based on ES-62's active PC-moieties mimic the rewiring of SFs as well as the protection against joint disease in CIA afforded by the parasitic worm product.


Conflict of interest statement

The authors have declared that no competing interests exist.

Figures

Fig 1
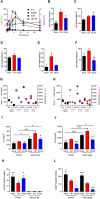
Fig 1. CIA induces a “hyper-responsive” SF phenotype that is counteracted by ES-62.
SFs from Naïve, CIA and ES-62-CIA (ES-62) mice were incubated overnight in (A) medium or medium containing (B) IL-17, (C) IL-1β, (D) LPS or (E) BLP, and IL-6 release measured. Data are mean (of means of triplicates) values ± SEM of n = 3 cultures representative of 3–7 cultures. The pooled data revealed that CIA-SFs showed 1.486 ± 0.180-fold (n = 7, p<0.05) and ES-62-SFs, 0.873 ± 0.099-fold (n = 4) basal IL-6 release relative to Naïve-SFs and IL-17-stimulated CIA-SFs exhibited x2.29 ± 0.57-fold (n = 3, p<0.05) release compared to Naïve-IL-17 controls, whilst treatment with ES-62 reduced this hyper-production (x 1.87 ± 0.62-fold, n = 3). SFs were analysed for mRNA levels of MMP9 and MMP13 (F and G) or for SOCS1 and SOCS3 (H and I), following incubation overnight in medium (None) or where indicated, medium containing IL-17. Data are from single experiments representative of at least two and presented as mean (of means of triplicates) values ± SEM of n = 3 cultures, assayed by qRT-PCR. (J) Joint pathology showing representative sections from mice, with articular scores of the joint examined [indicated]. Arrows show the cartilage erosion and cellular infiltration in CIA sections. (K) Flow cytometric analysis of the hypoxic status of joint SFs determined by pimonidazole in vivo. (L) Representative images of joint vascular leakage (Evan’s Blue), where articular score for individual paws and [total mouse score] are from one experiment representative of two independent models. Throughout, SFs were pooled from individual mice to generate representative explant cohorts with articular scores: (A-E, and I) CIA, 3.17 ± 1.38, n = 6; ES-62, 0.5 ± 0.22, n = 6; (F-H) CIA, 3.66 ± 1.5, n = 6; ES-62, 1.5 ± 1.15, n = 6; (K) CIA, 4.667 ±1.99, n = 6; ES-62, 0.8 ± 0.8, n = 5. In all panels, *p<0.05; **p<0.01; ***p<0.001 relative to CIA SFs.
Fig 2
Fig 2. IL-1β and IL-17 rewire naïve SFs to a CIA-like phenotype.
(A) Global methylation status of Naïve-SFs incubated in medium alone (Naïve) or chronically treated with IL-17 or IL-1β, compared to that of CIA-SFs. Data (means ± SEM) are from 3–5 independent experiments, normalized to “Naïve” controls. *p<0.05 and **p<0.01 are relative to Naïve-SFs. The CIA-SFs were from 3 independent models (articular scores: 3.6 ± 1.5, n = 6; 4.5 ± 1.3, n = 10 and 2.5 ± 0.8, n = 12). (B and C) Naïve-SFs incubated in medium alone (Naïve) or chronically treated with IL-17 or IL-1β were re-challenged with medium (None; B and C), or medium containing IL-17 (B) or IL-1β (C) and levels of IL-6 release determined. Data are means ± SEM of n = 3 independent cultures, where *p<0.05, **p<0.01 or ***p<0.001 are relative to the relevant Naïve-SF group (same control “None” data for B and C). Data in B are representative of 2 independent experiments. (D) Western blot analysis of DNMT1 expression in Naïve- and CIA- (articular score 3.6 ± 1.5, n = 6) SFs: each lane represents independent cultures and data (means ± SEM) were quantitated (DNMT1/GAPDH ratios normalized to Naïve controls) by ImageJ as Naïve, 1 ± 0.262 and CIA, 0.063 ± 0.004, **p<0.01. (E) Western blot analysis of DNMT1 expression in Naïve-SFs chronically treated with medium alone (Naïve) or containing IL-1β or IL-17, where lanes represent individual cultures. The data were quantitated (DNMT1/GAPDH ratios normalized to Naïve controls) by ImageJ as Naïve, 1 ± 0.22; IL-1β, 0.12 ± 0.02 and IL-17, 0.40 ± 0.14. (F-H) Naïve-SFs were chronically incubated in medium alone (None) or containing 5-aza and then assessed for (F) global DNA methylation status, (G) IL-6 release in response to IL-1β challenge and (H) MMP13 mRNA levels in response to LPS-stimulation. Data are presented as means ± SEM, where n = 3 independent cultures (F and G) or means ± SD, n = 3 triplicate analyses (H) and *p<0.05 or **p<0.01 relative to the appropriate sample lacking 5-aza (“None”).
Fig 3
Fig 3. IL-17 and IL-1β stimulate ERK and STAT3 in SFs.
Flow cytometric analysis of (A) ERK and (B) STAT3 activation, determining the relative expression of dually phosphorylated versus total ERK or phosphorylated STAT3 versus total STAT3 expression, following incubation of Naïve-SFs in medium alone or containing IL-17 for 20 min. (C) Naïve-SFs chronically incubated in medium alone (None) or containing IL-1β or IL-17 were analysed for pSTAT3, pERK and GAPDH expression by Western blot: individual lanes represent independent SF cultures. The data were quantitated (pSTAT3 or pERK/GAPDH ratios normalized to “None” controls) by ImageJ (Mean ± range, n = 2 for Naïve-SFs and Mean ± SEM, n = 3 for CIA- and ES-62-CIA SFs). For pSTAT3: None, 1 ± 0.51; IL-1β, 11.53 ± 5.06 and IL-17, 22.09 ± 5.14 and pERK: None, 1 ± 0.24; IL-1β, 2.65 ± 0.29 and IL-17, 1.14 ± 0.13. Naïve-SFs, pretreated with iERK or iSTAT3 for two hours, were incubated in medium alone (None) or with IL-17 overnight and levels of IL-6 release (D) or MMP9 mRNA (E) measured. (F) Naïve-SFs pretreated with iERK and iSTAT3 for two hours were chronically incubated in medium alone (None) or containing IL-17 or IL-1β and then their global DNA methylation assessed. Data are mean values ± SEM, n = 3 independent cultures and where *p<0.05, **p<0.01 and ***p<0.001 relative to appropriate None control (D and E) and None/None control (F) and where for iERK, *p <0.05 (pink) is relative to its IL-17 control and ***p<0.001 (purple) is relative to its IL-1β control (F).
Fig 4
Fig 4. miR-146 and -155 are potential targets of ES-62 in suppressing the hyper-responsive CIA-SF phenotype.
(A) Naïve-SFs were stimulated with LPS for the indicated times and miR-155, MyD88, Traf6 and IL-6 mRNA levels measured. Data are presented as mean values ± SEM, n = 4 for miR-155, mean ± range, n = 2 for IL-6 and single experiments for the other mediators. (B-F) Expression levels of the indicated miRs were determined for SFs from Naïve, CIA (articular score: 4.67 ± 2, n = 6) and ES-62-CIA (0.8 ± 0.8, n = 6) mice stimulated with LPS for 6 h and data presented as mean values ± SEM, n = 4–6 independent cultures and where *p<0.05 and **p< 0.01 relative to the CIA group. Although miR-19b or- 146 expression in ES-62-CIA-SFs was not significantly reduced (p = 0.06 and 0.07, respectively) when compared to that of CIA-SFs, it was not significantly elevated relative to that in the Naïve-SF controls. (G and H) SFs from wild type and miR-155 heterozygous (±) and homozygous (KO) C57BL/6 mice were incubated with the indicated stimuli and IL-6 (G) and CCL2 (H) release measured. Data shown represent the mean values (of triplicates) for two mice of each phenotype. (I-L) SFs from Naïve, CIA- (articular score 3.17 ± 1.38, n = 6) and ES-62-CIA- (articular score 0.5 ± 0.22, n = 6) mice were transfected for 24 hours with miR-155-5p mimic (50 nM) or control miR and then IL-6 and CCL2 release (I and J) and SOCS1 and DNMT1 mRNA levels (L and L) assessed. Data are from a single experiment and are expressed as the mean values (of triplicates) ± SEM, n = three independent cultures and where *p<0.05, **p<0.01, *** p<0.001. The IL-6 and CCL2 data were validated in an independent set of three cultures and further DNMT1 mRNA data are shown in Fig 5.
Fig 5
Fig 5. ES-62 induces a CIA-SF phenotype distinct from Naïve-SFs.
SFs from Naïve, CIA and ES-62-CIA mice were assessed for their levels of (A) global DNA methylation and DNMT1 (B) and DNMT3 (C) mRNA expression, where data are mean values ± SEM, n = 3 independent cultures and *p<0.05 and **p<0.01 are relative to CIA-SFs. (D) Western blot analysis of DNMT1 expression in independent cultures incubated in medium alone or containing IL-1β for 24 h and the data (means ± range) quantitated by ImageJ software presented (E) as DNMT1/GAPDH ratios normalized to the “Naïve-None” controls. Pooled data from 6 independent cultures (normalized to Naïve controls) showed relative DNMT1 expression to be: Naïve, 1 ± 0.18; CIA, 0.24 ± 0.10 and ES-62, 0.26 ± 0.06, where ***p<0.001 for Naïve versus CIA or ES-62. (F) SFs from CIA- and ES-62-CIA mice were treated with medium or medium containing IL-1β for 24 h and the levels of DNMT3 mRNA determined and normalized to Naïve controls. Throughout, SFs were pooled from individual mice to generate representative cohorts with articular scores: (A and F) CIA, 4.75 ± 1.31, n = 8 and ES-62-CIA, 0, n = 6; (B-E) CIA, 3.66 ± 1.5, n = 6 and ES-62-CIA, 1.5 ± 1.15 n = 6. (G-J) CIA was induced in mice treated with PBS (CIA) or ES-62 on days -2, 0 and 21 and then with PBS or IL-1β (1 μg/dose) twice-weekly from day 21 and articular scores (G) and incidence of pathology (H) monitored. The experiment was terminated prior to full pathology being established in the CIA control cohort due to the severity of joint disease in the IL-1β treatment groups. (G) Articular scores are presented as mean values ± SEM with n = 6 mice/group where *p<0.05 or ***p<0.001 are relative to the CIA group and (H) incidence represents the % mice displaying scores >1. (I) Representative sections of joint pathology displaying both the score of the joint shown and total articular score of the mouse presented. (J) global methylation status of SFs from the indicated cohorts of this CIA ± IL-1β model.
Fig 6
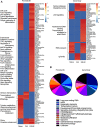
Fig 6. ES-62 induces a DNA methylation phenotype distinct from that of both Naïve- and CIA-SFs.
RRBS DNA methylome analysis was performed on SFs from joints representative of the Naïve, CIA (articular score each 3 or 4) and ES-62-CIA (articular score each 0 or 1) cohorts. (A) A heatmap of methylation percentages of “Promoter2K” regions (0–2,000bp upstream of TSS) for all cohorts, hierarchically clustered using the Euclidean distance metric. Bright red indicates 0% methylation, black indicates 50% methylation, and bright green indicates 100% methylation. The blue line corresponds to the methylation percentage of the respective regions, thus facilitating visual comparison of methylation percentages across samples (the dotted line represents 50% methylation for reference). (B) Methylome analysis of SFs from Naive, CIA- and ES-62-CIA mice showing Heat Map analysis of the top 100 differentially methylated loci in the Promoter3K (left panel) and Gene Body (right panel) regions of total genomic DNA. In each case, hypo (red) or hyper (blue) methylation in SFs from PBS- or ES-62-treated CIA-mice relative to SFs from healthy, naïve mice is shown in lanes 1 and 2 respectively, whilst that of SFs from ES-62- relative to PBS-treated CIA-mice is shown in lane 3.
Fig 7
Fig 7. Binary analysis of the DNA methylome indicates differential silencing and activation of genes in SFs from Naïve, CIA and ES-62-CIA mice.
Hierarchical clustering heatmaps (A) were constructed for the Promoter3K and Gene Body regions analysing genes which were either essentially fully methylated (>0.9) or demethylated (0) at these sites in one or more of the treatment groups. The heatmap clusters are annotated with predicted KEGG pathway interactions and the functional classification of genes constituting these binary DNA methylation signatures differentially targeted in pathogenic (CIA) and protective (ES-62) rewiring of SFs are summarized in the pie-charts according to the accompanying colour code (B).
Fig 8
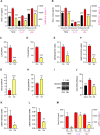
Fig 8. Exposure of CIA-mice to SMA 12b in vivo results in SF hypo-responsiveness ex vivo.
Mice were treated with PBS or 12b (1 μg/dose s/c) at days -2, 0 and 21 of the CIA protocol. Naïve-, CIA- and 12b-CIA SFs (12b) were incubated in medium (None), or medium containing either IL-17 (25 ng/ml) or LPS (1 μg/ml) as indicated for 24 h and IL-6 (A) or CCL2 (B) release measured. Levels of mRNA (normalised to GAPDH) in the indicated groups of SFs were determined for IL-6 (C), CCL2 (D), MMP9 (E), MMP13 (F), SOCS1 (G) and SOCS3 (H). For SOCS1 (G), the CIA control data are the same as those presented in Fig 1H. Data are presented as means ± SEM values of 3 independent cultures except for MMP9 and MMP13, where data are means ± SD, n = 3 from a single culture. (I) Western blot determination of SOCS3 expression in CIA and 12b SFs is normalised to that of ERK by Image J analysis. (J) Naïve-, CIA- and 12b-CIA SFs (12b) were treated with LPS for 6h and levels of miR-155 determined and the data presented as mean ± SEM values for three independent cultures. Levels of DNMT1 (K) and DNMT3 (L) mRNA (normalised to GAPDH) in CIA and 12b SFs are presented as means ± SD, n = 3 from a single culture. (M) From the first appearance of clinical articular score following challenge with collagen II (CII) at d21, mice were randomly allocated to blinded treatments (PBS or 12b, 1 μg/dose s/c) every 3 days until cull. CIA- and 12b-SFs were incubated in medium (None), or medium + either IL-1β (10 ng/ml) or BLP (0.5 μg/ml) for 24 h and IL-6 release measured. Data are mean ± SEM values of 3 independent cultures (each assayed in triplicate). Throughout, SFs were pooled from individual mice to generate representative explant cohorts with articular scores: (A-L) CIA, 3.66 ± 1.50, n = 6; 12b, 0.71 ± 0.36, n = 6 and (M) CIA, 5.50 ± 0.96, n = 4; 12b, 2.33 ± 0.33, n = 3. For statistical analysis, *p<0.05, **p<0.01 and ***p<0.001 are for the indicated responses relative to the CIA group.
Fig 9
Fig 9. Model of ES-62 action in SFs during CIA.
Healthy SFs (Naïve) respond to acute pro-inflammatory signals (e.g., IL-1β/IL-17) in the joint microenvironment resulting in release of pathological mediators such as IL-6, CCL2 and MMP9/13, which cause cell (neutrophils, macrophages, lymphocytes) infiltration and tissue damage, resulting in chronic inflammation. In addition to perpetuating joint inflammation and damage, chronic inflammation drives rewiring of the epigenetic landscape and consequently, reprogramming of the SFs to a “pathogenic” aggressive hyperplastic, migrating and invasive phenotype that, via its hyper-responsiveness to environmental cues, plays a key role in joint pathology and destruction (all pathogenic signals denoted by red arrows with imprinted hyper-responsiveness represented by increased arrow size and redness of SF). ES-62 can disrupt this process at multiple points: thus, it can inhibit (blue blocking symbol) the (i) initial pro-inflammatory signalling to suppress acute inflammation; (ii) inflammatory signals generated by infiltrating cells and tissue damage to suppress induction of chronic inflammation; (iii) signalling associated with chronic inflammation to suppress transformation of SFs to an aggressive hyper-responsive phenotype and (iv) pathogenic signals in aggressive SFs during established disease. Consistent with our findings that ES-62 does not simply maintain/restore the Naïve-SF phenotype, it also exhibits positive actions (blue lightning bolt symbol), specifically inducing epigenetic remodelling (perhaps of an intermediate anti-inflammatory SF phenotype, generated by inhibition of pathogenic ERK and STAT3 signalling) that reprograms the cell to an inflammation-resolving and tissue repair phenotype. The potential ability of the “resolving” ES-62-CIA-SFs to also directly influence the behavior of “pathogenic” SFs in the joint during established disease is represented by the red-blue gradient arrow.

Similar articles

Cited by

References

    1. Nygaard G, Firestein GS. Restoring synovial homeostasis in rheumatoid arthritis by targeting fibroblast-like synoviocytes. Nat Rev Rheumatol. 2020;16(6):316–33. doi: 10.1038/s41584-020-0413-5 - DOI - PMC - PubMed
    1. McInnes IB, Schett G. Pathogenetic insights from the treatment of rheumatoid arthritis. Lancet. 2017;389(10086):2328–37. doi: 10.1016/S0140-6736(17)31472-1 - DOI - PubMed
    1. Steenvoorden MM, Tolboom TC, van der Pluijm G, Löwik C, Visser CP, DeGroot J, et al.. Transition of healthy to diseased synovial tissue in rheumatoid arthritis is associated with gain of mesenchymal/fibrotic characteristics. Arthritis Research & Therapy. 2006;8(6):R165. doi: 10.1186/ar2073 - DOI - PMC - PubMed
    1. Nemtsova MV, Zaletaev DV, Bure IV, Mikhaylenko DS, Kuznetsova EB, Alekseeva EA, et al.. Epigenetic Changes in the Pathogenesis of Rheumatoid Arthritis. Frontiers in Genetics. 2019;10:570. doi: 10.3389/fgene.2019.00570 - DOI - PMC - PubMed
    1. Fearon U, Canavan M, Biniecka M, Veale DJ. Hypoxia, mitochondrial dysfunction and synovial invasiveness in rheumatoid arthritis. Nat Rev Rheumatol. 2016;12(7):385–97. doi: 10.1038/nrrheum.2016.69 - DOI - PubMed

Publication types

MeSH terms

Substances