. 2021 Oct 7;24(11):103242.
doi: 10.1016/j.isci.2021.103242. eCollection 2021 Nov 19.

Signal processing capacity of the cellular sensory machinery regulates the accuracy of chemotaxis under complex cues

Affiliations

Signal processing capacity of the cellular sensory machinery regulates the accuracy of chemotaxis under complex cues

Hye-Ran Moon et al. iScience. .

Abstract

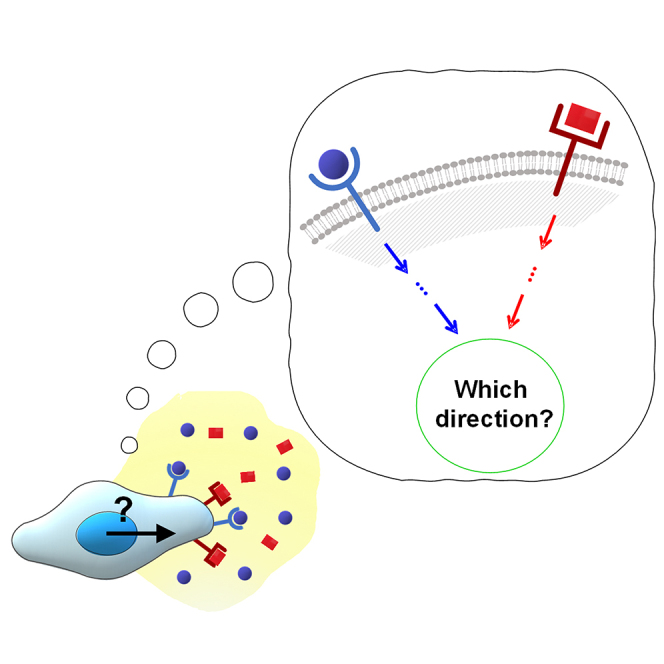
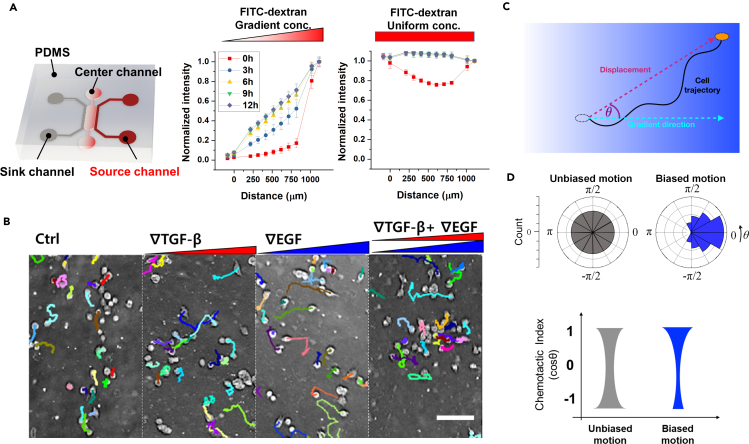
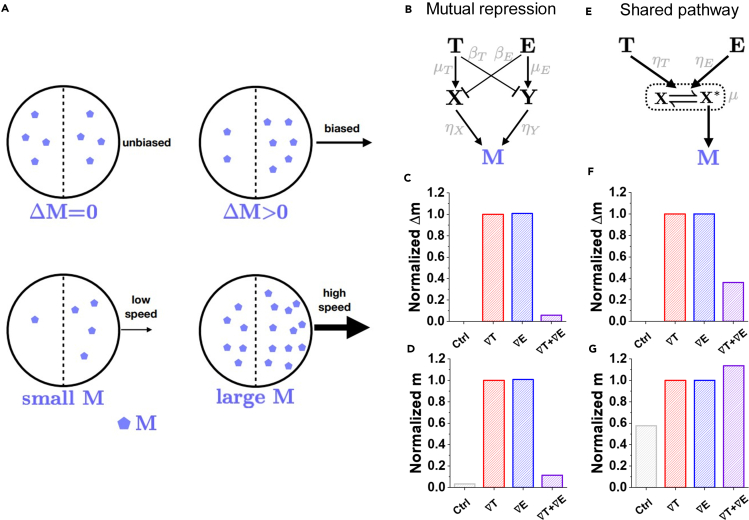
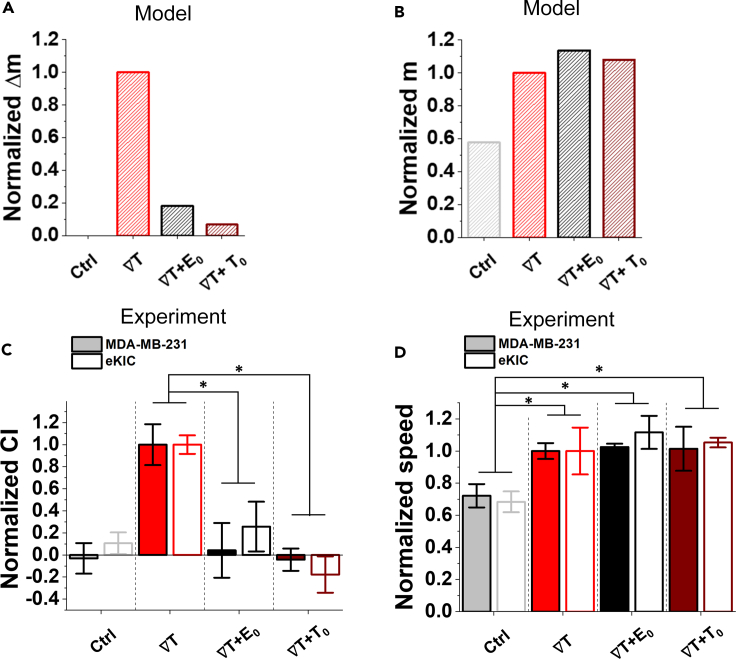
Chemotaxis is ubiquitous in many biological processes, but it still remains elusive how cells sense and decipher multiple chemical cues. In this study, we postulate a hypothesis that the chemotactic performance of cells under complex cues is regulated by the signal processing capacity of the cellular sensory machinery. The underlying rationale is that cells in vivo should be able to sense and process multiple chemical cues, whose magnitude and compositions are entangled, to determine their migration direction. We experimentally show that the combination of transforming growth factor-β and epidermal growth factor suppresses the chemotactic performance of cancer cells using independent receptors to sense the two cues. Based on this observation, we develop a biophysical framework suggesting that the antagonism is caused by the saturation of the signal processing capacity but not by the mutual repression. Our framework suggests the significance of the signal processing capacity in the cellular sensory machinery.

Keywords: Cell biology; Mathematical biosciences; Systems biology.


Conflict of interest statement

The authors declare no competing interests.

Figures

None
Graphical abstract
Figure 1
Figure 1
Chemotaxis platform and chemotaxis characteristics (A) Schematic description of a microfluidic chemotaxis platform to induce the chemical gradient. 10kDa FITC dextran (simulating TGF-β) develops a linear profile when supplied at the sink channel, or a uniform profile when supplied at both channels in the chemotaxis platform. Data points indicate average ± standard deviation of multiple measurements (N ≥ 3). (B) Representative micrographs of MDA-MB-231 cells with their trajectories for 9 hours. (C) Characterization of the measured cell trajectory. (D) Schematics of angular (θ) distribution of cell trajectories and corresponding chemotactic index (CI) distributions of unbiased (gray) and biased motions (blue).
Figure 2
Figure 2
Chemotactic performance of breast cancer cells is not synergistically augmented when TGF-β and EGF gradients are simultaneously imposed (A) Cell trajectories of a representative sample for control, 50nM/mm TGF-β gradient (∇T), 800nM/mm EGF gradient (∇E), and combined gradients of 50nM/mm TGF-β with 800nM/mm EGF (∇T+∇E) collected for 9 hours. Trajectories in a sample include >35 cells. (B) Angular (θ) distribution of cell trajectories from a representative sample for control (gray), ∇T(red), ∇E(blue), and ∇T+∇E(purple). (C) Distribution of chemotactic index (CI) from all trajectories collected from experimental trials (N > 3) including 158–233 trajectories per condition. Box represents quartiles with a median line in the middle of the box (∗: p < 0.05 in Mann-Whitney test). (D) Distribution of speed with a median line from all collected trajectories. Box: interquartile range (IQR) ± 1.5 IQR whiskers. A dot represents data from a single trajectory. (∗∗∗: p < 0.001, N.S: no significance with p > 0.05 in Mann-Whitney test) (See also Figure S1).
Figure 3
Figure 3
Antagonism of pancreatic cancer cells in the combined signal environment (A) Cell trajectories of a representative sample for control, 10nM/mm TGF-β gradient (∇T), 200nM/mm EGF gradient (∇E), and combined gradients of 10nM/mm TGF-β with 200nM/mm EGF (∇T+∇E) collected for 3 hours. Trajectories in a sample include >35 cells. (B) Angular (θ) distribution of cell trajectories from a representative sample for control (gray), ∇T(red), ∇E(blue), and ∇T+∇E(purple). (C) Distribution of chemotactic index (CI) from all trajectories collected from experimental trials (N > 3) including >100 trajectories per condition, respectively. Box represents quartiles with a median line in the middle of the box (∗: p < 0.05 in Mann-Whitney test). (D) Distribution of speed from all collected trajectories. Box: interquartile range (IQR) ± 1.5 IQR whiskers with a median line. A dot represents data from a single trajectory. (∗∗∗: p < 0.001, N.S: no significance with p > 0.05 in Mann-Whitney test) (See also Figure S1).
Figure 4
Figure 4
Mathematical model explains antagonism by saturation of a shared pathway (A) In the model the cell speed and chemotactic index (CI) scale with the concentration m of an intracellular species M, and its concentration difference Δm between the front and back of the cell, respectively. (B) In the mutual repression model, TGF-β and EGF mutually repress the other's activation pathway. (C) Δm exhibits antagonism (the response to both gradients is smaller than that of either alone). (D) m also exhibits antagonism. (E) In the shared pathway model, TGF-β and EGF convert a common component to its active state. (F) Δm exhibits antagonism. (G) m does not exhibit antagonism. Only the shared pathway results are consistent with the data in Figures 2 and 3. C, D, F, and G each shows results averaged over parameter space (see Method details) and normalized by the TGF-β gradient case (red) (See also Figure S2).
Figure 5
Figure 5
Model predicts and experiments confirm that elevated signal background reduces chemotactic bias but not speed (A–D) The model predicts that (A) the bias Δm decreases when a TGF-β gradient is combined with a uniform background of either EGF or TGF-β, whereas (B) the average m does not (See also Figure S3). Experiments confirm that for either cell type, (C) the chemotactic index (CI) is significantly suppressed when the TGF-β gradient is combined with a uniform background of either EGF or TGF-β, whereas (D) the speed is not, consistent with the predictions. (∗: p < .05, ∗∗: p < .01 in Student t-test). In all panels, the values are normalized by the TGF-β gradient case (red). The model uses Equation 2 with Δe = 0 (EGF background) or {e = 0, Δe = 0, t → 10t} (TGF background) and the same parameters as in Figure 4. The experiment uses the same TGF-β gradient as in Figures 2 and 3 (50 nM/mm for MDA-MB-231, 10 nM/mm for eKIC) combined with either uniform EGF (400 nM for MDA-MB-231, 100 nM for eKIC) or uniform TGF-β (200 nM for MDA-MB-231, 50 nM for eKIC). In experiment, bar represents mean of the medians ±S.E (n ≥ 3). The medians are collected from >35 trajectories in a sample, respectively. (∗: p < 0.05, ∗∗: p < 0.01, and N.S: no significance with p > 0.05 in student's t-test) (See also Figure S1).
Figure 6
Figure 6
Schematic of cellular multitasking capacity for chemotaxis (A) The shared pathway model predicts antagonism in the chemotactic response (as in the experiments) for large amplification factor α and balanced relative pathway strength ρ but synergy in the response for small α (see Method details for phase boundaries). (B) Illustration of α and ρ in the general context of a signaling network defined by pathway convergence.

Similar articles

Cited by

References

    1. Alon U., Surette M.G., Barkai N., Leibler S. Robustness in bacterial chemotaxis. Nature. 1999;397:168–171. - PubMed
    1. Barberis M., Verbruggen P. Quantitative systems biology to decipher design principles of a dynamic cell cycle network: the “Maximum Allowable mammalian Trade–Off–Weight”(MAmTOW) NPJ Syst. Biol. Appl. 2017;3:1–14. - PMC - PubMed
    1. Bradney M.J., Venis S.M., Yang Y., Konieczny S.F., Han B. A biomimetic tumor model of heterogeneous invasion in pancreatic ductal adenocarcinoma. Small. 2020;16 1905500. - PMC - PubMed
    1. Bulle A., Lim K.-H. Beyond just a tight fortress: contribution of stroma to epithelial-mesenchymal transition in pancreatic cancer. Signal Transduction Targeted Ther. 2020;5:1–12. - PMC - PubMed
    1. Carballo-Pacheco M., Desponds J., Gavrilchenko T., Mayer A., Prizak R., Reddy G., Nemenman I., Mora T. Receptor crosstalk improves concentration sensing of multiple ligands. Phys. Rev. E. 2019;99:022423. - PubMed

LinkOut - more resources