Alpha-Synuclein, cyclooxygenase-2 and prostaglandins-EP2 receptors as neuroinflammatory biomarkers of autism spectrum disorders: Use of combined ROC curves to increase their diagnostic values
- PMID: 34742290
- PMCID: PMC8571879
- DOI: 10.1186/s12944-021-01578-7
Alpha-Synuclein, cyclooxygenase-2 and prostaglandins-EP2 receptors as neuroinflammatory biomarkers of autism spectrum disorders: Use of combined ROC curves to increase their diagnostic values
Erratum in
-
Correction to: Alpha-Synuclein, cyclooxygenase-2 and prostaglandins-EP2 receptors as neuroinflammatory biomarkers of autism spectrum disorders: Use of combined ROC curves to increase their diagnostic values.Lipids Health Dis. 2021 Nov 28;20(1):172. doi: 10.1186/s12944-021-01598-3. Lipids Health Dis. 2021. PMID: 34838046 Free PMC article. No abstract available.
Abstract
Background: Autism spectrum disorder (ASD) is a neurodevelopmental disorder characterized by impairments in social interaction and restricted and repetitive behaviors. Neuroinflammation and abnormal lipid mediators have been identified in multiple investigations as an acknowledged etiological mechanism of ASD that can be targeted for therapeutic intervention.
Methods: In this study, multiple regression and combined receiver operating characteristic (ROC) curve analyses were used to determine the relationship between the neuroinflammatory marker α-synuclein and lipid mediator markers related to inflammation induction, such as cyclooxygenase-2 and prostaglandin-EP2 receptors, in the etiology of ASD. Additionally, the study aimed to determine the linear combination that maximizes the partial area under ROC curves for a set of markers. Forty children with ASD and 40 age- and sex-matched controls were enrolled in the study. Using ELISA, the levels of α-synuclein, cyclo-oxygenase-2, and prostaglandin-EP2 receptors were measured in the plasma of both groups. Statistical analyses using ROC curves and multiple and logistic regression models were performed.
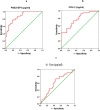
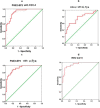
Results: A remarkable increase in the area under the curve was observed using combined ROC curve analyses. Moreover, higher specificity and sensitivity of the combined markers were reported.
Conclusions: The present study indicates that measurement of the predictive value of selected biomarkers related to neuroinflammation and lipid metabolism in children with ASD using a ROC curve analysis should lead to a better understanding of the etiological mechanism of ASD and its link with metabolism. This information may facilitate early diagnosis and intervention.
Keywords: Autism; Cyclooxygenase-2; Neuroinflammation; Prostaglandin-EP2 receptors; α-Synuclein.
© 2021. The Author(s).
Conflict of interest statement
The authors have no competing interests to declare.
Figures


Similar articles
-
Predictive value of selected biomarkers related to metabolism and oxidative stress in children with autism spectrum disorder.Metab Brain Dis. 2017 Aug;32(4):1209-1221. doi: 10.1007/s11011-017-0029-x. Epub 2017 May 11. Metab Brain Dis. 2017. PMID: 28497358
-
Impaired lipid metabolism markers to assess the risk of neuroinflammation in autism spectrum disorder.Metab Brain Dis. 2018 Aug;33(4):1141-1153. doi: 10.1007/s11011-018-0206-6. Epub 2018 Mar 22. Metab Brain Dis. 2018. PMID: 29569150
-
Combining Anti-Mitochondrial Antibodies, Anti-Histone, and PLA2/COX Biomarkers to Increase Their Diagnostic Accuracy for Autism Spectrum Disorders.Brain Sci. 2024 Jun 5;14(6):576. doi: 10.3390/brainsci14060576. Brain Sci. 2024. PMID: 38928576 Free PMC article.
-
Perspective Biological Markers for Autism Spectrum Disorders: Advantages of the Use of Receiver Operating Characteristic Curves in Evaluating Marker Sensitivity and Specificity.Dis Markers. 2015;2015:329607. doi: 10.1155/2015/329607. Epub 2015 Nov 8. Dis Markers. 2015. PMID: 26648598 Free PMC article. Review.
-
The Role of Alpha-Synuclein and Other Parkinson's Genes in Neurodevelopmental and Neurodegenerative Disorders.Int J Mol Sci. 2020 Aug 10;21(16):5724. doi: 10.3390/ijms21165724. Int J Mol Sci. 2020. PMID: 32785033 Free PMC article. Review.
Cited by
-
Synucleins As Biomarkers of Severity in Autism Spectrum Disorder.Cureus. 2024 Sep 13;16(9):e69356. doi: 10.7759/cureus.69356. eCollection 2024 Sep. Cureus. 2024. PMID: 39398840 Free PMC article.
-
Autism spectrum disorder and a possible role of anti-inflammatory treatments: experience in the pediatric allergy/immunology clinic.Front Psychiatry. 2024 Jun 24;15:1333717. doi: 10.3389/fpsyt.2024.1333717. eCollection 2024. Front Psychiatry. 2024. PMID: 38979496 Free PMC article. Review.
-
Influence of Auditory Integrative Training on Casein Kinase 2 and Its Impact on Behavioral and Social Interaction in Children with Autism Spectrum Disorder.Curr Issues Mol Biol. 2023 May 15;45(5):4317-4330. doi: 10.3390/cimb45050274. Curr Issues Mol Biol. 2023. PMID: 37232743 Free PMC article.
-
Reply to: "Qualitative Evaluation of α-Synuclein: A Critical Step in Unravelling the Complexities of Autism Spectrum Disorder".Med Princ Pract. 2023;32(1):98. doi: 10.1159/000528530. Epub 2023 Jan 10. Med Princ Pract. 2023. PMID: 36626877 Free PMC article. No abstract available.
-
The Role of Alpha-Synuclein in Neurodevelopmental Diseases.Mol Neurobiol. 2025 Jan;62(1):962-972. doi: 10.1007/s12035-024-04305-2. Epub 2024 Jun 29. Mol Neurobiol. 2025. PMID: 38949729 Review.
References
-
- Bhatia MS, Rajender G, Malhotra S, Kanwal K, Chaudhary D. Current understanding of neurobiology of autism spectrum disorders and its nosological implications. Delhi Psychiatry J. 2010;13:18–28.
-
- Abruzzo PM, Ghezzo A, Bolotta A, Ferreri C, Minguzzi R, Vignini A, et al. Perspective biological markers for autism Spectrum disorders:advantages of the use of receiver operating characteristic curves in evaluating marker sensitivity and specificity. Dis Markers. 2015;329607. 10.1155/2015/329607. - PMC - PubMed
MeSH terms
Substances
Grants and funding
LinkOut - more resources
Full Text Sources
Medical
Research Materials

