Microsecond melting and revitrification of cryo samples
- PMID: 34734102
- PMCID: PMC8550802
- DOI: 10.1063/4.0000129
Microsecond melting and revitrification of cryo samples
Abstract
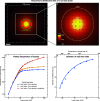
The dynamics of proteins that are associated with their function typically occur on the microsecond timescale, orders of magnitude faster than the time resolution of cryo-electron microscopy. We have recently introduced a novel approach to time-resolved cryo-electron microscopy that affords microsecond time resolution. It involves melting a cryo sample with a heating laser, so as to allow dynamics of the proteins to briefly occur in the liquid phase. When the laser is turned off, the sample rapidly revitrifies, trapping the particles in their transient configurations. Precise control of the temperature evolution of the sample is crucial for such an approach to succeed. Here, we provide a detailed characterization of the heat transfer occurring under laser irradiation as well as the associated phase behavior of the cryo sample. While areas close to the laser focus undergo melting and revitrification, surrounding regions crystallize. In situ observations of these phase changes therefore provide a convenient approach for assessing the temperature reached in each melting and revitrification experiment and for adjusting the heating laser power on the fly.
© 2021 Author(s).
Figures


Similar articles
-
Microsecond melting and revitrification of cryo samples with a correlative light-electron microscopy approach.Front Mol Biosci. 2022 Nov 10;9:1044509. doi: 10.3389/fmolb.2022.1044509. eCollection 2022. Front Mol Biosci. 2022. PMID: 36438663 Free PMC article.
-
Near-atomic resolution reconstructions from in situ revitrified cryo samples.Acta Crystallogr D Struct Biol. 2023 Jun 1;79(Pt 6):473-478. doi: 10.1107/S2059798323003431. Epub 2023 May 23. Acta Crystallogr D Struct Biol. 2023. PMID: 37219589 Free PMC article.
-
Microsecond melting and revitrification of cryo samples: protein structure and beam-induced motion.Acta Crystallogr D Struct Biol. 2022 Jul 1;78(Pt 7):883-889. doi: 10.1107/S205979832200554X. Epub 2022 Jun 14. Acta Crystallogr D Struct Biol. 2022. PMID: 35775987 Free PMC article.
-
Microsecond time-resolved cryo-electron microscopy.Curr Opin Struct Biol. 2024 Aug;87:102840. doi: 10.1016/j.sbi.2024.102840. Epub 2024 May 28. Curr Opin Struct Biol. 2024. PMID: 38810313 Review.
-
Determining the Crystal Structure of TRPV6.In: Kozak JA, Putney JW Jr, editors. Calcium Entry Channels in Non-Excitable Cells. Boca Raton (FL): CRC Press/Taylor & Francis; 2018. Chapter 14. In: Kozak JA, Putney JW Jr, editors. Calcium Entry Channels in Non-Excitable Cells. Boca Raton (FL): CRC Press/Taylor & Francis; 2018. Chapter 14. PMID: 30299652 Free Books & Documents. Review.
Cited by
-
Microsecond melting and revitrification of cryo samples with a correlative light-electron microscopy approach.Front Mol Biosci. 2022 Nov 10;9:1044509. doi: 10.3389/fmolb.2022.1044509. eCollection 2022. Front Mol Biosci. 2022. PMID: 36438663 Free PMC article.
-
A simple flash and freeze system for cryogenic time-resolved electron microscopy.Front Mol Biosci. 2023 Mar 7;10:1129225. doi: 10.3389/fmolb.2023.1129225. eCollection 2023. Front Mol Biosci. 2023. PMID: 36959978 Free PMC article.
-
Fast viral dynamics revealed by microsecond time-resolved cryo-EM.Nat Commun. 2023 Sep 13;14(1):5649. doi: 10.1038/s41467-023-41444-x. Nat Commun. 2023. PMID: 37704664 Free PMC article.
-
Near-atomic resolution reconstructions from in situ revitrified cryo samples.Acta Crystallogr D Struct Biol. 2023 Jun 1;79(Pt 6):473-478. doi: 10.1107/S2059798323003431. Epub 2023 May 23. Acta Crystallogr D Struct Biol. 2023. PMID: 37219589 Free PMC article.
-
Shaped Laser Pulses for Microsecond Time-Resolved Cryo-EM: Outrunning Crystallization during Flash Melting.J Phys Chem Lett. 2024 Apr 25;15(16):4244-4248. doi: 10.1021/acs.jpclett.4c00315. Epub 2024 Apr 11. J Phys Chem Lett. 2024. PMID: 38602841 Free PMC article.
References
-
- Frank J., Conformational Proteomics of Macromolecular Architecture: Approaching the Structure of Large Molecular Assemblies and Their Mechanisms of Action ( World Scientific, Singapore, 2004), Chap. 13.
-
- Frank J., Three-Dimensional Electron Microscopy of Macromolecular Assemblies: Visualization of Biological Molecules in Their Native State ( Oxford University Press, New York, 2006).
LinkOut - more resources
Full Text Sources

