. 2021 Oct 13:12:738073.
doi: 10.3389/fimmu.2021.738073. eCollection 2021.

Immune Response in Severe and Non-Severe Coronavirus Disease 2019 (COVID-19) Infection: A Mechanistic Landscape

Affiliations

Immune Response in Severe and Non-Severe Coronavirus Disease 2019 (COVID-19) Infection: A Mechanistic Landscape

Kavitha Mukund et al. Front Immunol. .

Abstract

The mechanisms underlying the immune remodeling and severity response in coronavirus disease 2019 (COVID-19) are yet to be fully elucidated. Our comprehensive integrative analyses of single-cell RNA sequencing (scRNAseq) data from four published studies, in patients with mild/moderate and severe infections, indicate a robust expansion and mobilization of the innate immune response and highlight mechanisms by which low-density neutrophils and megakaryocytes play a crucial role in the cross talk between lymphoid and myeloid lineages. We also document a marked reduction of several lymphoid cell types, particularly natural killer cells, mucosal-associated invariant T (MAIT) cells, and gamma-delta T (γδT) cells, and a robust expansion and extensive heterogeneity within plasmablasts, especially in severe COVID-19 patients. We confirm the changes in cellular abundances for certain immune cell types within a new patient cohort. While the cellular heterogeneity in COVID-19 extends across cells in both lineages, we consistently observe certain subsets respond more potently to interferon type I (IFN-I) and display increased cellular abundances across the spectrum of severity, as compared with healthy subjects. However, we identify these expanded subsets to have a more muted response to IFN-I within severe disease compared to non-severe disease. Our analyses further highlight an increased aggregation potential of the myeloid subsets, particularly monocytes, in COVID-19. Finally, we provide detailed mechanistic insights into the interaction between lymphoid and myeloid lineages, which contributes to the multisystemic phenotype of COVID-19, distinguishing severe from non-severe responses.

Keywords: COVID-19; MDSC; aggregation; cDC2; immune-remodeling; low-density neutrophils; megakaryocyte; plasmablast.


Conflict of interest statement

Phenotyping of the independent cohort was performed at Plexision, a University of Pittsburgh spinoff in which RS and the University hold equity. RS and CA are currently employed at Plexision. The remaining authors declare that the research was conducted in the absence of any commercial or financial relationships that could be construed as a potential conflict of interest.

Figures

Figure 1
Figure 1
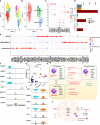
Overview of data integration and cellular heterogeneity. (A) UMAP embedding of the integrated dataset highlighting cell distribution from coronavirus disease 2019 (COVID-19) and healthy subjects. The integration was performed using Seurat 3.2 (see Materials and Methods) and represents the combined data from four studies including Arunachalam et al. (PA), Lee et al. (Lee), Schulte-Schrepping (two cohorts SS1 and SS2), and Wilk et al. (Wilk). (B) UMAP embedding of the 70 clusters detected within the integrated dataset. (C) Twenty distinct cellular compartments identified after grouping the 70 clusters based on automatic (SingleR) and manual annotation. (D) Abundance distribution of the 20 cell types across healthy, severe, and non-severe diseases. CD14+ monocytes showed the most drastic expansion within severe and non-severe diseases. Loss of cellular abundances associated within COVID-19 samples for mucosal-associated invariant T (MAIT) and gamma-delta T (γδT) was observed. (E) The downstream analysis of immune cell types was performed in the context of their origin. Red lettering indicates cell types that expand within COVID-19, green indicate cell types with reducing abundances in COVID-19, and gray indicates cell types unexplored within our current manuscript. HSC, hematopoietic stem cells; CLP, common lymphoid progenitor cells; LMPP, LYMPHOID-primed multi-potential progenitor cells; CMP, common myeloid progenitor cells; MEP, megakaryocyte–erythroid progenitor cells; GMP, granulocyte–macrophage progenitor cells. (F) Outline of the major functional features associated with the consensus gene signatures identified across lineages and severities.
Figure 2
Figure 2
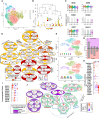
Classical monocytes and myeloid dendritic cells. (A) UMAP embedding of monocytes; subset from the original Seurat object. The first of the three embeddings capture the 18 clusters identified; the next captures the grouping of these clusters into distinct subsets, NCM (non-classical monocyte), ITM (intermediate monocyte), CM1–CM8 (classical monocytes), and mMDSC (myeloid-derived suppressor cells). The final embedding captures the severity of the cells. (B) Indicates a dotplot of the average expression of the major markers, which are used to classify monocyte subsets into CM, NCM, ITM, and mMDSC. (C) Relative cell abundances for each of the 10 subsets identified within healthy, severe, and non-severe subsets. (D) Average expression dotplot of major markers identified within classical monocytes that were used to further characterize the CM subsets. (E) Average expression dotplot highlighting the expression of several known gene marker involved in various aspects of monocyte functioning. The outermost five concentric rings in the circle plot correspond to the subsets who each have more cells from severe samples (mMDSC, ITM, CM7, CM3, and CM1), middle two rings (CM4 and CM8) have more cells from non-severe samples, and inner four rings (NCM, CM5, CM2, and CM6) have more cells from healthy samples. Colored lines indicate the transcription factor (TF) targets expressed within each subset. (F) Dotplot highlights the differences in average expression of cluster markers involved in interferon signaling and degranulation within CM1 alone, across severities. (G) DoRothEA TF analysis for cells from CM1 identified differential activity for TFs such as FOSL1, FOSL2, and SMAD3 particularly within severe disease. (H) For the subsets with increased abundance in COVID-19 including CM1, CM3, CM4, CM7, CM8, and ITM, expression dotplot highlights increased activity for markers associated with monocytic adhesion migration and signaling. (I) For the same subsets as in panel H, the heatmap highlights fold changes for genes that have been previously implicated in the formation of monocyte doublets within pathology. (J) Myeloid dendritic cell (mDC) clusters and their count distribution across severity. (K) mDCs identified in the integrated dataset represent a mix of conventional DCs (cDC2 and CD1C+ DCs) (cluster 35) and pre-DCs (cluster 62). (L) A functional map that highlights the role of these various subsets. Relevant cluster markers are highlighted for each subset. We identified two distinct phenotypes associated with the monocytic subsets-immunosuppressive and proinflammatory. The * by CM1, a suppressive subset, indicates the differential interferon type I (IFN-I) responses between severe and non-severe disease, in particular, a more suppressed IFN response within severe subsets due to likely action of repressive factors including FOSL1 (seen in G above). While the theme of interferon response is shared by the subsets, the more nuanced analysis informs us that CM1 and mMDSC lead to immunosuppressive, specifically T cell-suppressive phenotype. CM1 also expressed genes indicative of emergency myelopoiesis in severe coronavirus disease 2019 (COVID-19) infection. Several CM classes share homotypic aggregation and express genes contributing to platelet-monocyte aggregation, thus leading to the hypercoagulability phenotype in severe infection. IL-1 dynamics within each of these subsets were particularly interesting, with increased expression within non-severe disease for CM and mDCs indicative of a dysfunctional mDC state within severe COVID-19.
Figure 3
Figure 3
Low-density neutrophils. (A) The UMAP embedding of the low-density neutrophils; subset from the original Seurat object after reclustering, highlighting the nine clusters identified. (B) This UMAP highlights the grouping of these nine clusters into three distinct neutrophil subsets. (C) The dotplot highlights major neutrophil markers identified in the nine clusters, which form the basis for clustering into three distinct groups, namely, low-density granulocytes (LDGs), progenitor-like cells, and polymorphonuclear myeloid-derived suppressor cells (PMN-MDSCs). (D) Distribution of the cells from each of the subsets identified. (E) The top 20 cluster markers identified within the three distinct cellular subsets. (F) Violin plots capture the expression levels of specific genes discussed within the main text, which are specifically expressed in one of the three subsets. (G) Cell abundances validated within an independent patient cohort highlight the significant expansion of PMN-MDSCs. (H) A functional map of interaction between the three subsets identified within the low-density neutrophils (LDNs). The cluster markers for each subset are highlighted within. Red text indicates increase within COVID-19, and green indicates a reduction. (I) Violin plots of markers that define a megakaryocyte population. (J) The major functional aspects observed within megakaryocytes (MKs) characterized by GATA-1 low expression and a likelihood for emperipolesis are captured within this representation.
Figure 4
Figure 4
Natural killer cells. (A) UMAP embedding of the natural killer (NK) cells after reclustering the subset from the original Seurat object. The first of the two embeddings capture the 18 clusters identified. (B) The grouping of the 18 clusters into distinct subsets, NK1–NK7. (C) The dotplot of average expression of the major markers that were used to classify NK cell subsets including genes such as the lytic granules, such as granzymes (GZMB/K/A), PRF1; inhibitory KIRs; negative regulators including PFN1 and CST7; transcription factors (TFs) such as PRDM1 and cytoskeletal proteins including ACTB, ARPC3/4. (D) The expression of three major surface markers that define NK cell maturity including CD56 (NCAM1), CD16 (FCGR3A), and CD44. NK3–5 and NK7–8 represent a CD56low CD16+; NK2 and NK6 were identified as CD56+. NK1 was identified to represent a unique group of cells that lacked CD56 expression and had low CD16 expression. (E) Cell count distribution of the NK subsets NK1–7. NK1 (blue box) is the only subset with severe abundance loss within disease, while NK4 (red box) is the only subset that has increased abundances within disease. (F) DoRothEA TF-target enrichment performed on all cells from the NK1 cluster highlights an increased activity of early TFs such as SOX9, FOXP1, FOXA2, and NR3C1, suggestive of a more precursor/immature like cell state. (G) DoRothEA analysis on severe and non-severe cells in subset NK4 highlights the increased activity of STAT1/2 and IRF1/9 in keeping with the increased interferon response seen from NK4. (H) A functional map of the NK subsets identified within coronavirus disease 2019 (COVID-19), with cluster markers represented within each subset. NK1 (CD56CD16low) represented a unique subset of cells, mostly seen in healthy and lost within COVID-19. These cells exhibit reduced NCR expression, subsequently implying a reduced cytotoxic potential and ability to communicate T and neutrophils. Within the CD16+ subsets, we identified an expanded subset that responded potently to interferon type I (IFN-I). The cluster markers of this subset were also significantly differentially expressed in severe and non-severe compared with healthy subjects. Red text indicates increased activity, while green text indicates reduced activity.
Figure 5
Figure 5
CD4T/8T, mucosal-associated invariant T (MAIT), and gamma-delta T (γδT) cells. (A) The UMAP highlights the 18 clusters retained after subsetting CD4T and CD8T cells from parent Seurat object. The right panel shows a side-by-side UMAP of distribution of the various T subtypes (arrived at by grouping cluster based on expression of key factors as identified; see Supplementary Figure S6B ) in severe, non-severe, and healthy donors. (B) A barplot highlighting the abundance differences for each of the eight subtypes identified here across severe, non-severe, and healthy samples. (C) The UMAP embeddings of only the MAIT and γδT cells from the original Seurat object. Colors highlight the severities of the cell captured within each cell type. As highlighted also in Figure 1D , γδT cells had severely reduced abundances within disease. (D) Immunophenotyping revealed similar reductions in MAIT and γδT cell population within an independent patient cohort of coronavirus disease 2019 (COVID-19) and patients exhibiting varying levels of severity. (E) Violin plots highlight the increased expression of CD3E and a suppression of CD3ζ (CD247) within COVID-19, for both γδT and MAIT cells, consistent with expression patterns seen within MAIT and γδT in the presence of neutrophils. Suppression of CD247 chain further indicates compromised T-cell signaling without change to T-cell viability.
Figure 6
Figure 6
Naïve B cells and plasmablasts (PBs). (A) UMAP of subsampled and reclustered naïve B cells (see Materials and Methods) with initial clusters 0–6 and 8–10. (B) Hierarchical clustering grouped together clusters with similar proportions of healthy, non-severe, and severe cells. The number of cells in each severity category is shown in the corresponding bar graphs under the dendrogram. This resulted in six final groups as summarized in the horizontal box underneath the bar graph: A–F had more healthy and non-severe cells than severe (orange, H, NS > S), and E and F had more severe than healthy, non-severe (red, S > H, NS). (C) Violin plot showing expression of selected immunoglobulin heavy and light chains in groups A–F. (D) Group-dependent gene expression patterns in several categories that modulate naïve B-cell function and subsequent activation, including B-cell receptor signaling, calcium handling, MHC-II components, B-cell activation factor (BAFF) receptor, interferon (IFN) response, metabolism, stress response, priming for proliferation, adhesion, and transcriptional regulation, including AP-1 transcription factor (TFs). Each oval contains the gene name with percent and average expression of that gene across the six groups A–F. Each gene had significant differential expression (p.adj ≤ 0.05) unless otherwise specified. Genes within dark red colored ovals were expressed more in severe coronavirus disease 2019 (COVID-19); genes within orange ovals were expressed more in non-severe cells; genes in red and orange striped ovals had expression in both severe and non-severe cells. (E) Six clusters with surface marker expression most characteristic of PBs (CD19, MS4A1, CD27+, and CD38+) were retained after subsampling and reclustering the parent Seurat object (see Supplementary Figures S8F, G ). (F) Four PBs subsets (PB1, PB2, PB3, and PB4) were defined from six clusters in (E) based on expression of the top cluster markers ( Figure S8H ). (G) Bar graphs show number of cells from non-severe (purple) and severe (pink) coronavirus disease 2019 (COVID-19) patients in each PB subset (1 = PB1, 2 = PB2, 3 = PB3, and 4 = PB4). (H) Cell surface marker expression across four PB subsets (1 = PB1, 2 = PB2, 3 = PB3, and 4 = PB4) reflects PB population heterogeneity with respect to B-cell receptors, cytokine/chemokine receptors, adhesion molecules, and antigen presentation. (I) PB subset-dependent expression of immunoglobulin chain genes (1 = PB1, 2 = PB2, 3 = PB3, and 4 = PB4). (J) Subset-dependent expression of core TFs that regulate PB commitment and several downstream targets, including genes involved in mediating endoplasmic reticulum (ER) stress, proteasome function, microtubules, and IFN response. Each oval contains the gene name with percent and average expression of that gene across the four PB subsets (1 = PB1, 2 = PB2, 3 = PB3, and 4 = PB4). Superscript denotes that the gene had significant differential expression (p.adj ≤ 0.05) in that subset relative to the other subsets.
Figure 7
Figure 7
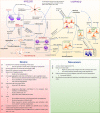
Transcriptomic and cellular heterogeneity of immune response within coronavirus disease 2019 (COVID-19). This figure encapsulates the main results identified within our manuscript. Rapid expansion of specific monocytic subsets, megakaryocyte, plasmablasts, and low-density neutrophils, along with reduction in cellular frequencies of mucosal-associated invariant T (MAIT), gamma-delta T (γδT), and natural killer cells, is seen within COVID-19, particularly severe disease. The observed reduction of myeloid dendritic cells could be a consequence of emergency monopoiesis, which results in the drastic expansion of suppressive subsets such as CM1 monocytes in severe disease. We observe an increased activation of interferon type I (IFN-I) response, interferon-stimulated genes (ISGs), and alarmins arising from both lymphoid and myeloid cells. However, low-density granulocytes (LDGs) and CM1 show a more muted response to IFN-I in severe disease, compared with non-severe disease. The increased oxidative stress along with alarmins likely contributes to the suppression of T cells particularly MAIT and γδT. Neutrophils/LDNs have an increased tendency to spontaneously produce neutrophil extracellular traps (NETs), which has been observed in COVID-19 and suggested to contribute to the coagulopathy in COVID-19. Additionally, both monocytes and LDNs presented transcriptional signatures associated with aggregation, especially in severe COVID-19. The increase in MKs in circulation and likely emperipolesis within COVID-19 adds to the mounting evidence on the potent link between thromboembolic events mediated by platelets and their precursors and neutrophils/LDNs. A potential link between immune thrombocytopenia observed in patients and the expansion of MKs/emperipolesis, increased aggregation potential of various immune cell types, and generation of autoantibodies warrant further investigations especially within severe COVID-19 patients. The accompanying bottom panel highlights all differences observed in our manuscript between severe and non-severe disease.

Similar articles

Cited by

References

    1. Lavine JS, Bjornstad ON, Antia R. Immunological Characteristics Govern the Transition of COVID-19 to Endemicity. Science (2021) 371(6530):741–5. - PMC - PubMed
    1. Mukund K, Mathee K, Subramaniam S. Plasmin Cascade Mediates Thrombotic Events in SARS-CoV-2 Infection via Complement and Platelet-Activating Systems. IEEE Open J Eng Med Biol (2020) 1:220–7. doi: 10.1109/OJEMB.2020.3014798 - DOI - PMC - PubMed
    1. Blanco-Melo D, Nilsson-Payant B, Liu WC, Uhl S, Hoagland D, Møller R, et al. . Imbalanced Host Response to SARS-CoV-2 Drives Development of COVID-19. Cell (2020) 181(5):1036–45. doi: 10.1016/j.cell.2020.04.026 - DOI - PMC - PubMed
    1. Lee JS, Park S, Jeong HW, Ahn JY, Choi SJ, Lee H, et al. . Immunophenotyping of COVID-19 and Influenza Highlights the Role of Type I Interferons in Development of Severe COVID-19. Sci Immunol (2020) 5(49):eabd1554. doi: 10.1126/sciimmunol.abd1554 - DOI - PMC - PubMed
    1. Schulte-Schrepping J, Reusch N, Paclik D, Baßler K, Schlickeiser S, Zhang B, et al. . Severe COVID-19 Is Marked by a Dysregulated Myeloid Cell Compartment. Cell (2020) 182:1419–40. doi: 10.1016/j.cell.2020.08.001 - DOI - PMC - PubMed

Publication types

MeSH terms

Substances