

Isoform-specific Roles of Prolyl Hydroxylases in the Regulation of Pancreatic β-Cell Function
- PMID: 34718519
- PMCID: PMC8643417
- DOI: 10.1210/endocr/bqab226
Isoform-specific Roles of Prolyl Hydroxylases in the Regulation of Pancreatic β-Cell Function
Abstract
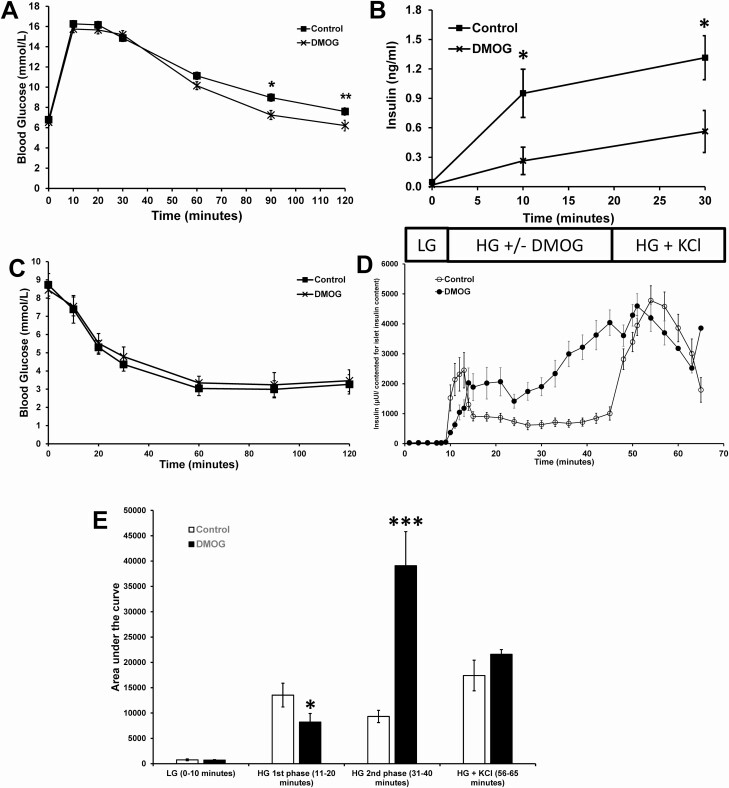
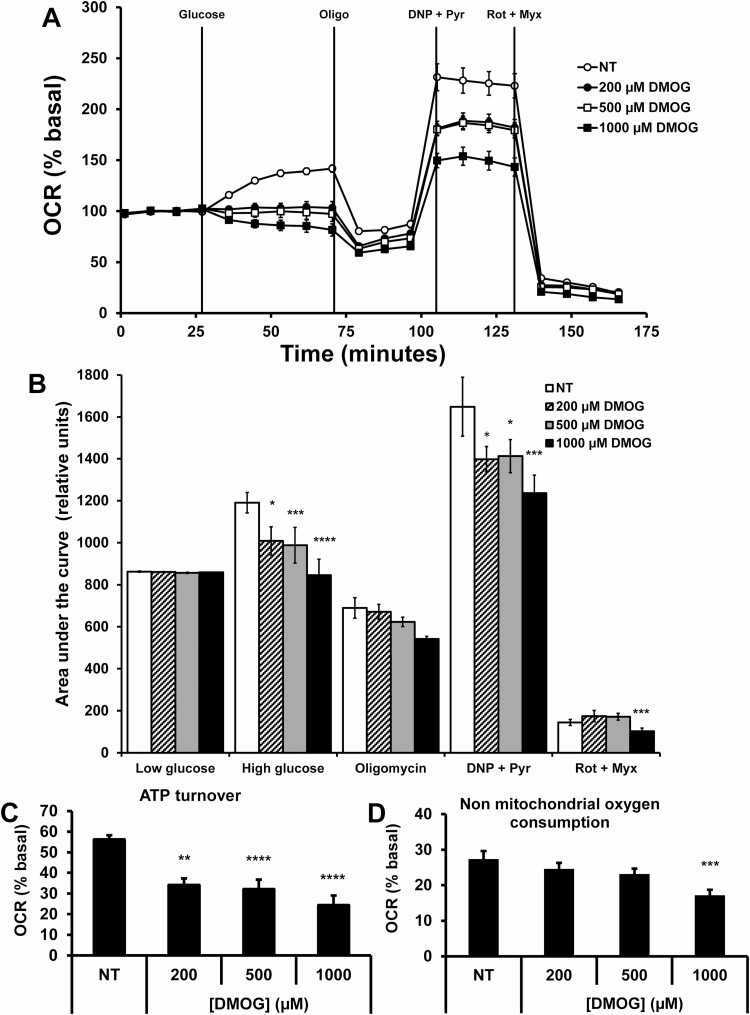
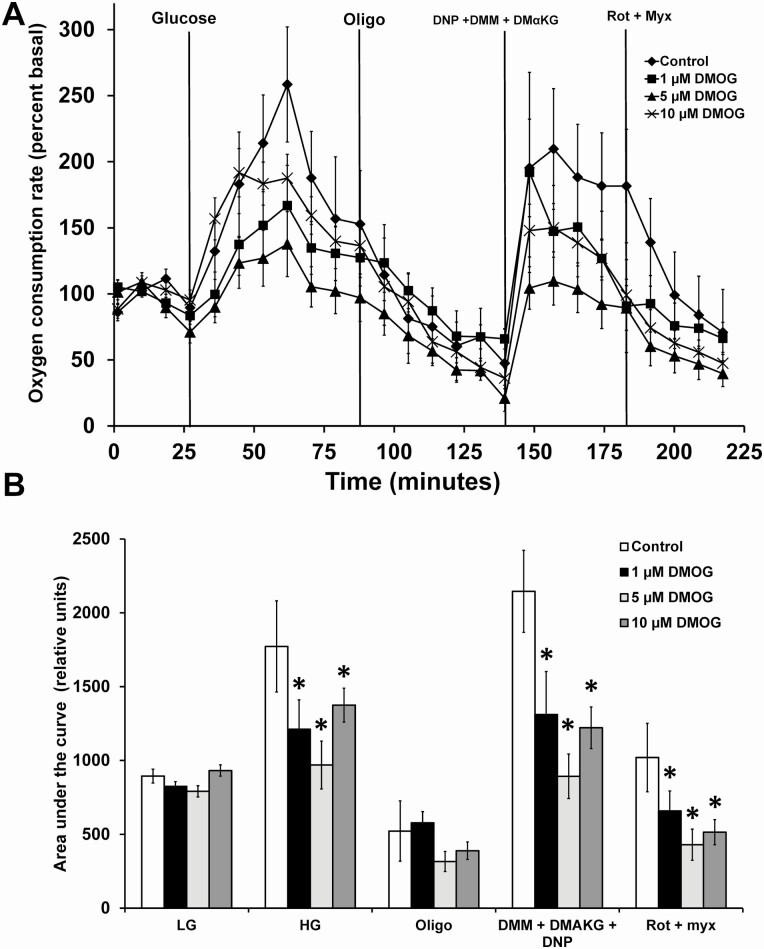
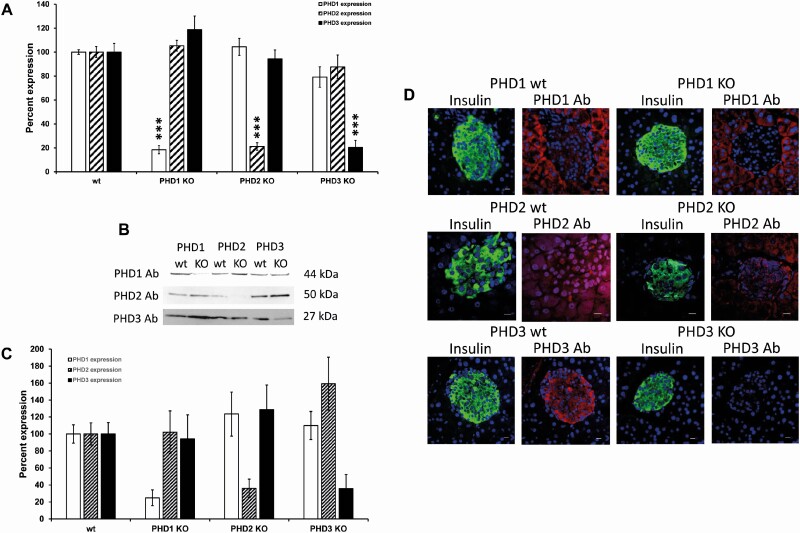
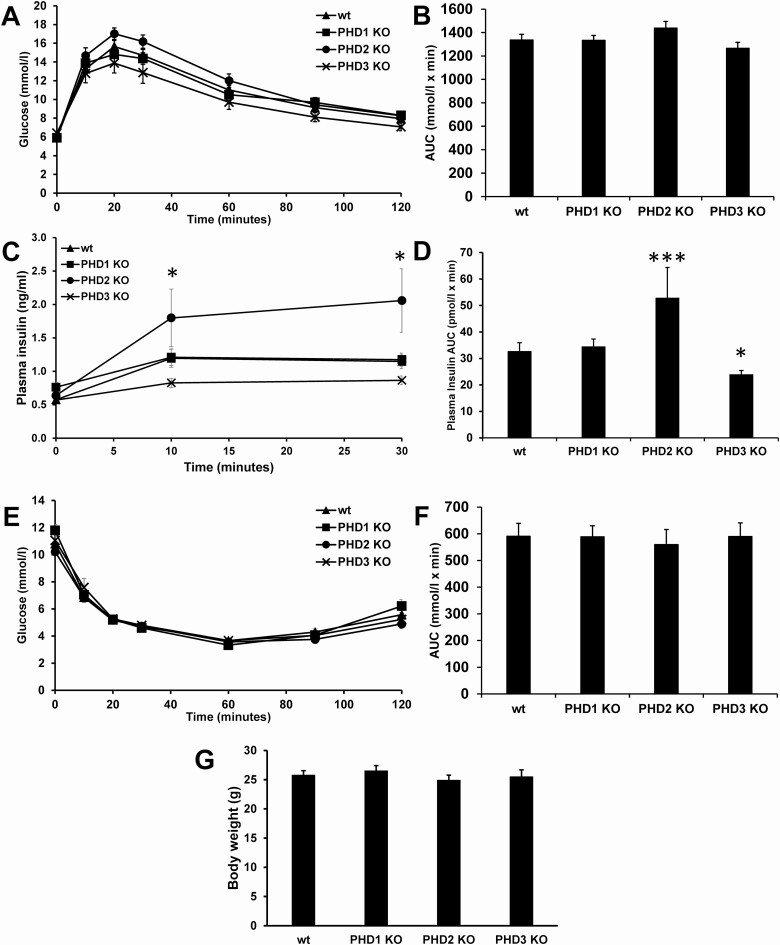
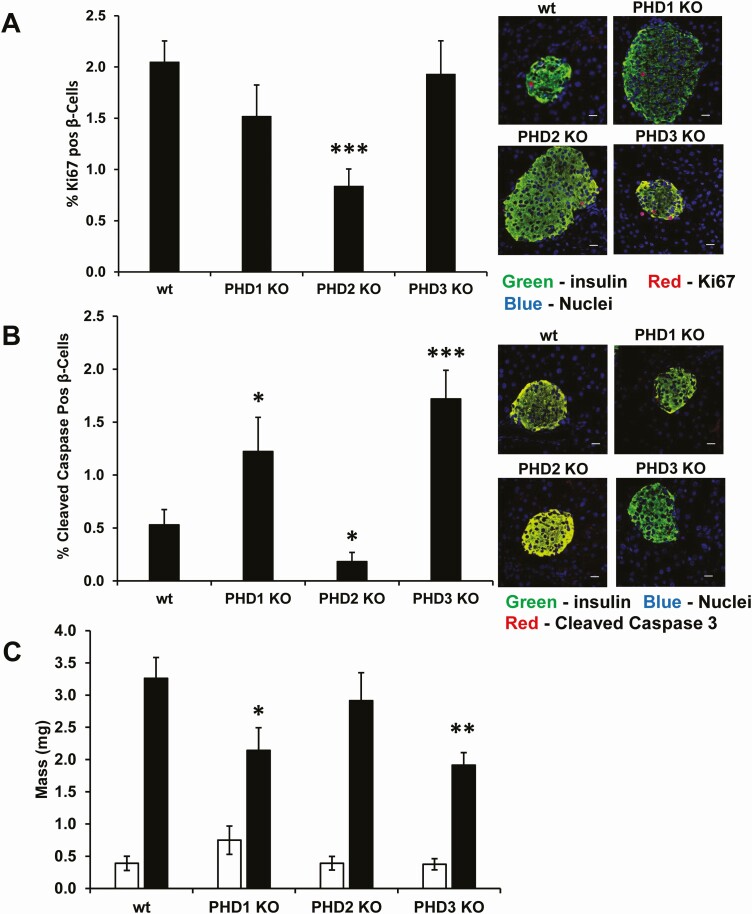
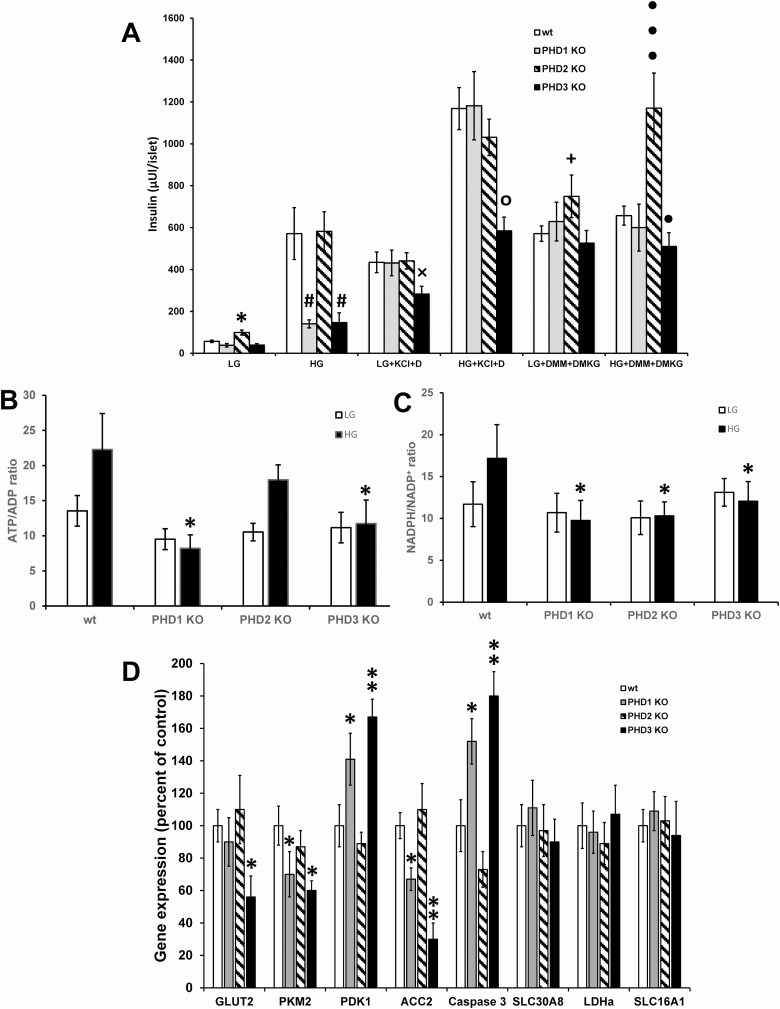
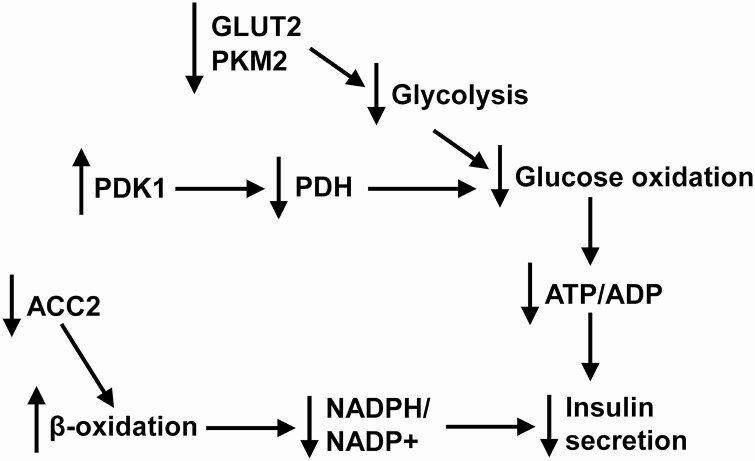
Pancreatic β-cells can secrete insulin via 2 pathways characterized as KATP channel -dependent and -independent. The KATP channel-independent pathway is characterized by a rise in several potential metabolic signaling molecules, including the NADPH/NADP+ ratio and α-ketoglutarate (αKG). Prolyl hydroxylases (PHDs), which belong to the αKG-dependent dioxygenase superfamily, are known to regulate the stability of hypoxia-inducible factor α. In the current study, we assess the role of PHDs in vivo using the pharmacological inhibitor dimethyloxalylglycine (DMOG) and generated β-cell-specific knockout (KO) mice for all 3 isoforms of PHD (β-PHD1 KO, β-PHD2 KO, and β-PHD3 KO mice). DMOG inhibited in vivo insulin secretion in response to glucose challenge and inhibited the first phase of insulin secretion but enhanced the second phase of insulin secretion in isolated islets. None of the β-PHD KO mice showed any significant in vivo defects associated with glucose tolerance and insulin resistance except for β-PHD2 KO mice which had significantly increased plasma insulin during a glucose challenge. Islets from both β-PHD1 KO and β-PHD3 KO had elevated β-cell apoptosis and reduced β-cell mass. Isolated islets from β-PHD1 KO and β-PHD3 KO had impaired glucose-stimulated insulin secretion and glucose-stimulated increases in the ATP/ADP and NADPH/NADP+ ratio. All 3 PHD isoforms are expressed in β-cells, with PHD3 showing the most distinct expression pattern. The lack of each PHD protein did not significantly impair in vivo glucose homeostasis. However, β-PHD1 KO and β-PHD3 KO mice had defective β-cell mass and islet insulin secretion, suggesting that these mice may be predisposed to developing diabetes.
Keywords: ARNT/HIF1β; HIF1α; PHD; cell metabolism; hypoxia; insulin release; insulin secretion; islet; metabolism; pancreatic β-cell; prolyl hydroxylases.
© The Author(s) 2021. Published by Oxford University Press on behalf of the Endocrine Society.
Figures
Similar articles
-
Deletion of ARNT/HIF1β in pancreatic beta cells does not impair glucose homeostasis in mice, but is associated with defective glucose sensing ex vivo.Diabetologia. 2015 Dec;58(12):2832-42. doi: 10.1007/s00125-015-3768-4. Epub 2015 Sep 26. Diabetologia. 2015. PMID: 26409461 Free PMC article.
-
Role of prolyl hydroxylase domain proteins in the regulation of insulin secretion.Physiol Rep. 2016 Mar;4(5):e12722. doi: 10.14814/phy2.12722. Physiol Rep. 2016. PMID: 26997627 Free PMC article.
-
The Loss of ARNT/HIF1β in Male Pancreatic β-Cells Is Protective Against High-Fat Diet-Induced Diabetes.Endocrinology. 2019 Dec 1;160(12):2825-2836. doi: 10.1210/en.2018-00936. Endocrinology. 2019. PMID: 31580427 Free PMC article.
-
The role of α-ketoglutarate and the hypoxia sensing pathway in the regulation of pancreatic β-cell function.Islets. 2020 Sep 2;12(5):108-119. doi: 10.1080/19382014.2020.1802183. Epub 2020 Sep 2. Islets. 2020. PMID: 32876527 Free PMC article. Review.
-
HIF-prolyl hydroxylases and cardiovascular diseases.Toxicol Mech Methods. 2012 Jun;22(5):347-58. doi: 10.3109/15376516.2012.673088. Toxicol Mech Methods. 2012. PMID: 22424133 Review.
Cited by
-
[Latest Findings on the Role of α-Ketoglutarate in Metabolic Syndrome].Sichuan Da Xue Xue Bao Yi Xue Ban. 2024 May 20;55(3):783-792. doi: 10.12182/20240560302. Sichuan Da Xue Xue Bao Yi Xue Ban. 2024. PMID: 38948289 Free PMC article. Review. Chinese.
-
PHD1-3 oxygen sensors in vivo-lessons learned from gene deletions.Pflugers Arch. 2024 Sep;476(9):1307-1337. doi: 10.1007/s00424-024-02944-x. Epub 2024 Mar 21. Pflugers Arch. 2024. PMID: 38509356 Free PMC article. Review.
-
Roles of β-Cell Hypoxia in the Progression of Type 2 Diabetes.Int J Mol Sci. 2024 Apr 10;25(8):4186. doi: 10.3390/ijms25084186. Int J Mol Sci. 2024. PMID: 38673770 Free PMC article. Review.
References
-
- Muoio DM, Newgard CB. Mechanisms of disease: molecular and metabolic mechanisms of insulin resistance and beta-cell failure in type 2 diabetes. Nat Rev Mol Cell Biol. 2008;9(3):193-205. - PubMed
-
- Prentki M, Matschinsky FM. Ca2+, cAMP, and phospholipid-derived messengers in coupling mechanisms of insulin secretion. Physiol Rev. 1987;67(4):1185-1248. - PubMed
-
- Ashcroft FM, Rorsman P. Electrophysiology of the pancreatic beta-cell. Prog Biophys Mol Biol. 1989;54(2):87-143. - PubMed
-
- Newgard CB, Matchinsky FM. Substrate control of insulin release. In: Maurice Goodman H, Jefferson LS, Cherrington AD, eds. Handbook of Physiology Section 7: The Endocrine System Volume II: The Endocrine Pancreas and Regulation of Metabolism. Oxford University Press; 2001:125-151.
-
- Newgard CB, McGarry JD. Metabolic coupling factors in pancreatic beta-cell signal transduction. Annu Rev Biochem. 1995;64:689-719. - PubMed
Publication types
MeSH terms
Substances
Grants and funding
LinkOut - more resources
Full Text Sources
Medical
Molecular Biology Databases
Research Materials
