. 2021 Oct 11:12:721722.
doi: 10.3389/fimmu.2021.721722. eCollection 2021.

Non-Stimulatory pMHC Enhance CD8 T Cell Effector Functions by Recruiting Coreceptor-Bound Lck

Affiliations

Non-Stimulatory pMHC Enhance CD8 T Cell Effector Functions by Recruiting Coreceptor-Bound Lck

Xiang Zhao et al. Front Immunol. .

Abstract

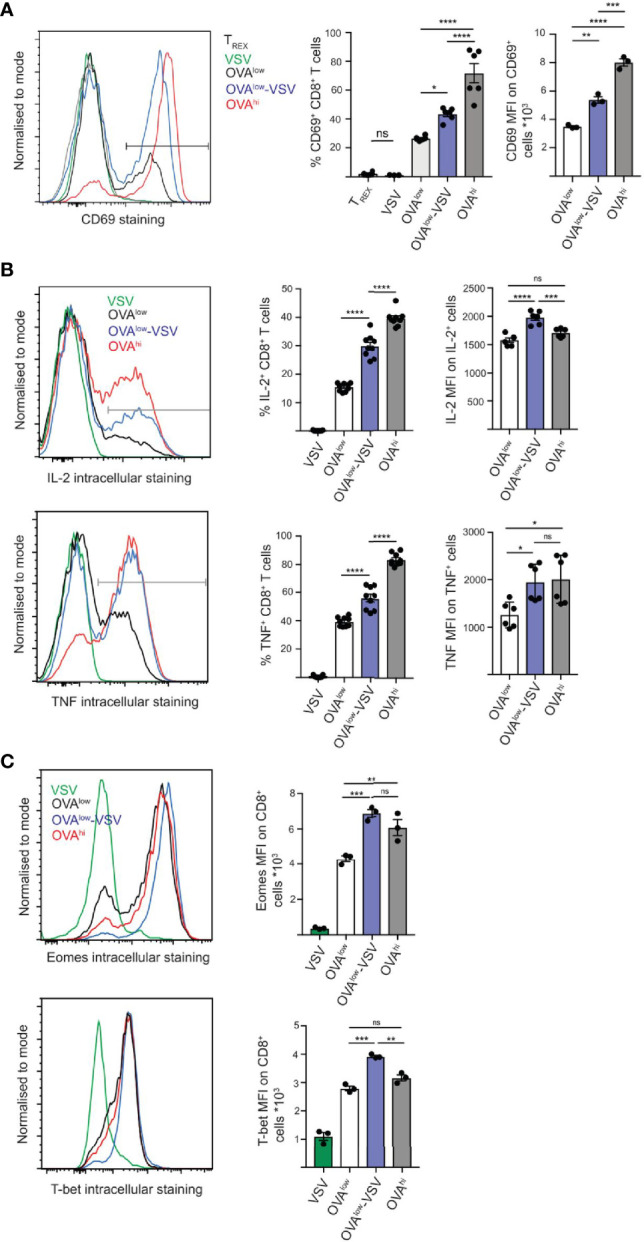
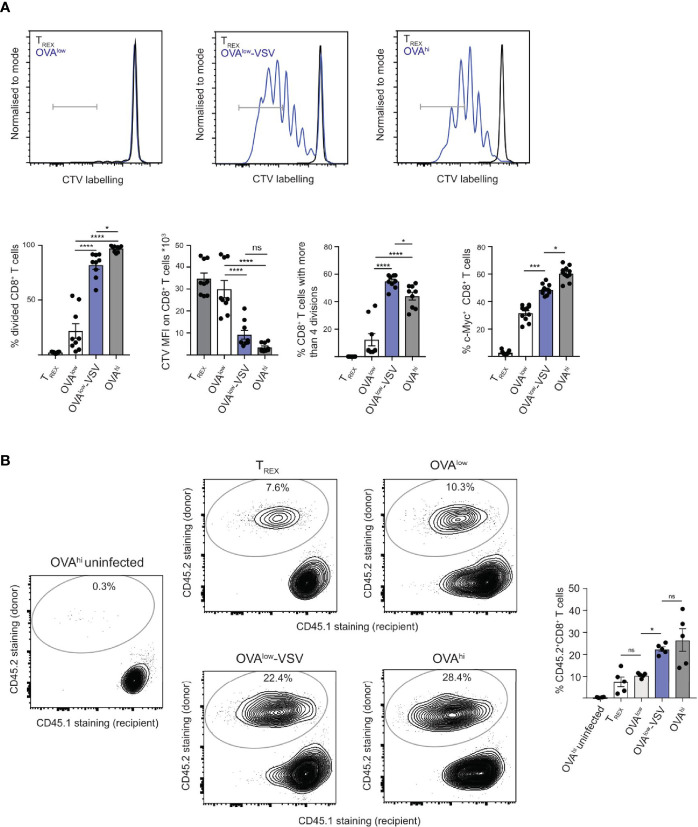
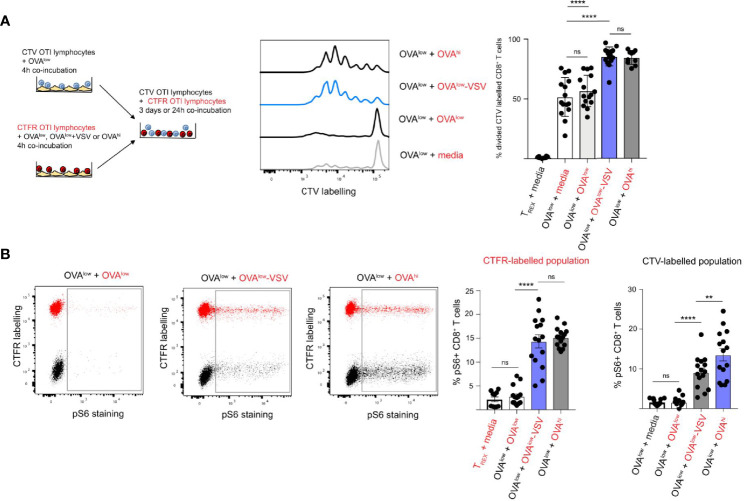
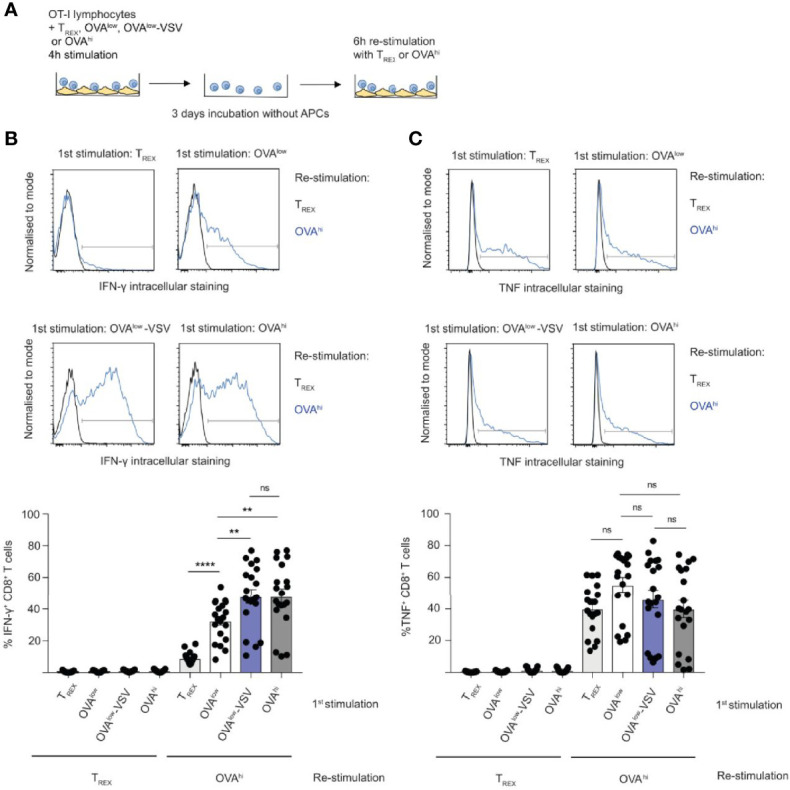
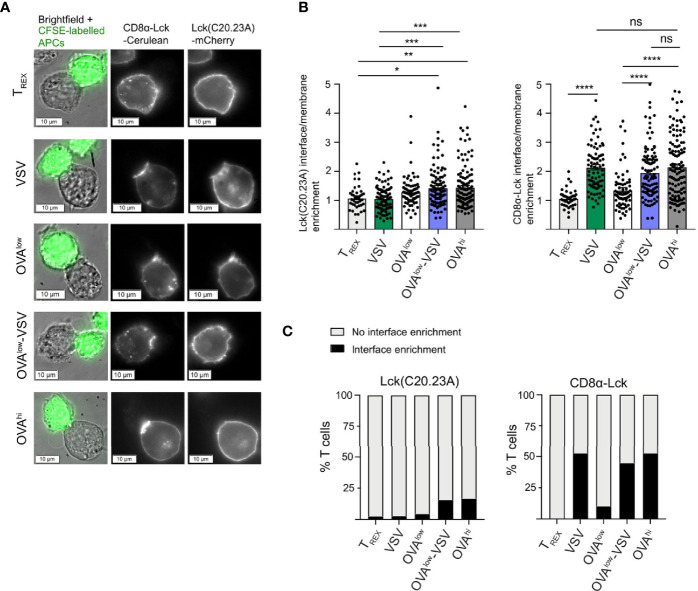
Under physiological conditions, CD8+ T cells need to recognize low numbers of antigenic pMHC class I complexes in the presence of a surplus of non-stimulatory, self pMHC class I on the surface of the APC. Non-stimulatory pMHC have been shown to enhance CD8+ T cell responses to low amounts of antigenic pMHC, in a phenomenon called co-agonism, but the physiological significance and molecular mechanism of this phenomenon are still poorly understood. Our data show that co-agonist pMHC class I complexes recruit CD8-bound Lck to the immune synapse to modulate CD8+ T cell signaling pathways, resulting in enhanced CD8+ T cell effector functions and proliferation, both in vitro and in vivo. Moreover, co-agonism can boost T cell proliferation through an extrinsic mechanism, with co-agonism primed CD8+ T cells enhancing Akt pathway activation and proliferation in neighboring CD8+ T cells primed with low amounts of antigen.

Keywords: AKT pathway; Lck; T cell effector functions; T cell receptor; T cell signaling; co-agonism; non-stimulatory peptide MHC.


Conflict of interest statement

The authors declare that the research was conducted in the absence of any commercial or financial relationships that could be construed as a potential conflict of interest.

Figures

Figure 1
Figure 1
Co-agonism enhances CD8+ T cell activation and transcription factor expression. Ex vivo OT-I lymphocytes were stimulated with the indicated CHO APCs for 3h (A), 5h (B) or 24h (C), followed by surface staining to detect CD69 activation marker (A), or intracellular staining to detect intracellular cytokines (B) or transcription factors (C) on CD8+ T cells. (A) Data from 6 mice from 2 independent experiments (%) or 3 mice from 1 experiment, representative of 2 independent experiments (MFI). (B) Data from 9 mice from 3 independent experiments (%) or 6 mice from 2 experiments (MFI), representative of 3 independent experiments. (C) Data from 3 mice from 1 experiment, representative of 3 independent experiments. Statistical significance was calculated using one-way ANOVA, with Tukey’s multiple comparisons test. *P < 0.05, **P < 0.01, ***P < 0.001, ****P < 0.0001, ns, P ≥ 0.05.
Figure 2
Figure 2
Co-agonism enhances CD8+ T cell proliferation in vitro and in vivo. (A) Ex vivo OT-I lymphocytes were labelled with CTV and stimulated with the indicated CHO APCs for 4h, followed by transfer of T cells into wells without APCs, and proliferation analysis 3 days post-transfer. For c-Myc expression analysis, unlabeled OT-I cells were stimulated with the CHO APCs for 4h, followed by fixation and staining. Data from 9 mice from 3 independent experiments, with representative flow cytometry flow plots shown. (B) Ex vivo OT-I lymphocytes (CD45.2+) were stimulated with the indicated CHO APCs for 4h, followed by adoptive transfer into CD45.1+ recipients. One day post-transfer, the recipient mice were infected with 104 cfu LM-OVA, and the expansion of the donor-derived CD45.2+ CD8+ T cells was analyzed 4 days post-infection. Flow cytometry plots show CD45.1 and CD45.2 staining on the CD8+ T cell population, representative of 2 independent experiments. Data from 1 experiment with 5 recipient mice, representative of 2 independent experiments. Statistical significance was calculated using one-way ANOVA, with Tukey’s multiple comparisons test. *P < 0.05, ***P < 0.001, ****P < 0.0001, ns, P ≥ 0.05.
Figure 3
Figure 3
Co-agonism enhances CD8+ T cell quorum responses. (A) CTV or CTFR labelled OT-I lymphocytes were separately stimulated with the indicated CHO APCs for 4h, followed by co-culture of the differentially labelled population for 3 days in the absence of APCs. The representative flow cytometry plots show proliferative dye dilution in CTV-labelled CD8+ T cells primed with OVAlow APCs co-cultured with CTFR-labelled OT-I cells primed with the indicated CHO APCs (indicated in red). Data from 15 mice from 3 independent experiments. (B) CTV or CTFR labelled OT-I lymphocytes were separately stimulated with the indicated CHO APCs for 4h, followed by co-culture of the differentially labelled population for 20h in the absence of APCs. S6 phosphorylation on CD8+ T cells was assessed using intracellular staining. The representative flow cytometry plots show pS6 in co-cultured CTFR-labelled (CTFR+ population, indicated in red) and CTV-labelled (CTFR population, indicated in black) CD8+ T cells primed with the indicated APCs. The graphs show % of pS6+ CD8+ T cells from CTFR and CTV-labelled population, with the priming conditions for CTFR-labelled population indicated in red, and the priming conditions for CTV-labelled population in black. Data from 15 mice from 3 independent experiments. Statistical significance was calculated using one-way ANOVA, with Tukey’s multiple comparisons test. **P < 0.01, ****P < 0.0001, ns, P ≥ 0.05.
Figure 4
Figure 4
Co-agonism enhances CD8+ T cell effector differentiation. (A) Ex vivo OT-I lymphocytes were stimulated with the indicated CHO APCs for 4h, cultured for 3 days without APCs, followed by 6h re-stimulation with TREX or OVAhi APCs. IFN-γ (B) and TNF (C) production by CD8+ T cells was quantified using intracellular staining. Data from 19 mice from 4 independent experiments, representative flow cytometry plots are shown. Statistical significance was calculated using one-way ANOVA, with Tukey’s multiple comparisons test. **P < 0.01, ****P < 0.0001, ns, P ≥ 0.05.
Figure 5
Figure 5
Co-agonism enhances ERK phosphorylation and NFAT nuclear translocation. Ex vivo OT-I lymphocytes were stimulated with the indicated CHO APCs for 3h (A) or 6h (B), followed by fixation and intracellular staining to detect pERK (A) or NFAT (B), and analysis using flow cytometry (A) or imaging flow cytometry (B). (A) Data from 10 mice from 3 independent experiments (%) or 4 mice from 1 experiment, representative of 3 experiments (MFI). (B) Imaging flow cytometry images showing representative CD8+ T cells with cytoplasmic and nuclear NFAT. Data from 12 mice. Statistical significance was calculated using one-way ANOVA, with Tukey’s multiple comparisons test. *P < 0.05, **P < 0.01, ***P < 0.001, ****P < 0.0001, ns, P ≥ 0.05.
Figure 6
Figure 6
Non-stimulatory pMHC-I recruit CD8-bound Lck to the T cell: APC interface even in absence of antigenic pMHC-I. Endogenous Lck–/– OT-I hybridomas co-expressing Lck(C20.23A)-mCherry (free Lck) and CD8α-Lck-Cerulean (bound Lck) were co-cultured with the CFSE-labelled CHO APCs labelled for 30 min, followed by fixation and fluorescence microscopy analysis. (A) Representative images of T cell: CHO APC conjugates. (B) Recruitment of Lck(C20.23A)-mCherry (left) and CD8α-Lck-Cerulean (right) to the T cell: APC interface. The interface recruitment was calculated as (mean pixel intensity at the interface – background)/(mean pixel intensity at membrane outside the interface – background). (C) Percentage of T cells with interface enrichment of free (left) and bound (right) Lck. The interface Lck enrichment was defined by the interface enrichment values of 2 and above. Data from 3 independent experiments, with 41 conjugates for TREX, 79 conjugates for VSV, 69 conjugates for OVAlow, 103 conjugates for OVAlow+VSV and 120 conjugates for OVAhi. Statistical significance was calculated using one-way ANOVA, with Tukey’s multiple comparisons test. *P < 0.05, **P < 0.01, ***P < 0.001, ****P < 0.0001, ns, P ≥ 0.05.

Similar articles

References

    1. Klein L, Kyewski B, Allen PM, Hogquist KA. Positive and Negative Selection of the T Cell Repertoire: What Thymocytes See (and Don't See). Nat Rev Immunol (2014) 14(6):377–91. doi: 10.1038/nri3667 - DOI - PMC - PubMed
    1. Fulton RB, Hamilton SE, Xing Y, Best JA, Goldrath AW, Hogquist KA, et al. . The TCR's Sensitivity to Self Peptide-MHC Dictates the Ability of Naive CD8(+) T Cells to Respond to Foreign Antigens. Nat Immunol (2015) 16(1):107–17. doi: 10.1038/ni.3043 - DOI - PMC - PubMed
    1. Sprent J, Cho JH, Boyman O, Surh CD. T Cell Homeostasis. Immunol Cell Biol (2008) 86(4):312–9. doi: 10.1038/icb.2008.12 - DOI - PubMed
    1. Gascoigne NR. Do T Cells Need Endogenous Peptides for Activation? Nat Rev Immunol (2008) 8(11):895–900. doi: 10.1038/nri2431 - DOI - PubMed
    1. Gascoigne NR, Zal T, Yachi PP, Hoerter JA. Co-Receptors and Recognition of Self at the Immunological Synapse. Curr Top Microbiol Immunol (2010) 340:171–89. doi: 10.1007/978-3-642-03858-7_9 - DOI - PMC - PubMed

Publication types

MeSH terms

Substances