Modelling evolutionary pathways for commensalism and hypervirulence in Neisseria meningitidis
- PMID: 34704920
- PMCID: PMC8627216
- DOI: 10.1099/mgen.0.000662
Modelling evolutionary pathways for commensalism and hypervirulence in Neisseria meningitidis
Abstract
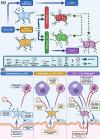
Neisseria meningitidis, the meningococcus, resides exclusively in humans and causes invasive meningococcal disease (IMD). The population of N. meningitidis is structured into stable clonal complexes by limited horizontal recombination in this naturally transformable species. N. meningitidis is an opportunistic pathogen, with some clonal complexes, such as cc53, effectively acting as commensal colonizers, while other genetic lineages, such as cc11, are rarely colonizers but are over-represented in IMD and are termed hypervirulent. This study examined theoretical evolutionary pathways for pathogenic and commensal lineages by examining the prevalence of horizontally acquired genomic islands (GIs) and loss-of-function (LOF) mutations. Using a collection of 4850 genomes from the BIGSdb database, we identified 82 GIs in the pan-genome of 11 lineages (10 hypervirulent and one commensal lineage). A new computational tool, Phaser, was used to identify frameshift mutations, which were examined for statistically significant association with genetic lineage. Phaser identified a total of 144 frameshift loci of which 105 were shown to have a statistically significant non-random distribution in phase status. The 82 GIs, but not the LOF loci, were associated with genetic lineage and invasiveness using the disease carriage ratio metric. These observations have been integrated into a new model that infers the early events of the evolution of the human adapted meningococcus. These pathways are enriched for GIs that are involved in modulating attachment to the host, growth rate, iron uptake and toxin expression which are proposed to increase competition within the meningococcal population for the limited environmental niche of the human nasopharynx. We surmise that competition for the host mucosal surface with the nasopharyngeal microbiome has led to the selection of isolates with traits that enable access to cell types (non-phagocytic and phagocytic) in the submucosal tissues leading to an increased risk for IMD.
Keywords: clonal complexes; commensalism; competition; pathogenicity.
Conflict of interest statement
The authors declare that there are no conflicts of interest.
Figures


Similar articles
-
The Host-Pathogen Interactions and Epicellular Lifestyle of Neisseria meningitidis.Front Cell Infect Microbiol. 2022 Apr 22;12:862935. doi: 10.3389/fcimb.2022.862935. eCollection 2022. Front Cell Infect Microbiol. 2022. PMID: 35531336 Free PMC article. Review.
-
Meningococcal core and accessory phasomes vary by clonal complex.Microb Genom. 2020 May;6(5):e000367. doi: 10.1099/mgen.0.000367. Epub 2020 Apr 29. Microb Genom. 2020. PMID: 32375989 Free PMC article.
-
Comparative genomics of Neisseria meningitidis: core genome, islands of horizontal transfer and pathogen-specific genes.Microbiology (Reading). 2006 Dec;152(Pt 12):3733-3749. doi: 10.1099/mic.0.29261-0. Microbiology (Reading). 2006. PMID: 17159225
-
Genomic surveillance of invasive meningococcal disease in the Czech Republic, 2015-2017.PLoS One. 2019 Jul 11;14(7):e0219477. doi: 10.1371/journal.pone.0219477. eCollection 2019. PLoS One. 2019. PMID: 31295279 Free PMC article.
-
Neisseria meningitidis; clones, carriage, and disease.Clin Microbiol Infect. 2014 May;20(5):391-5. doi: 10.1111/1469-0691.12647. Clin Microbiol Infect. 2014. PMID: 24766477 Review.
Cited by
-
Genetic characterization of Neisseria meningitidis isolates recovered from patients with invasive meningococcal disease in Lithuania.Front Cell Infect Microbiol. 2024 Oct 14;14:1432197. doi: 10.3389/fcimb.2024.1432197. eCollection 2024. Front Cell Infect Microbiol. 2024. PMID: 39469455 Free PMC article.
-
Microevolution and Its Impact on Hypervirulence, Antimicrobial Resistance, and Vaccine Escape in Neisseria meningitidis.Microorganisms. 2023 Dec 18;11(12):3005. doi: 10.3390/microorganisms11123005. Microorganisms. 2023. PMID: 38138149 Free PMC article. Review.
-
The Host-Pathogen Interactions and Epicellular Lifestyle of Neisseria meningitidis.Front Cell Infect Microbiol. 2022 Apr 22;12:862935. doi: 10.3389/fcimb.2022.862935. eCollection 2022. Front Cell Infect Microbiol. 2022. PMID: 35531336 Free PMC article. Review.
-
Classification of Neisseria meningitidis genomes with a bag-of-words approach and machine learning.iScience. 2024 Feb 16;27(3):109257. doi: 10.1016/j.isci.2024.109257. eCollection 2024 Mar 15. iScience. 2024. PMID: 38439962 Free PMC article.
References
Publication types
MeSH terms
Substances
LinkOut - more resources
Full Text Sources
Medical

