. 2021 Dec 1;321(6):L1161-L1182.
doi: 10.1152/ajplung.00159.2021. Epub 2021 Oct 27.

TRPC6, a therapeutic target for pulmonary hypertension

Affiliations

TRPC6, a therapeutic target for pulmonary hypertension

Pritesh P Jain et al. Am J Physiol Lung Cell Mol Physiol. .

Abstract

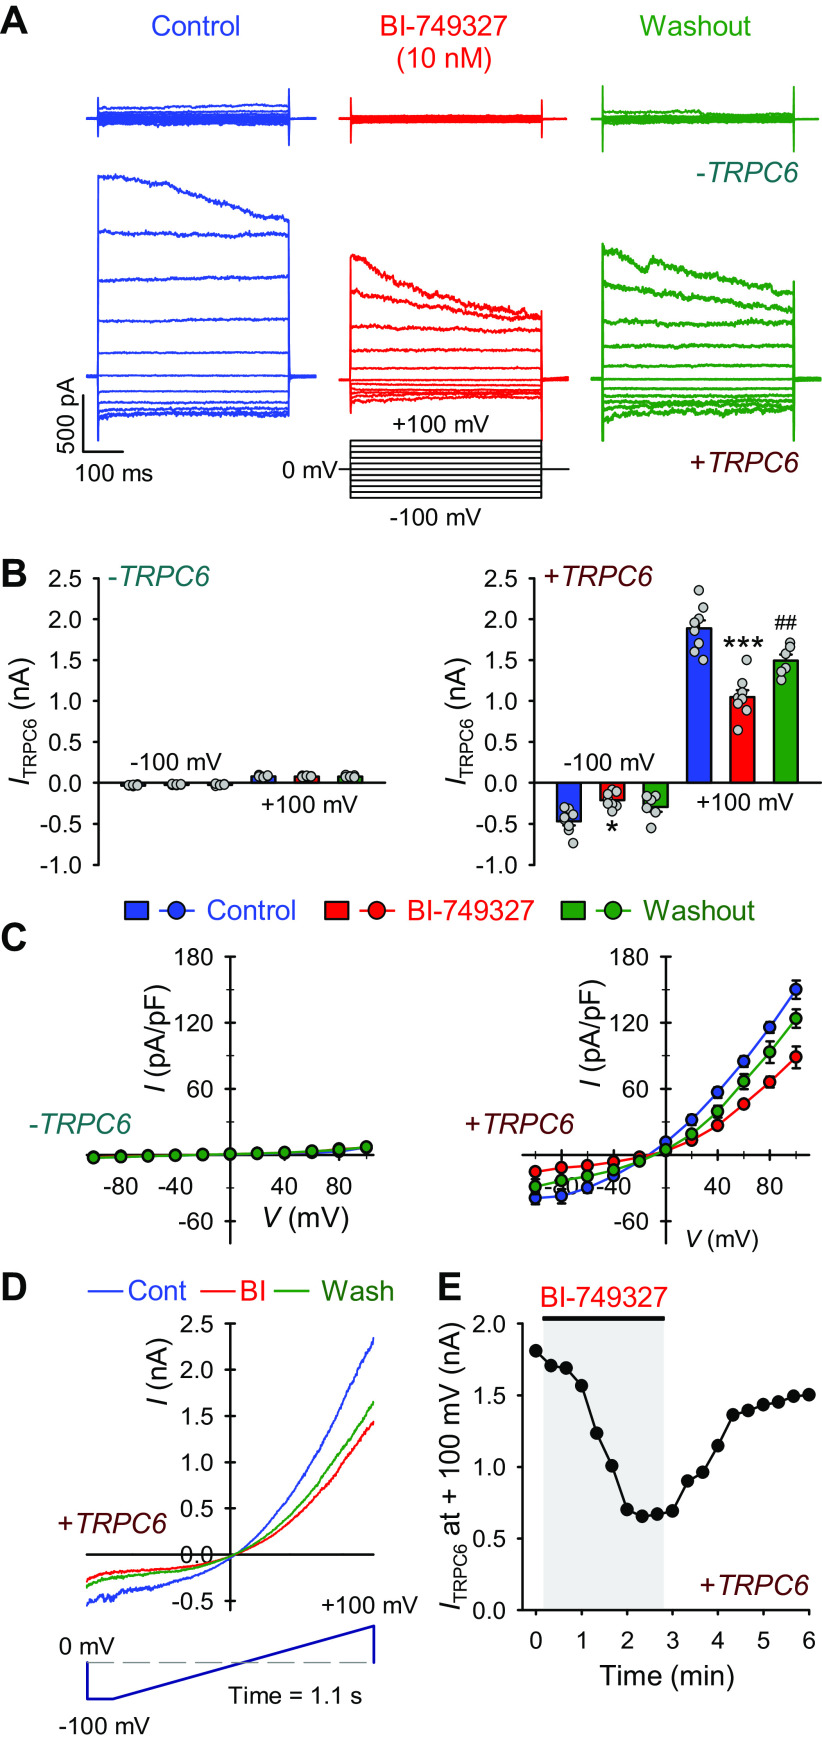
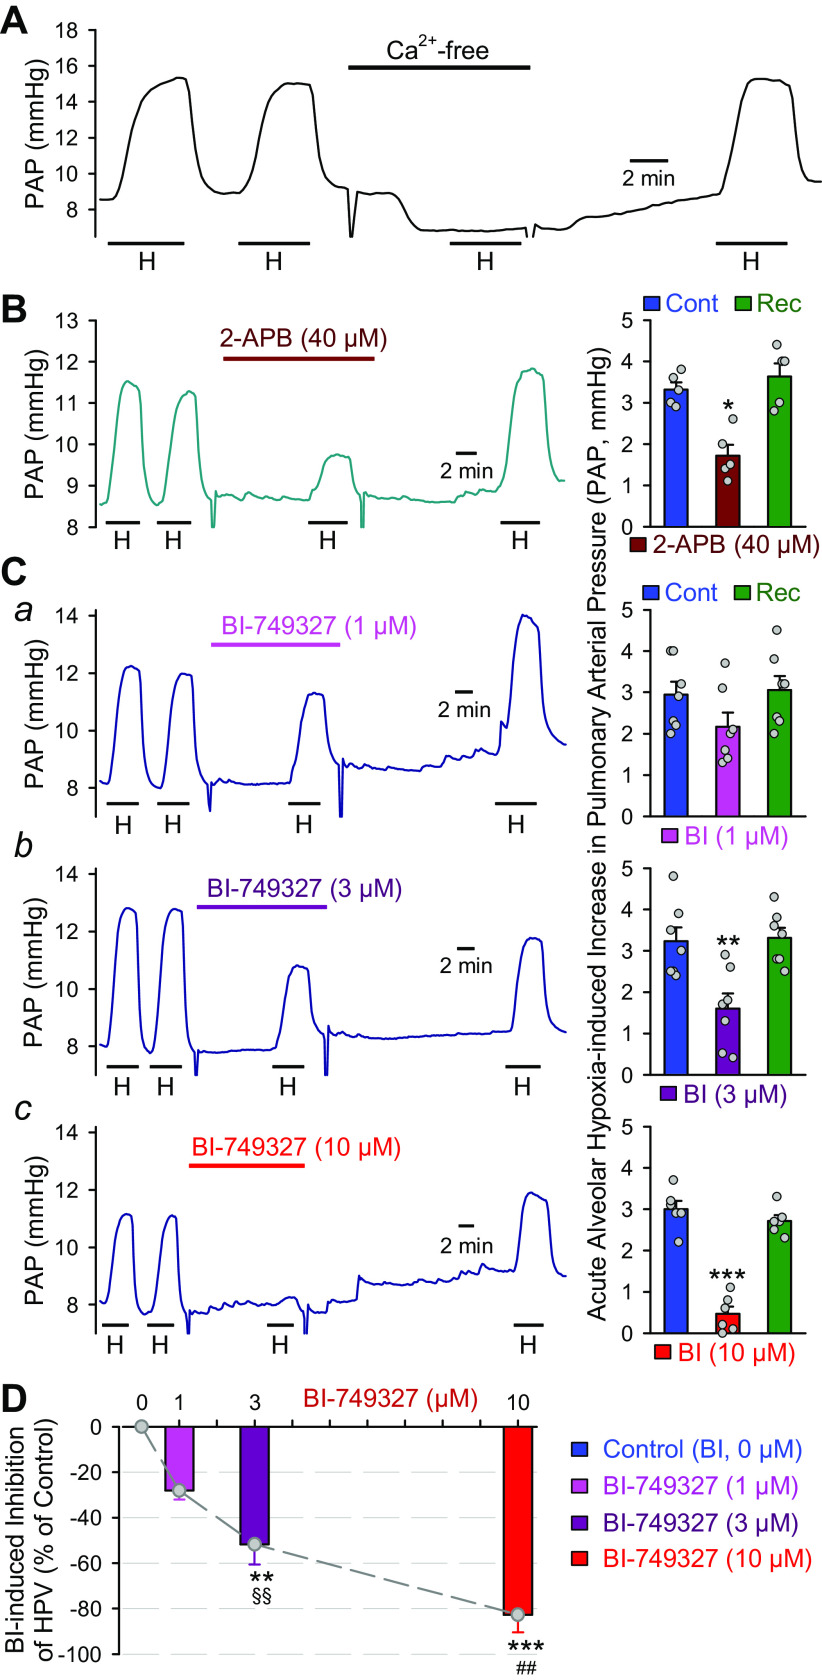
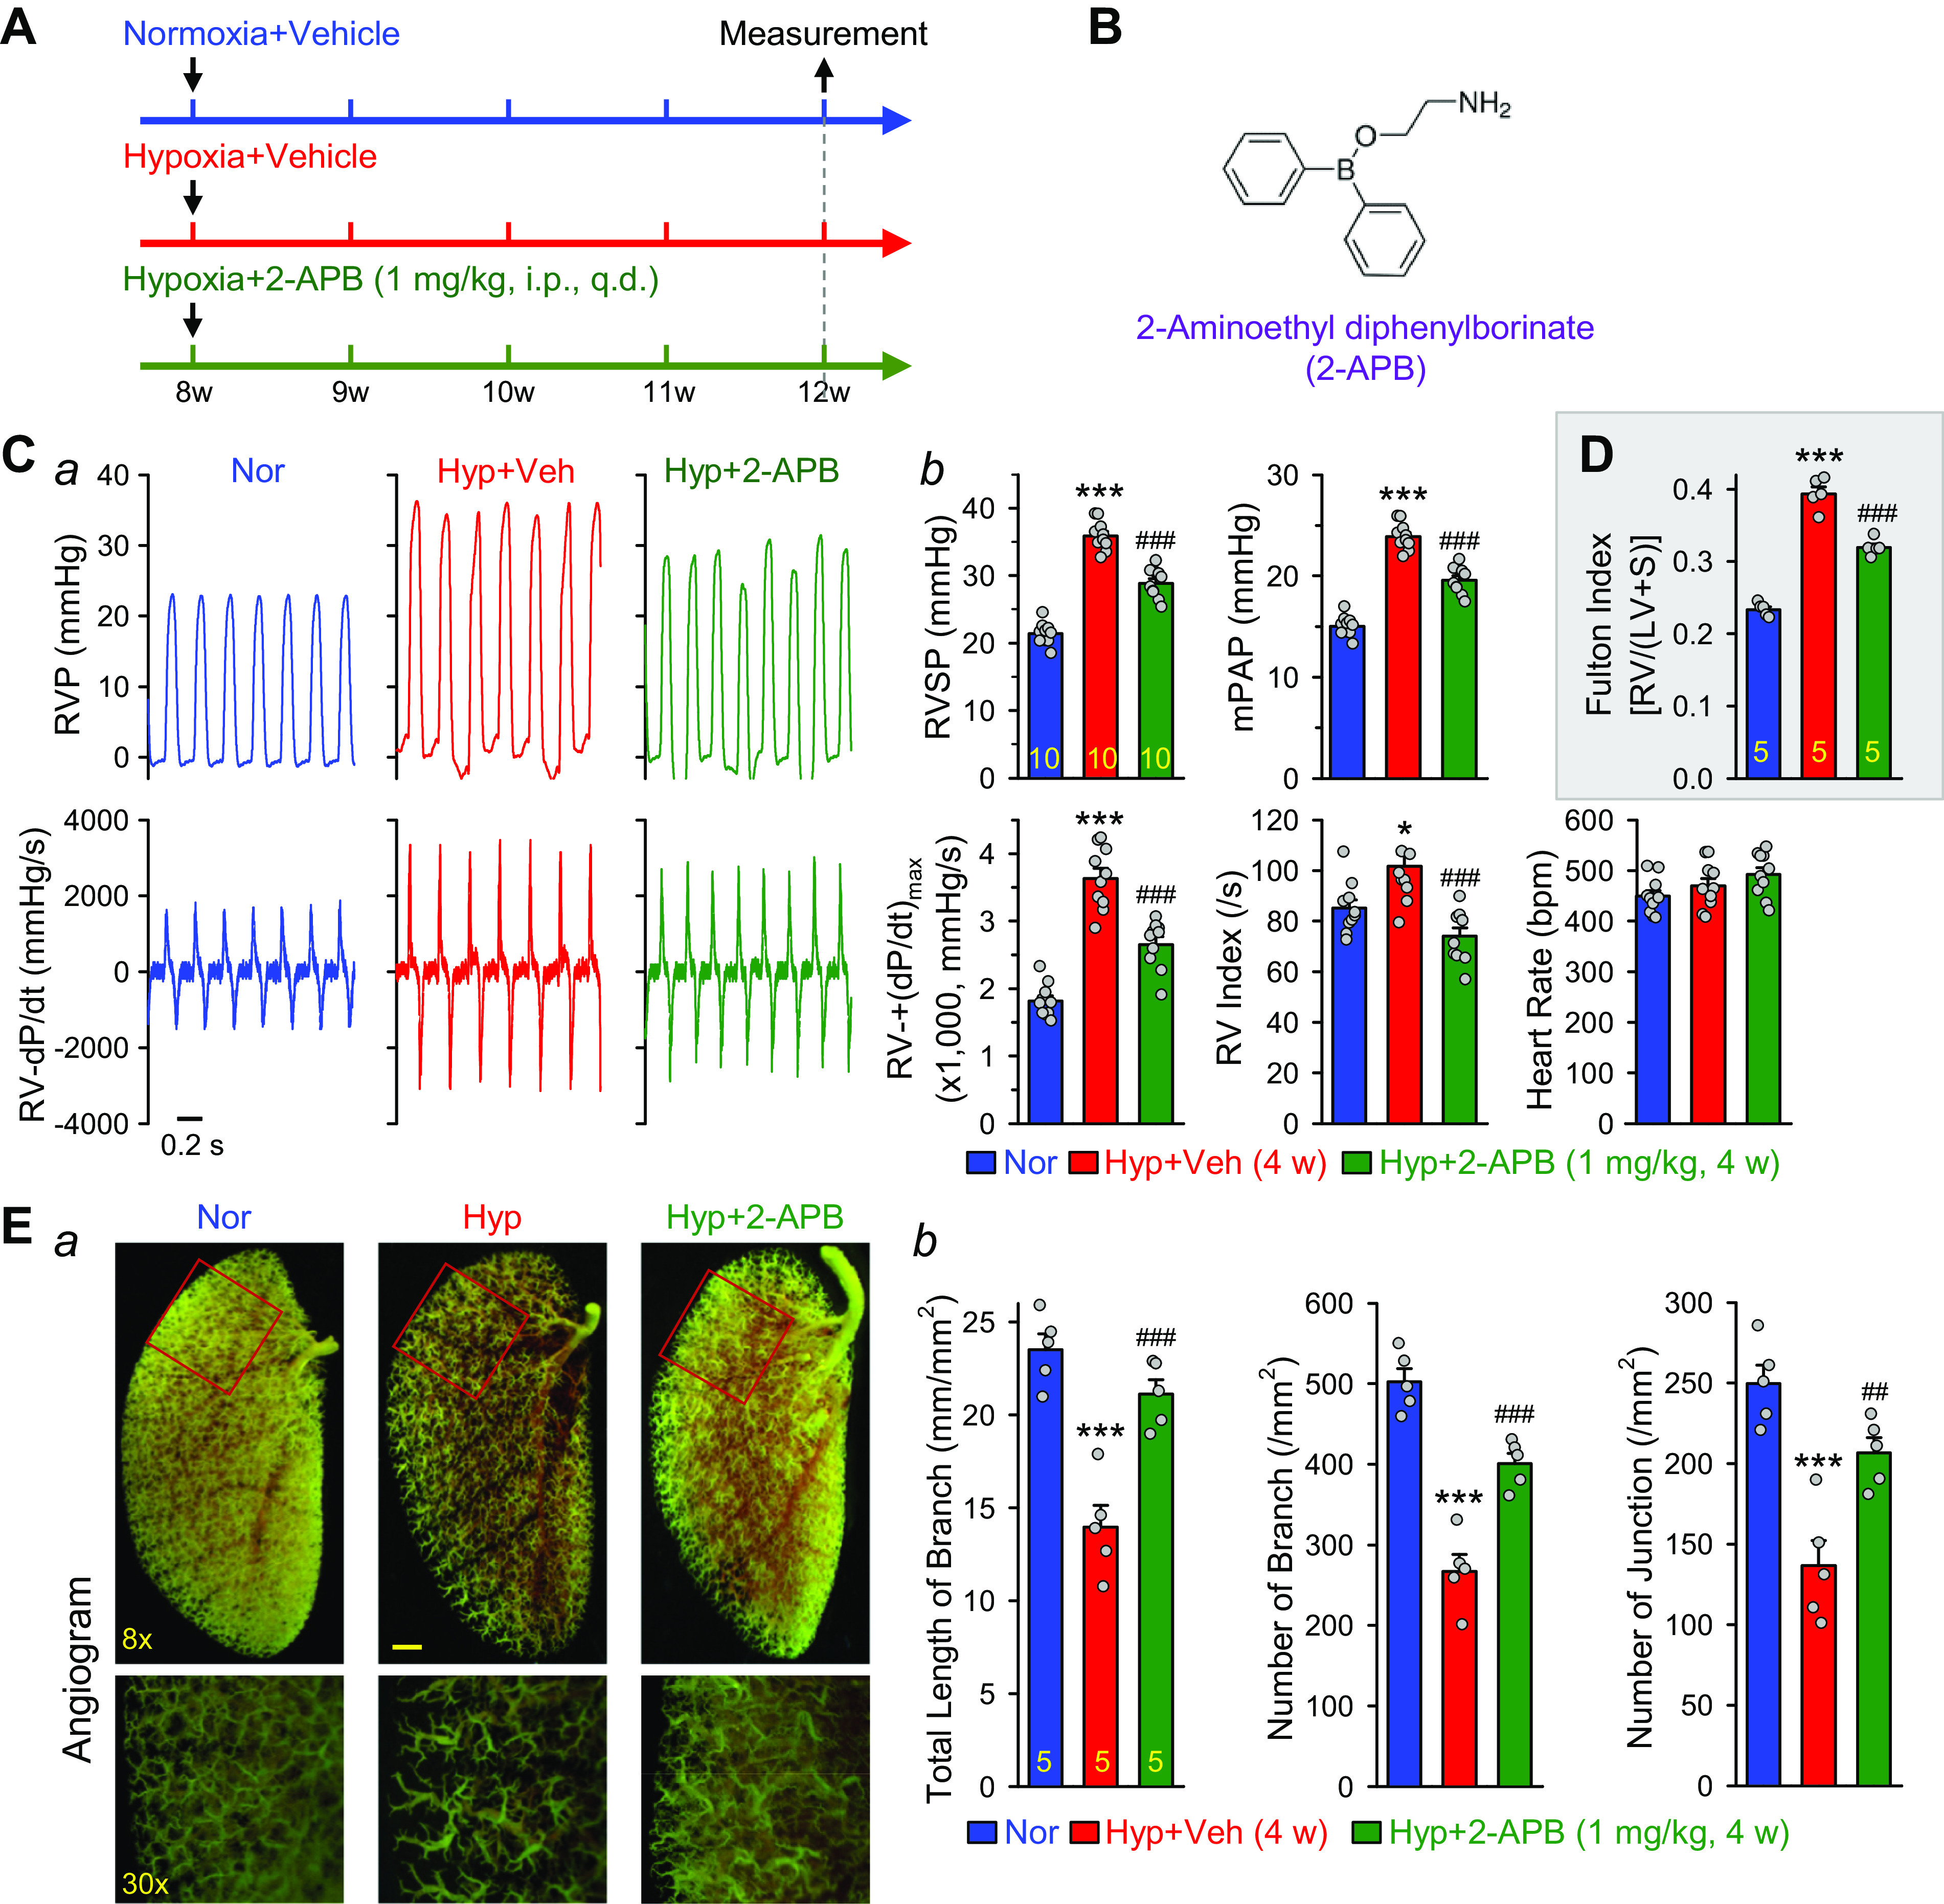
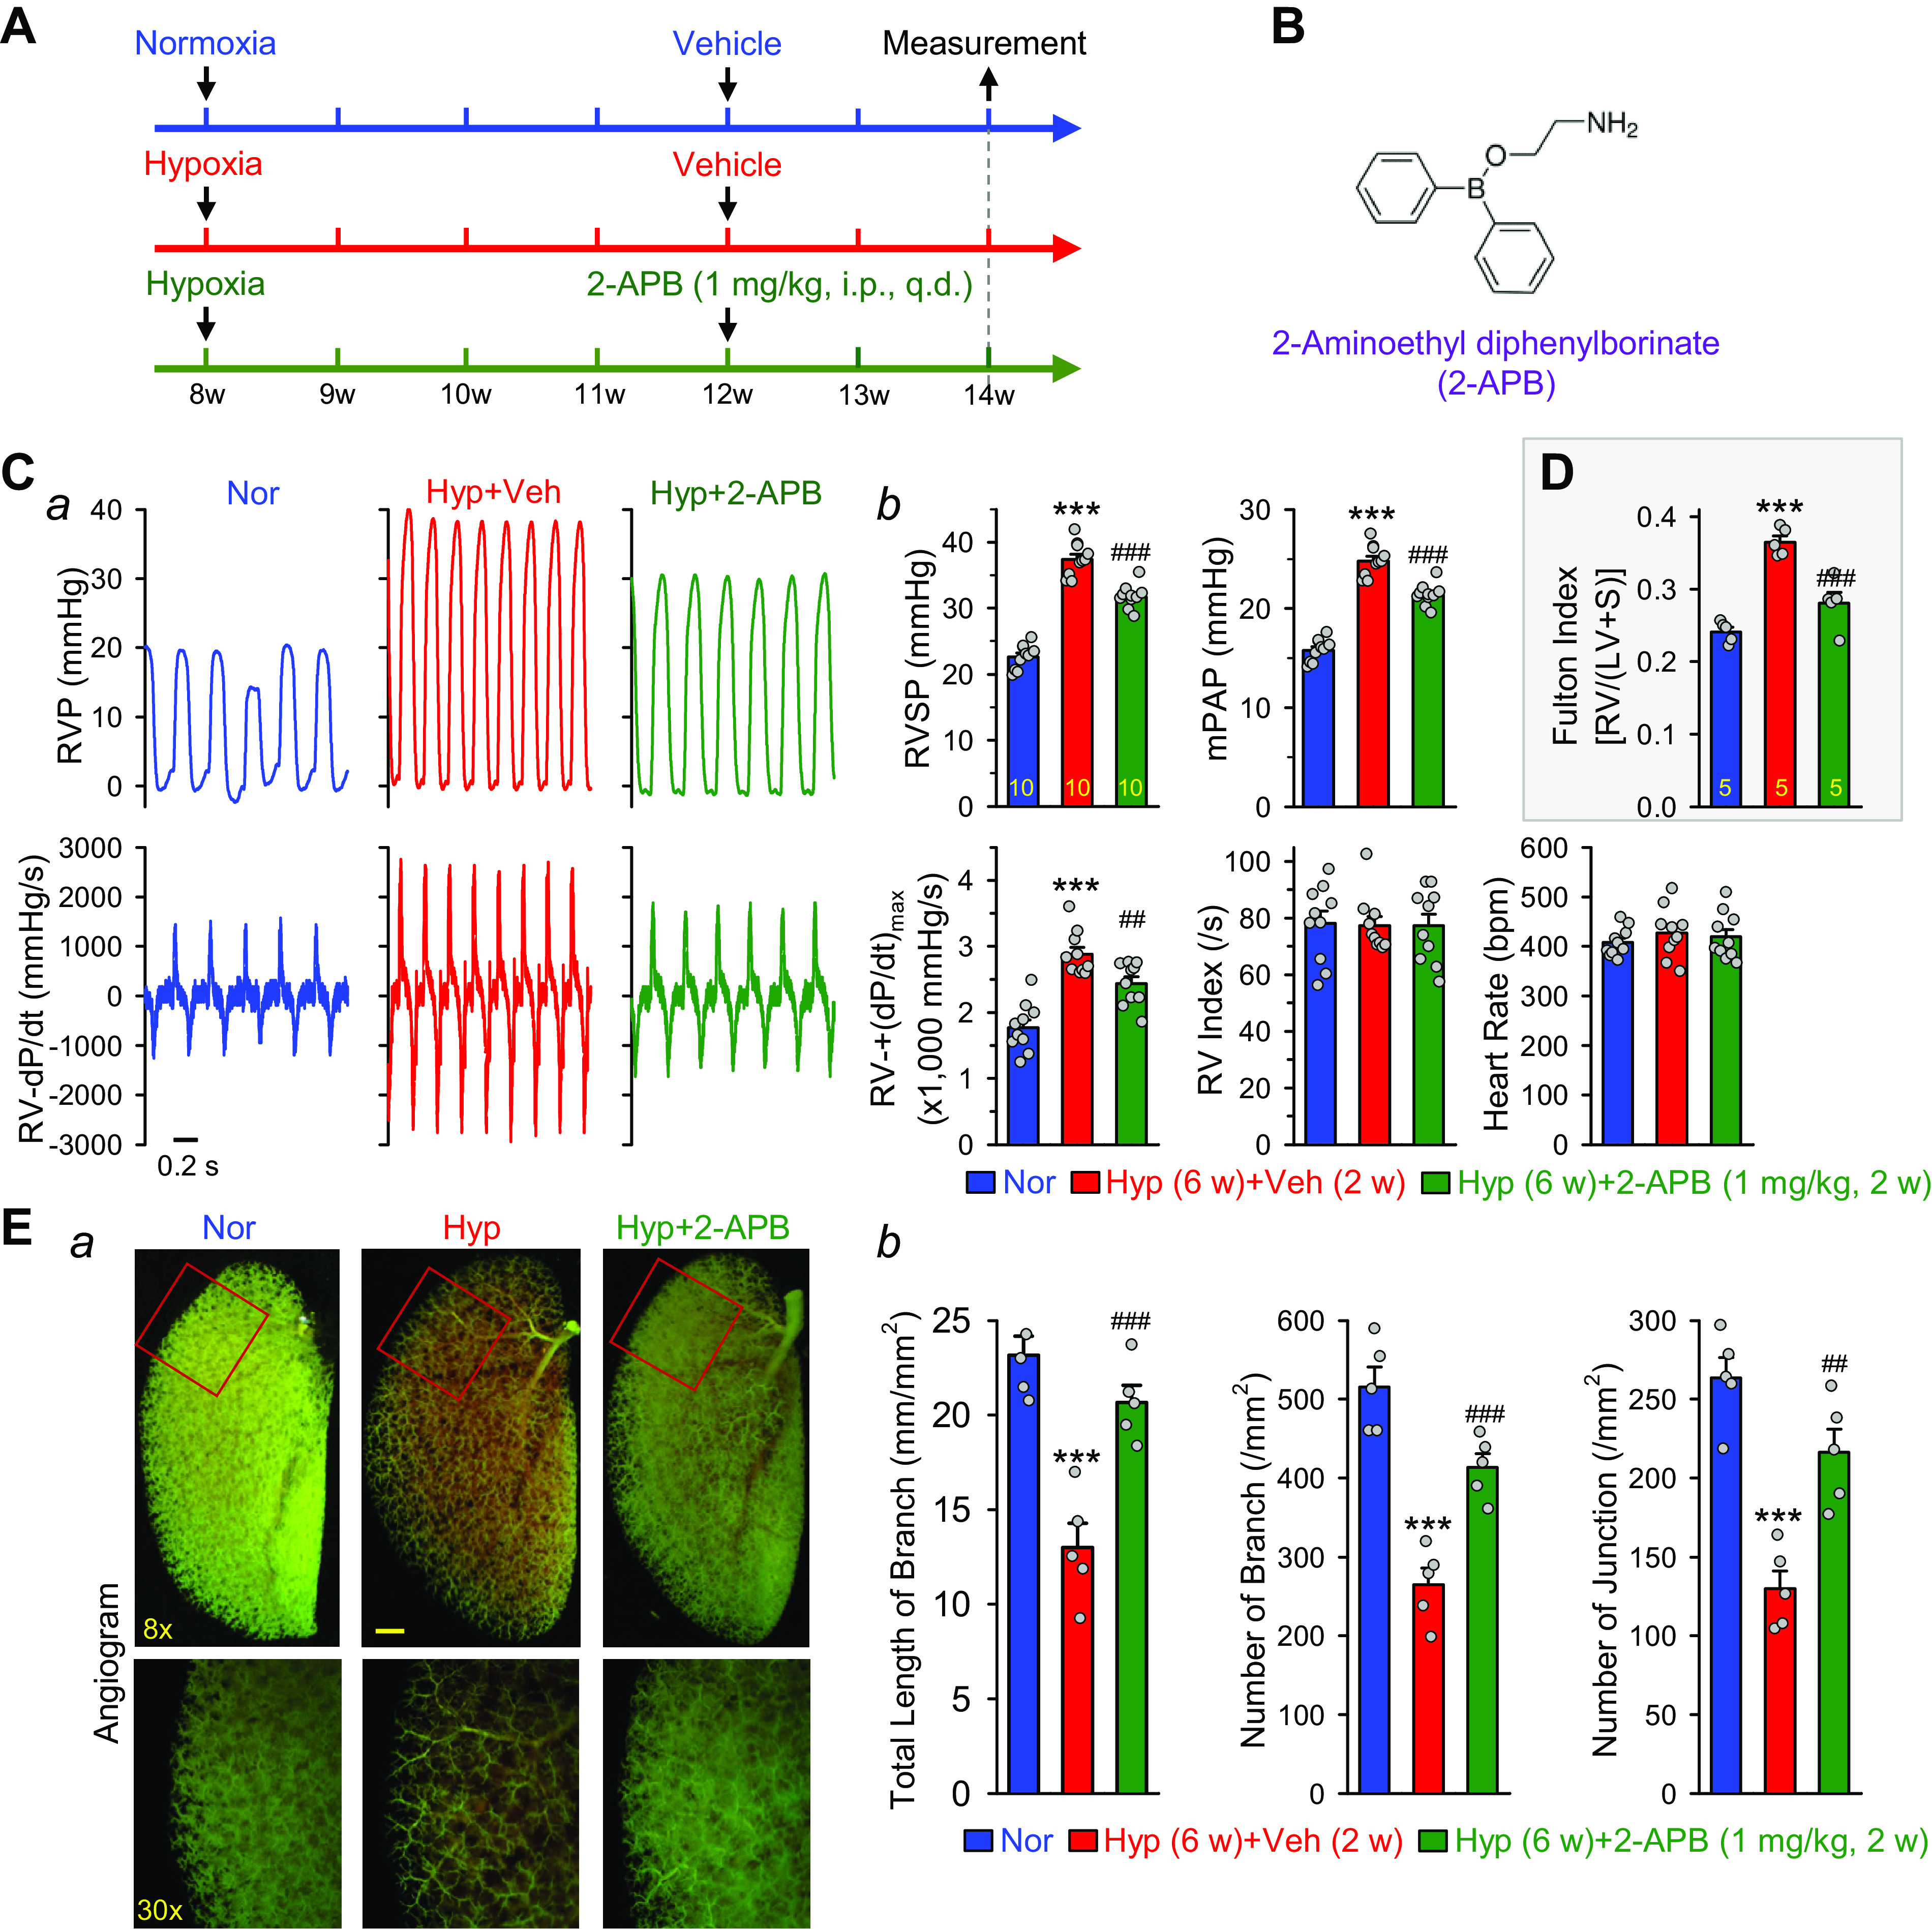
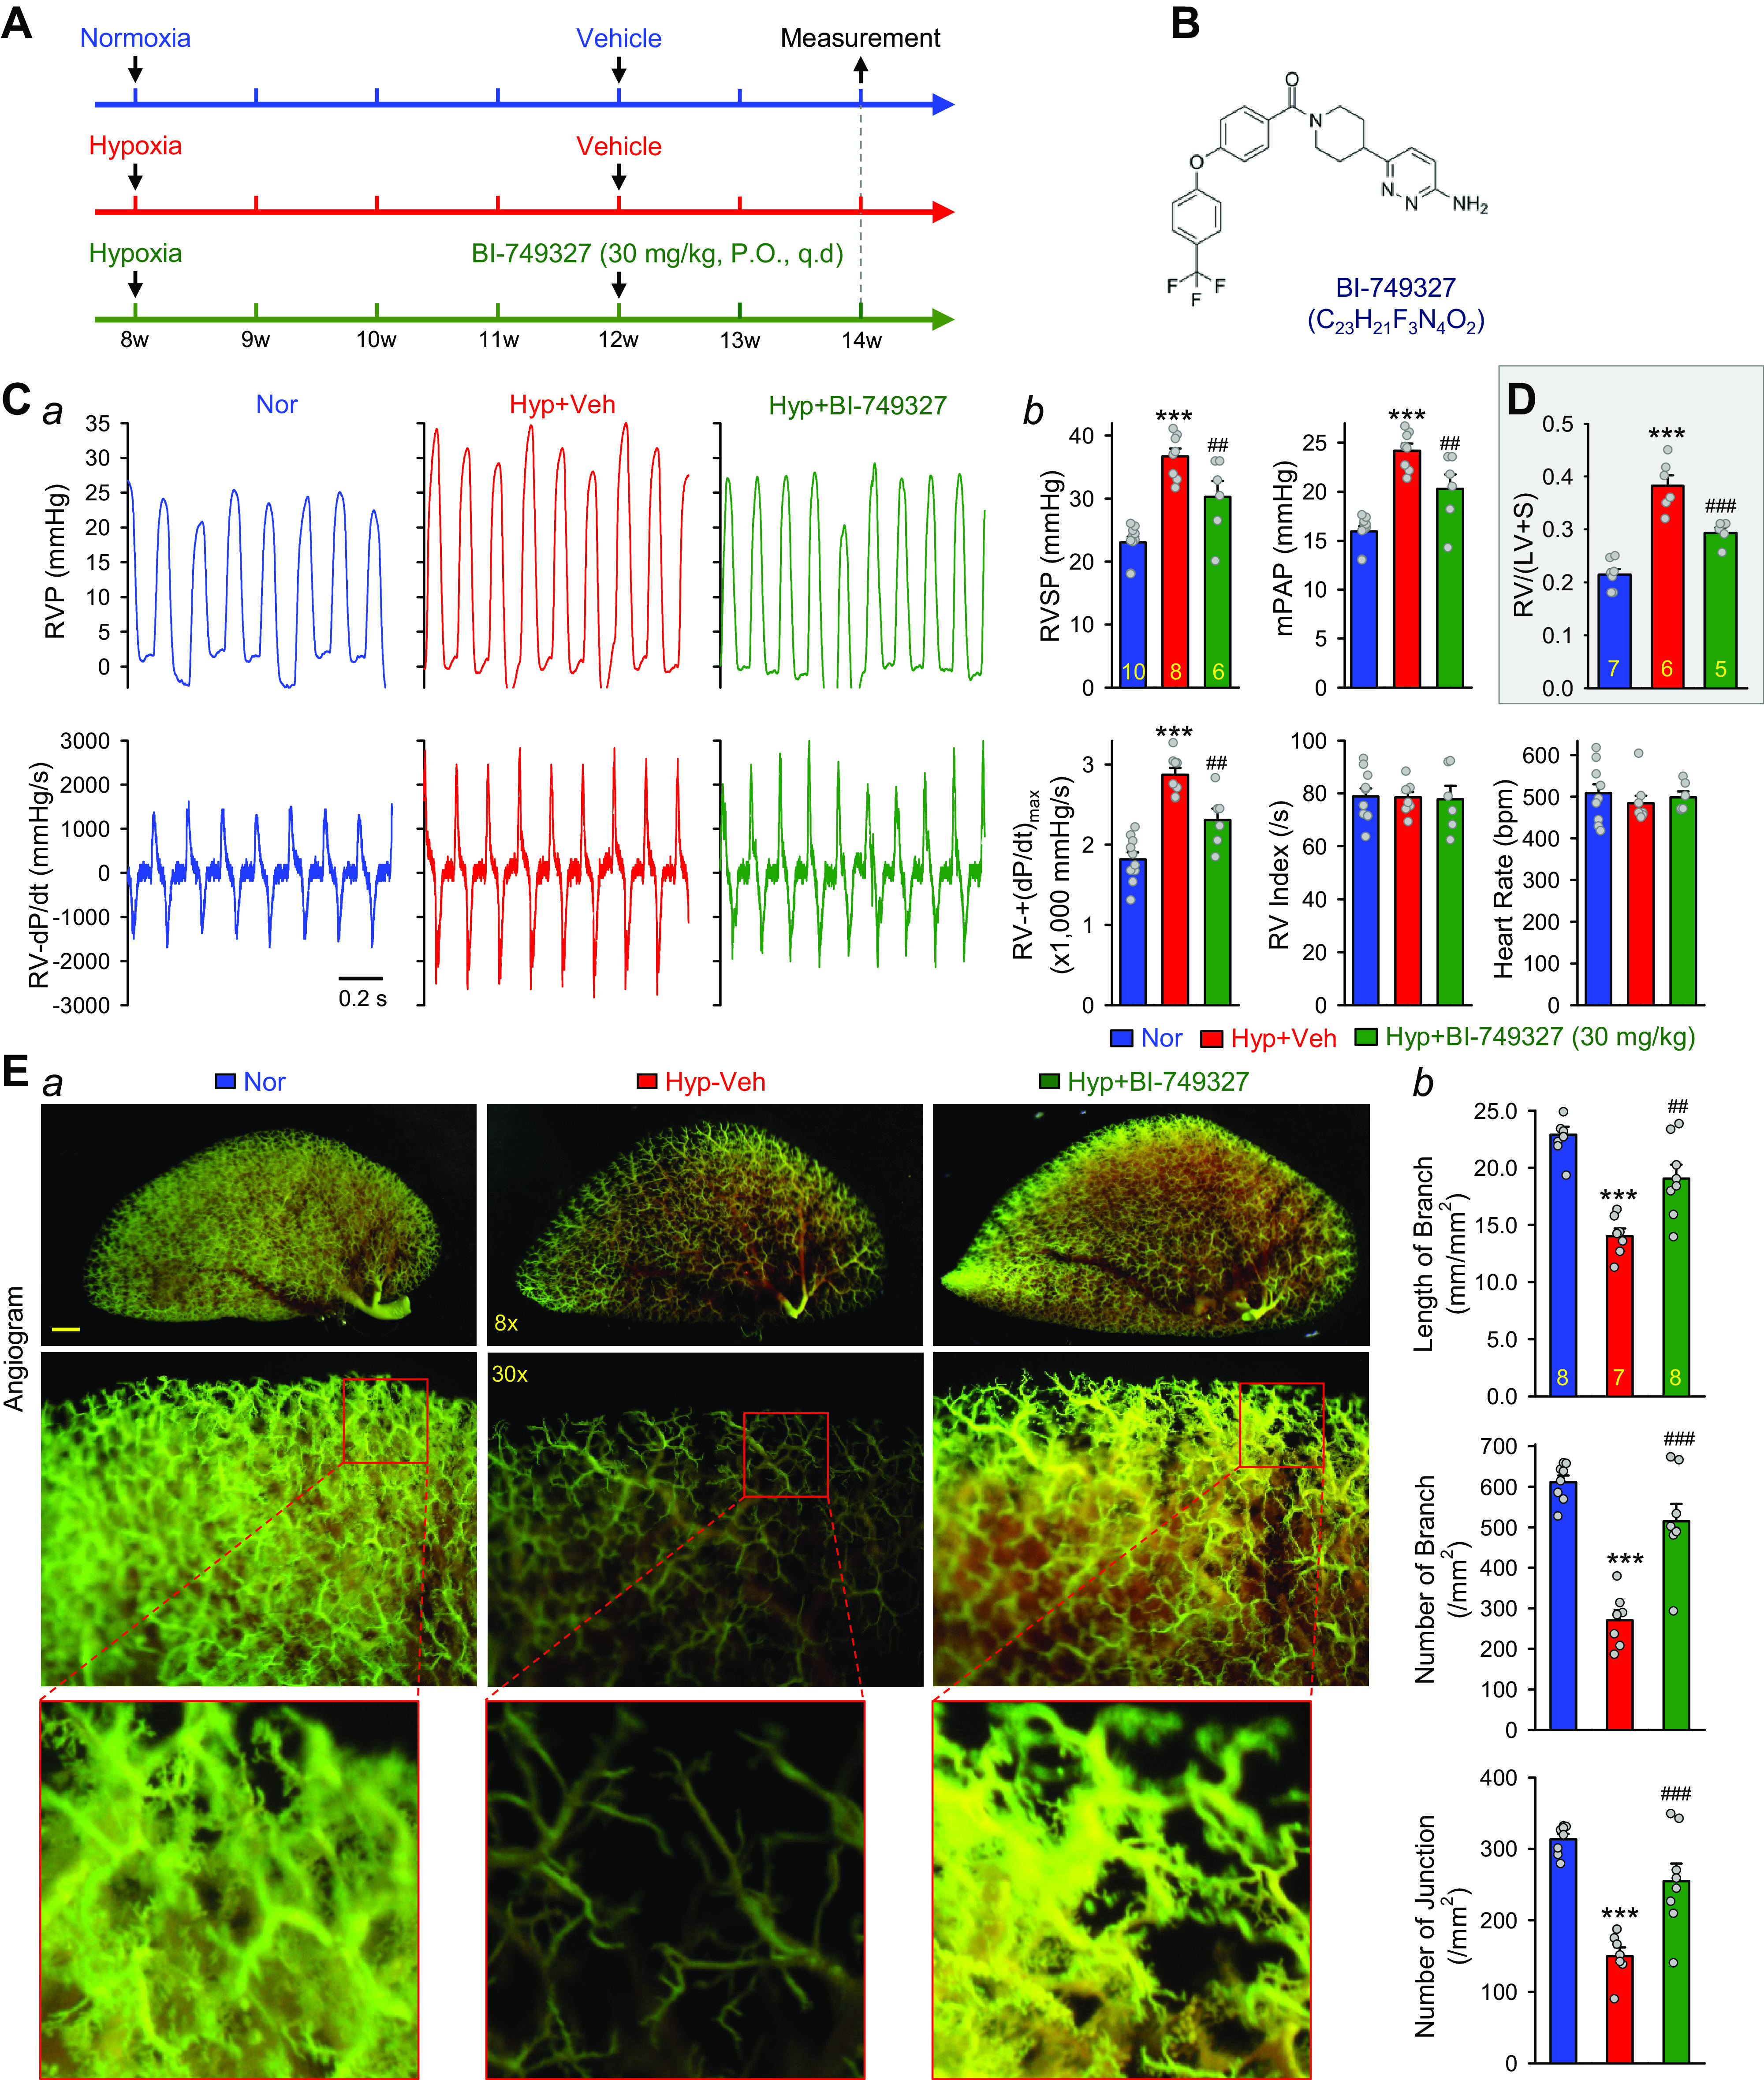
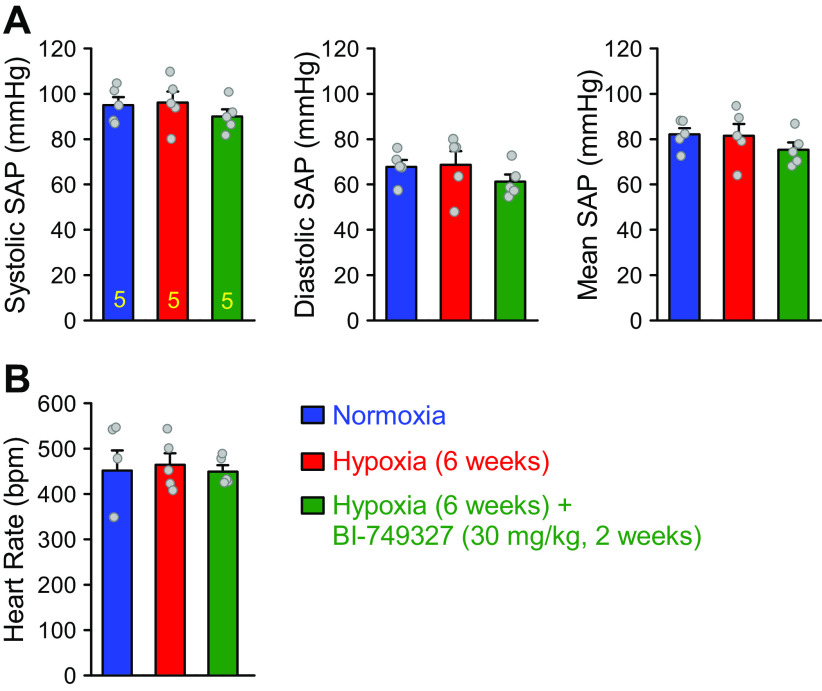
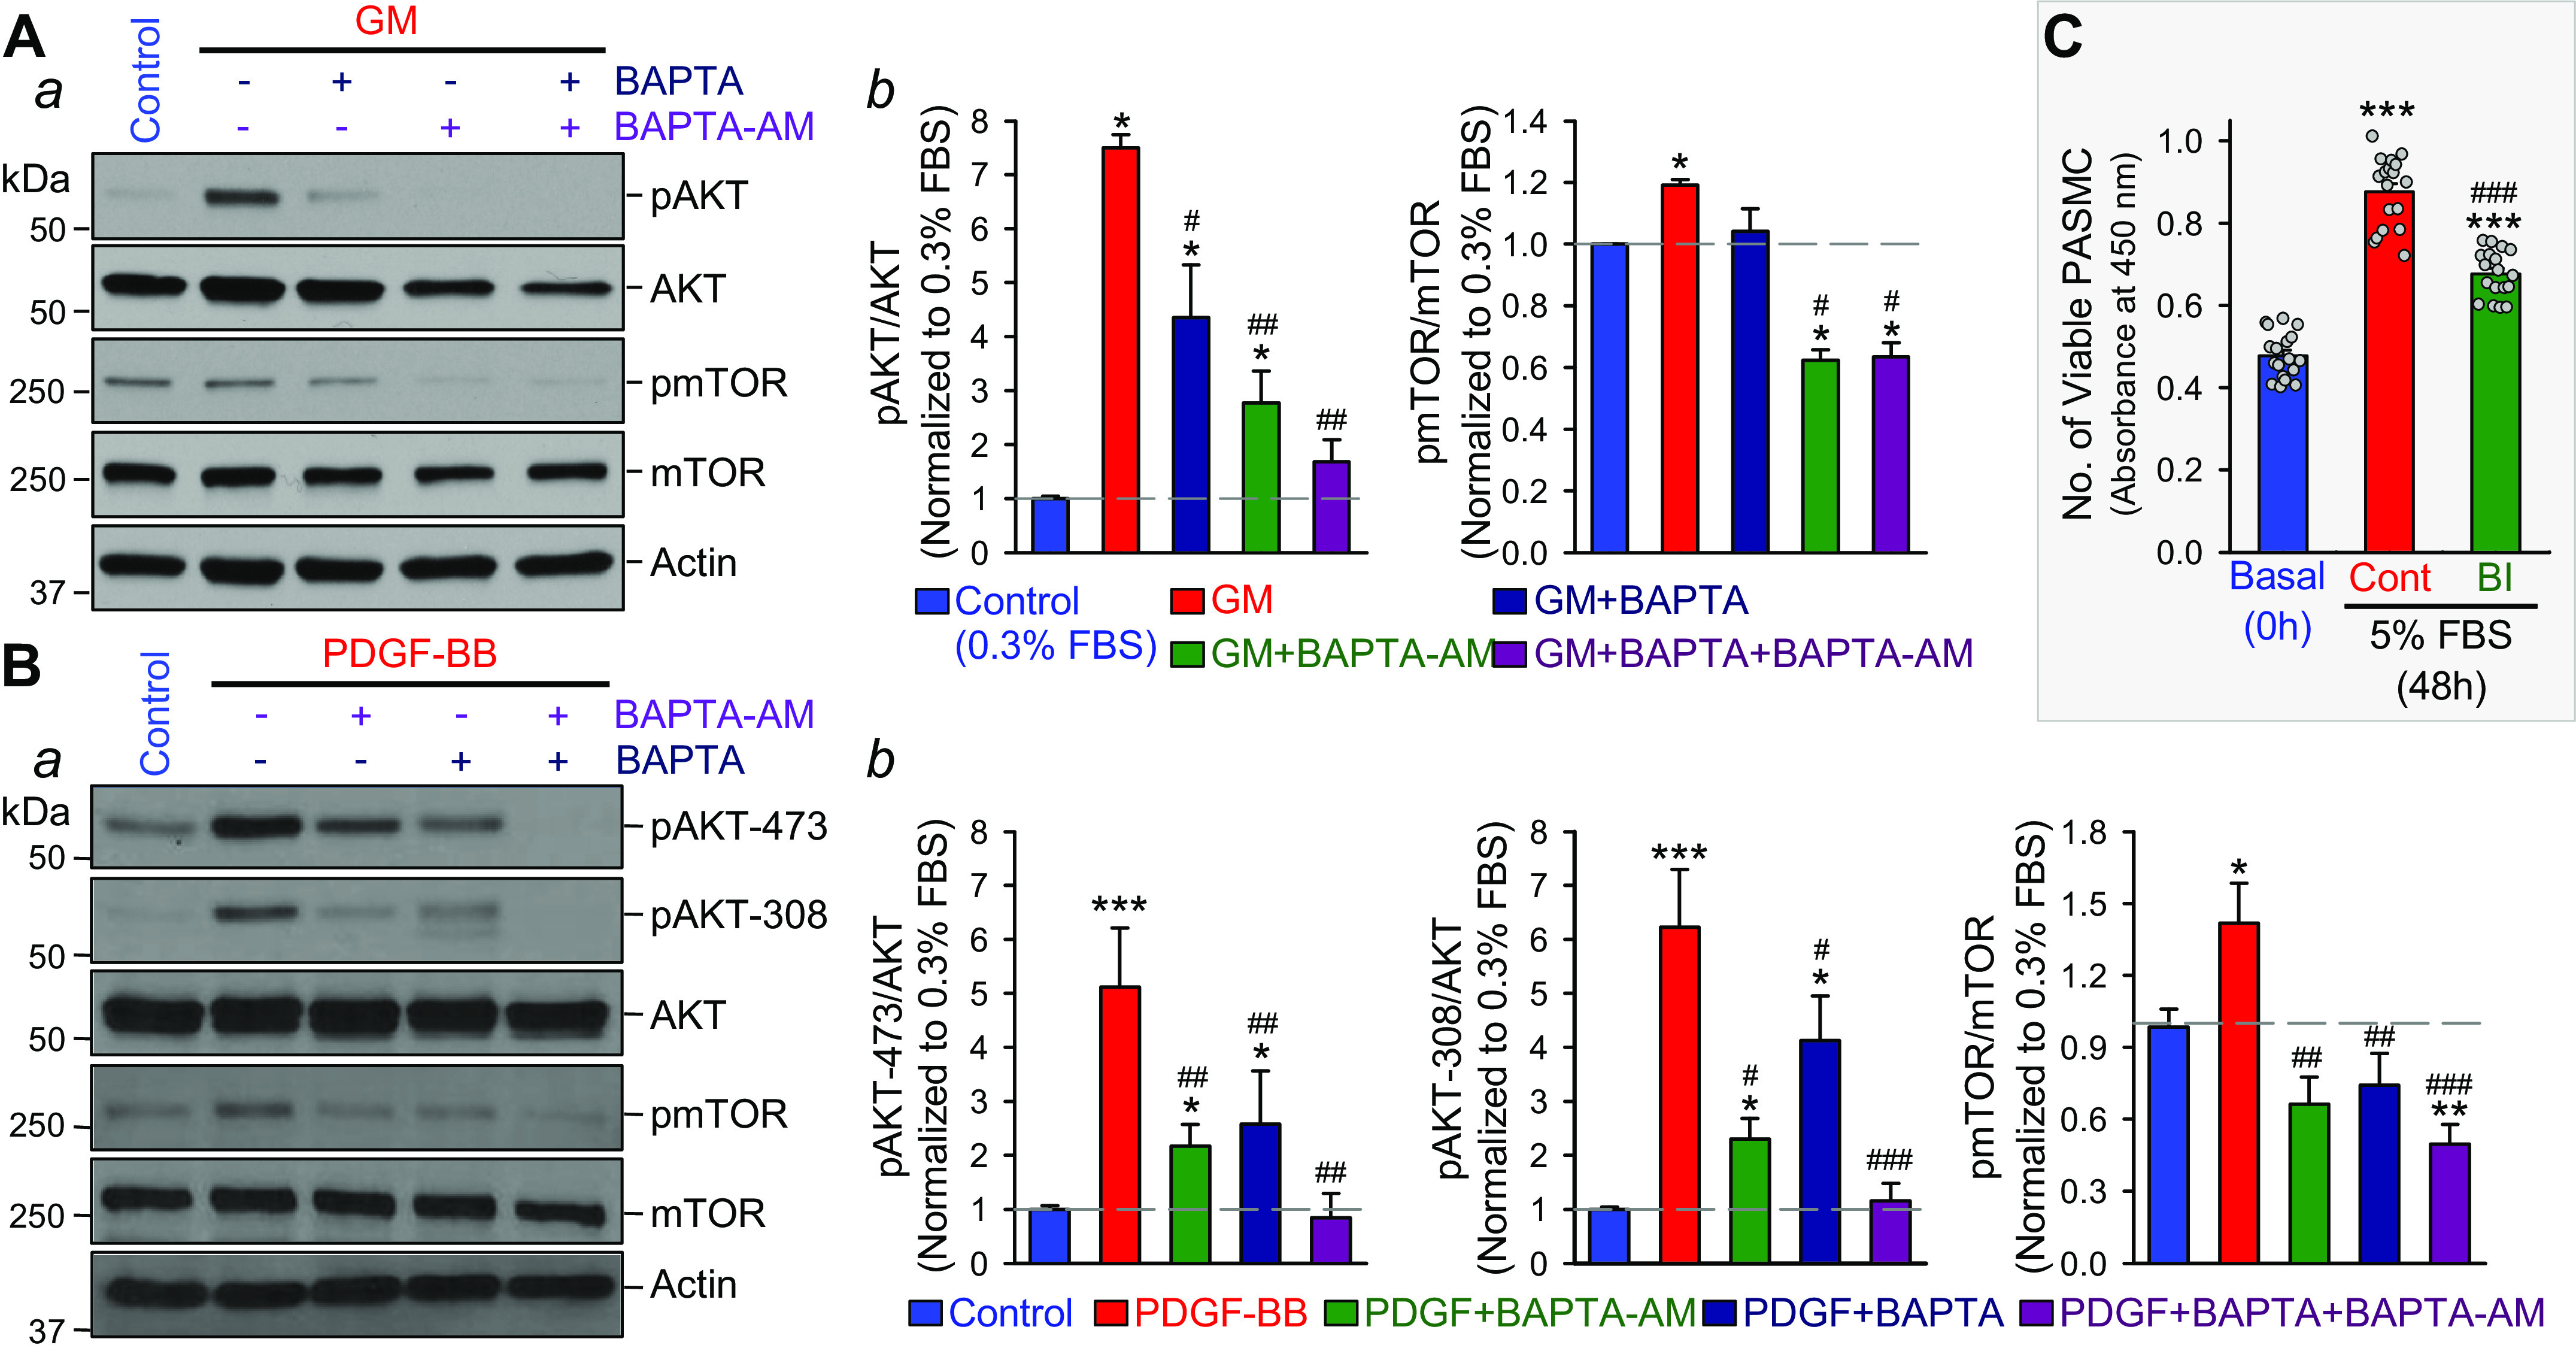
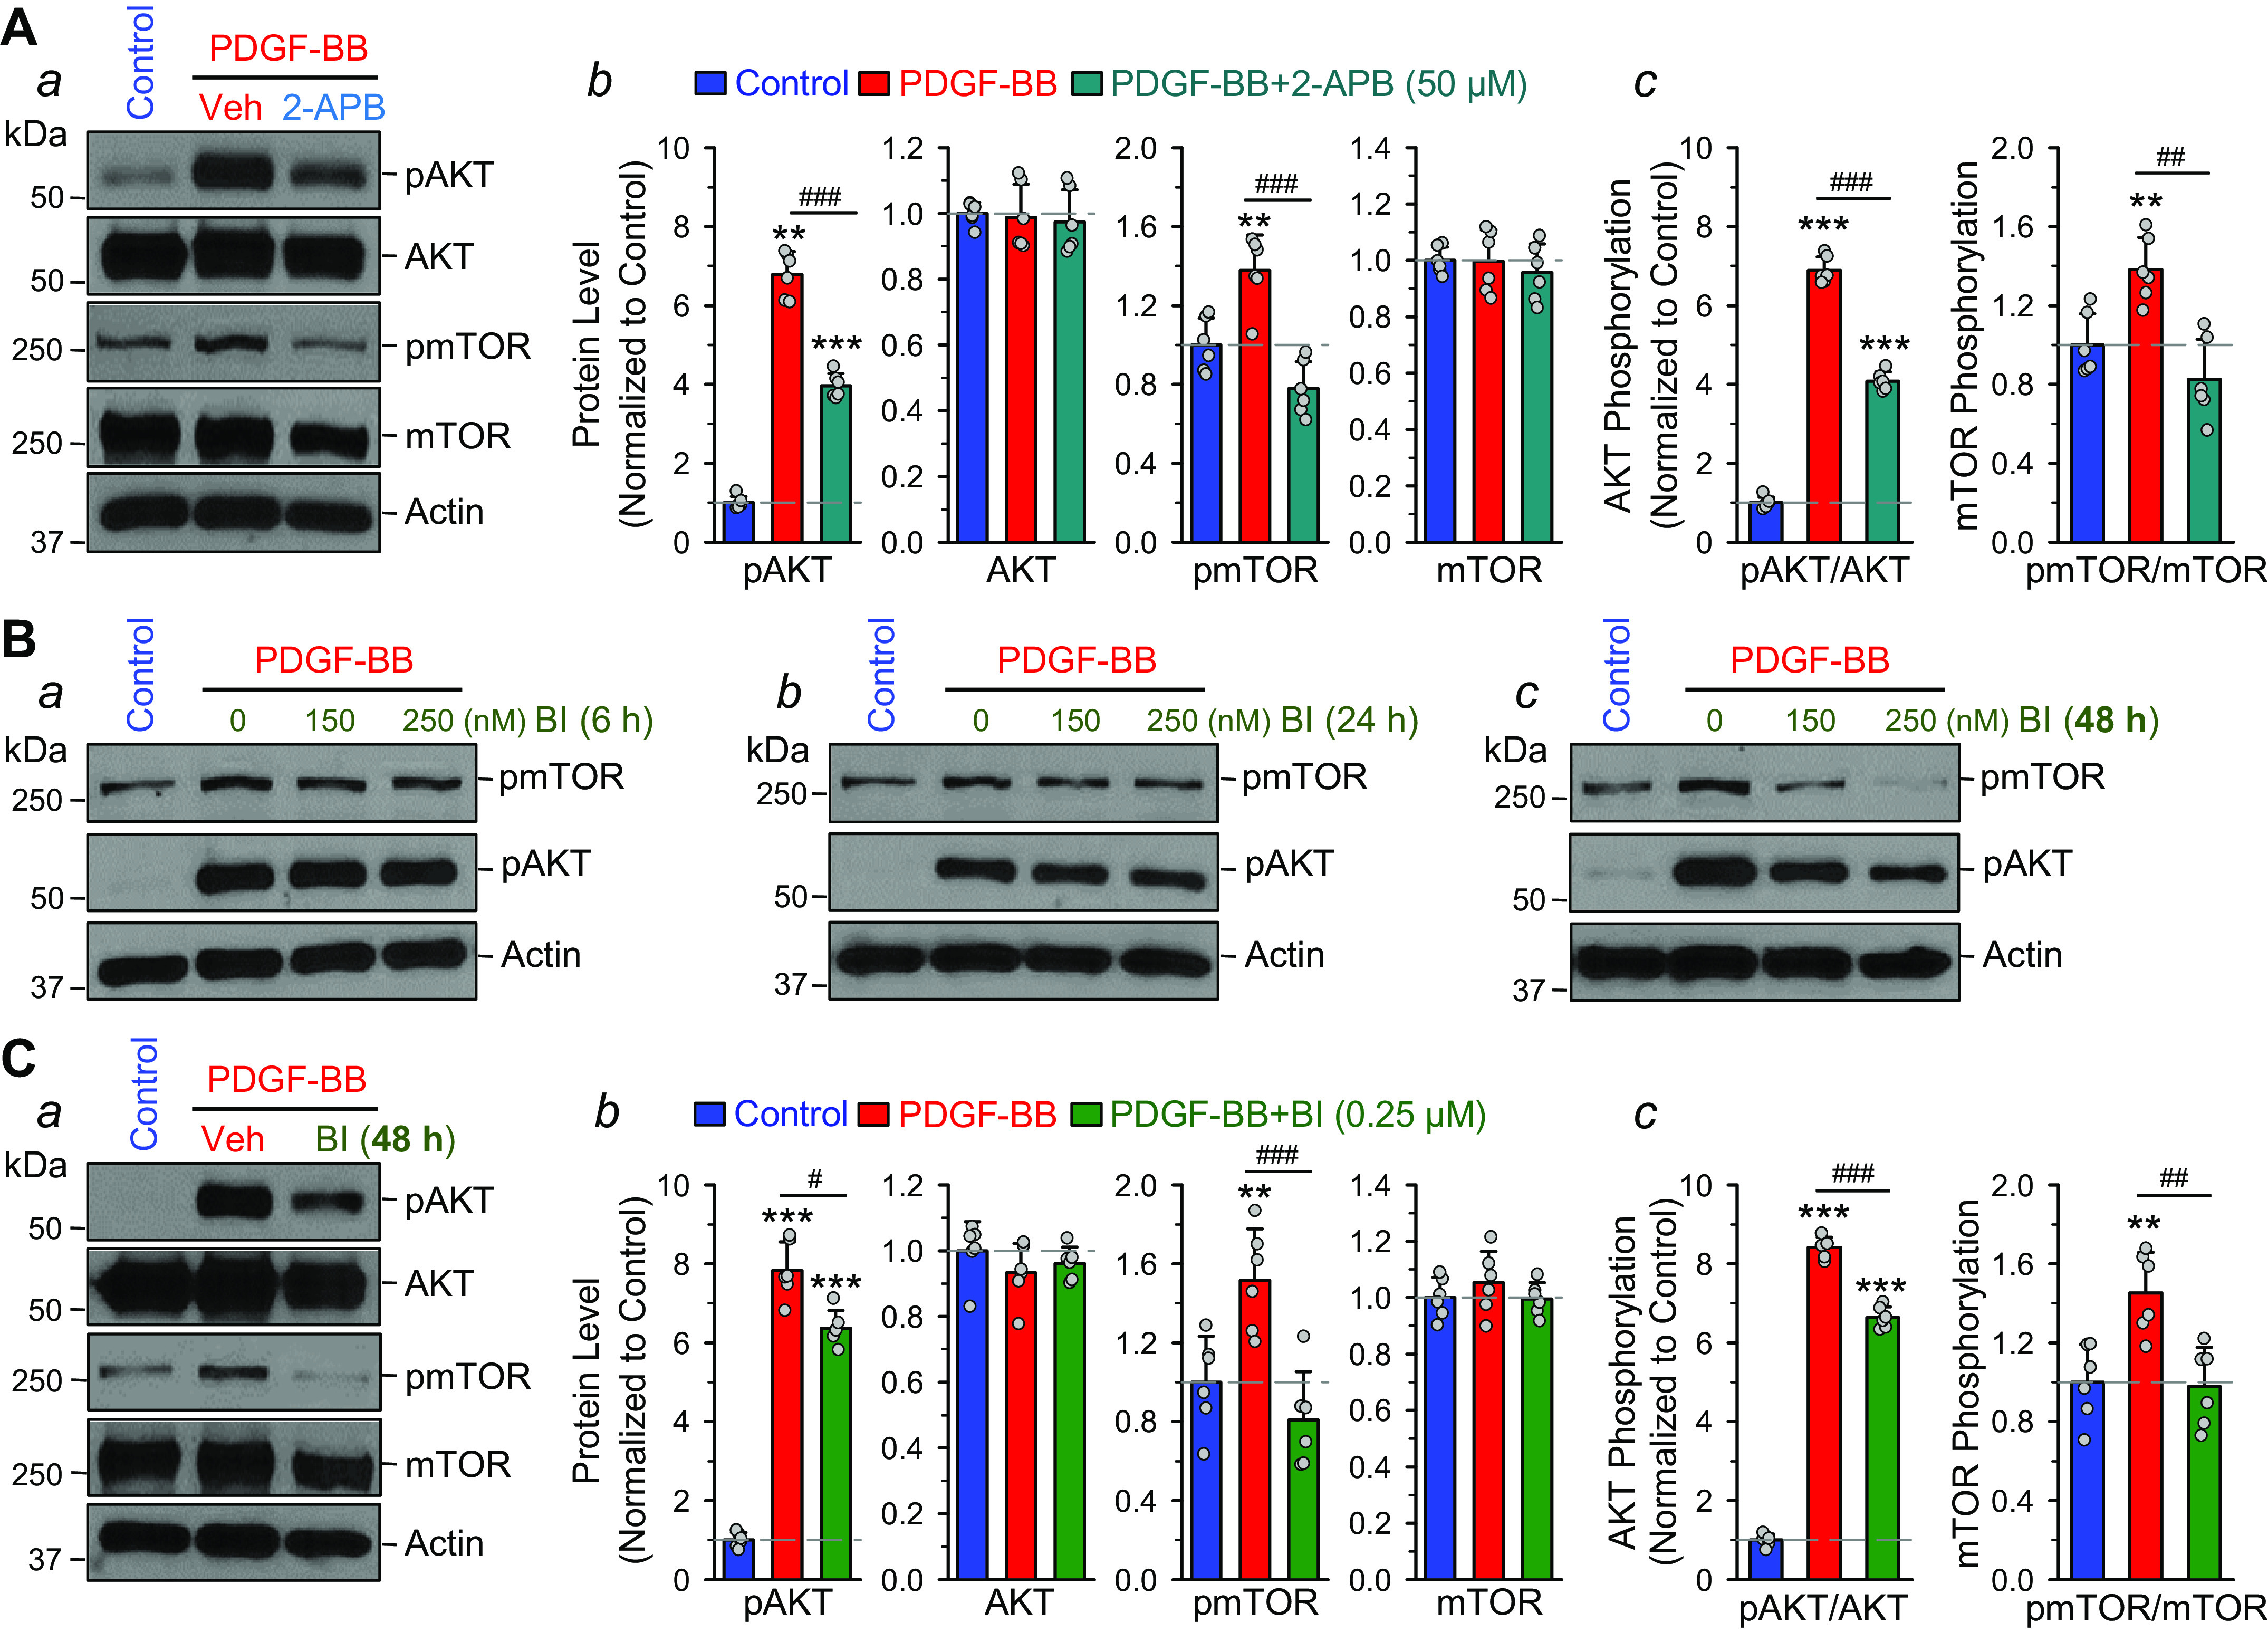
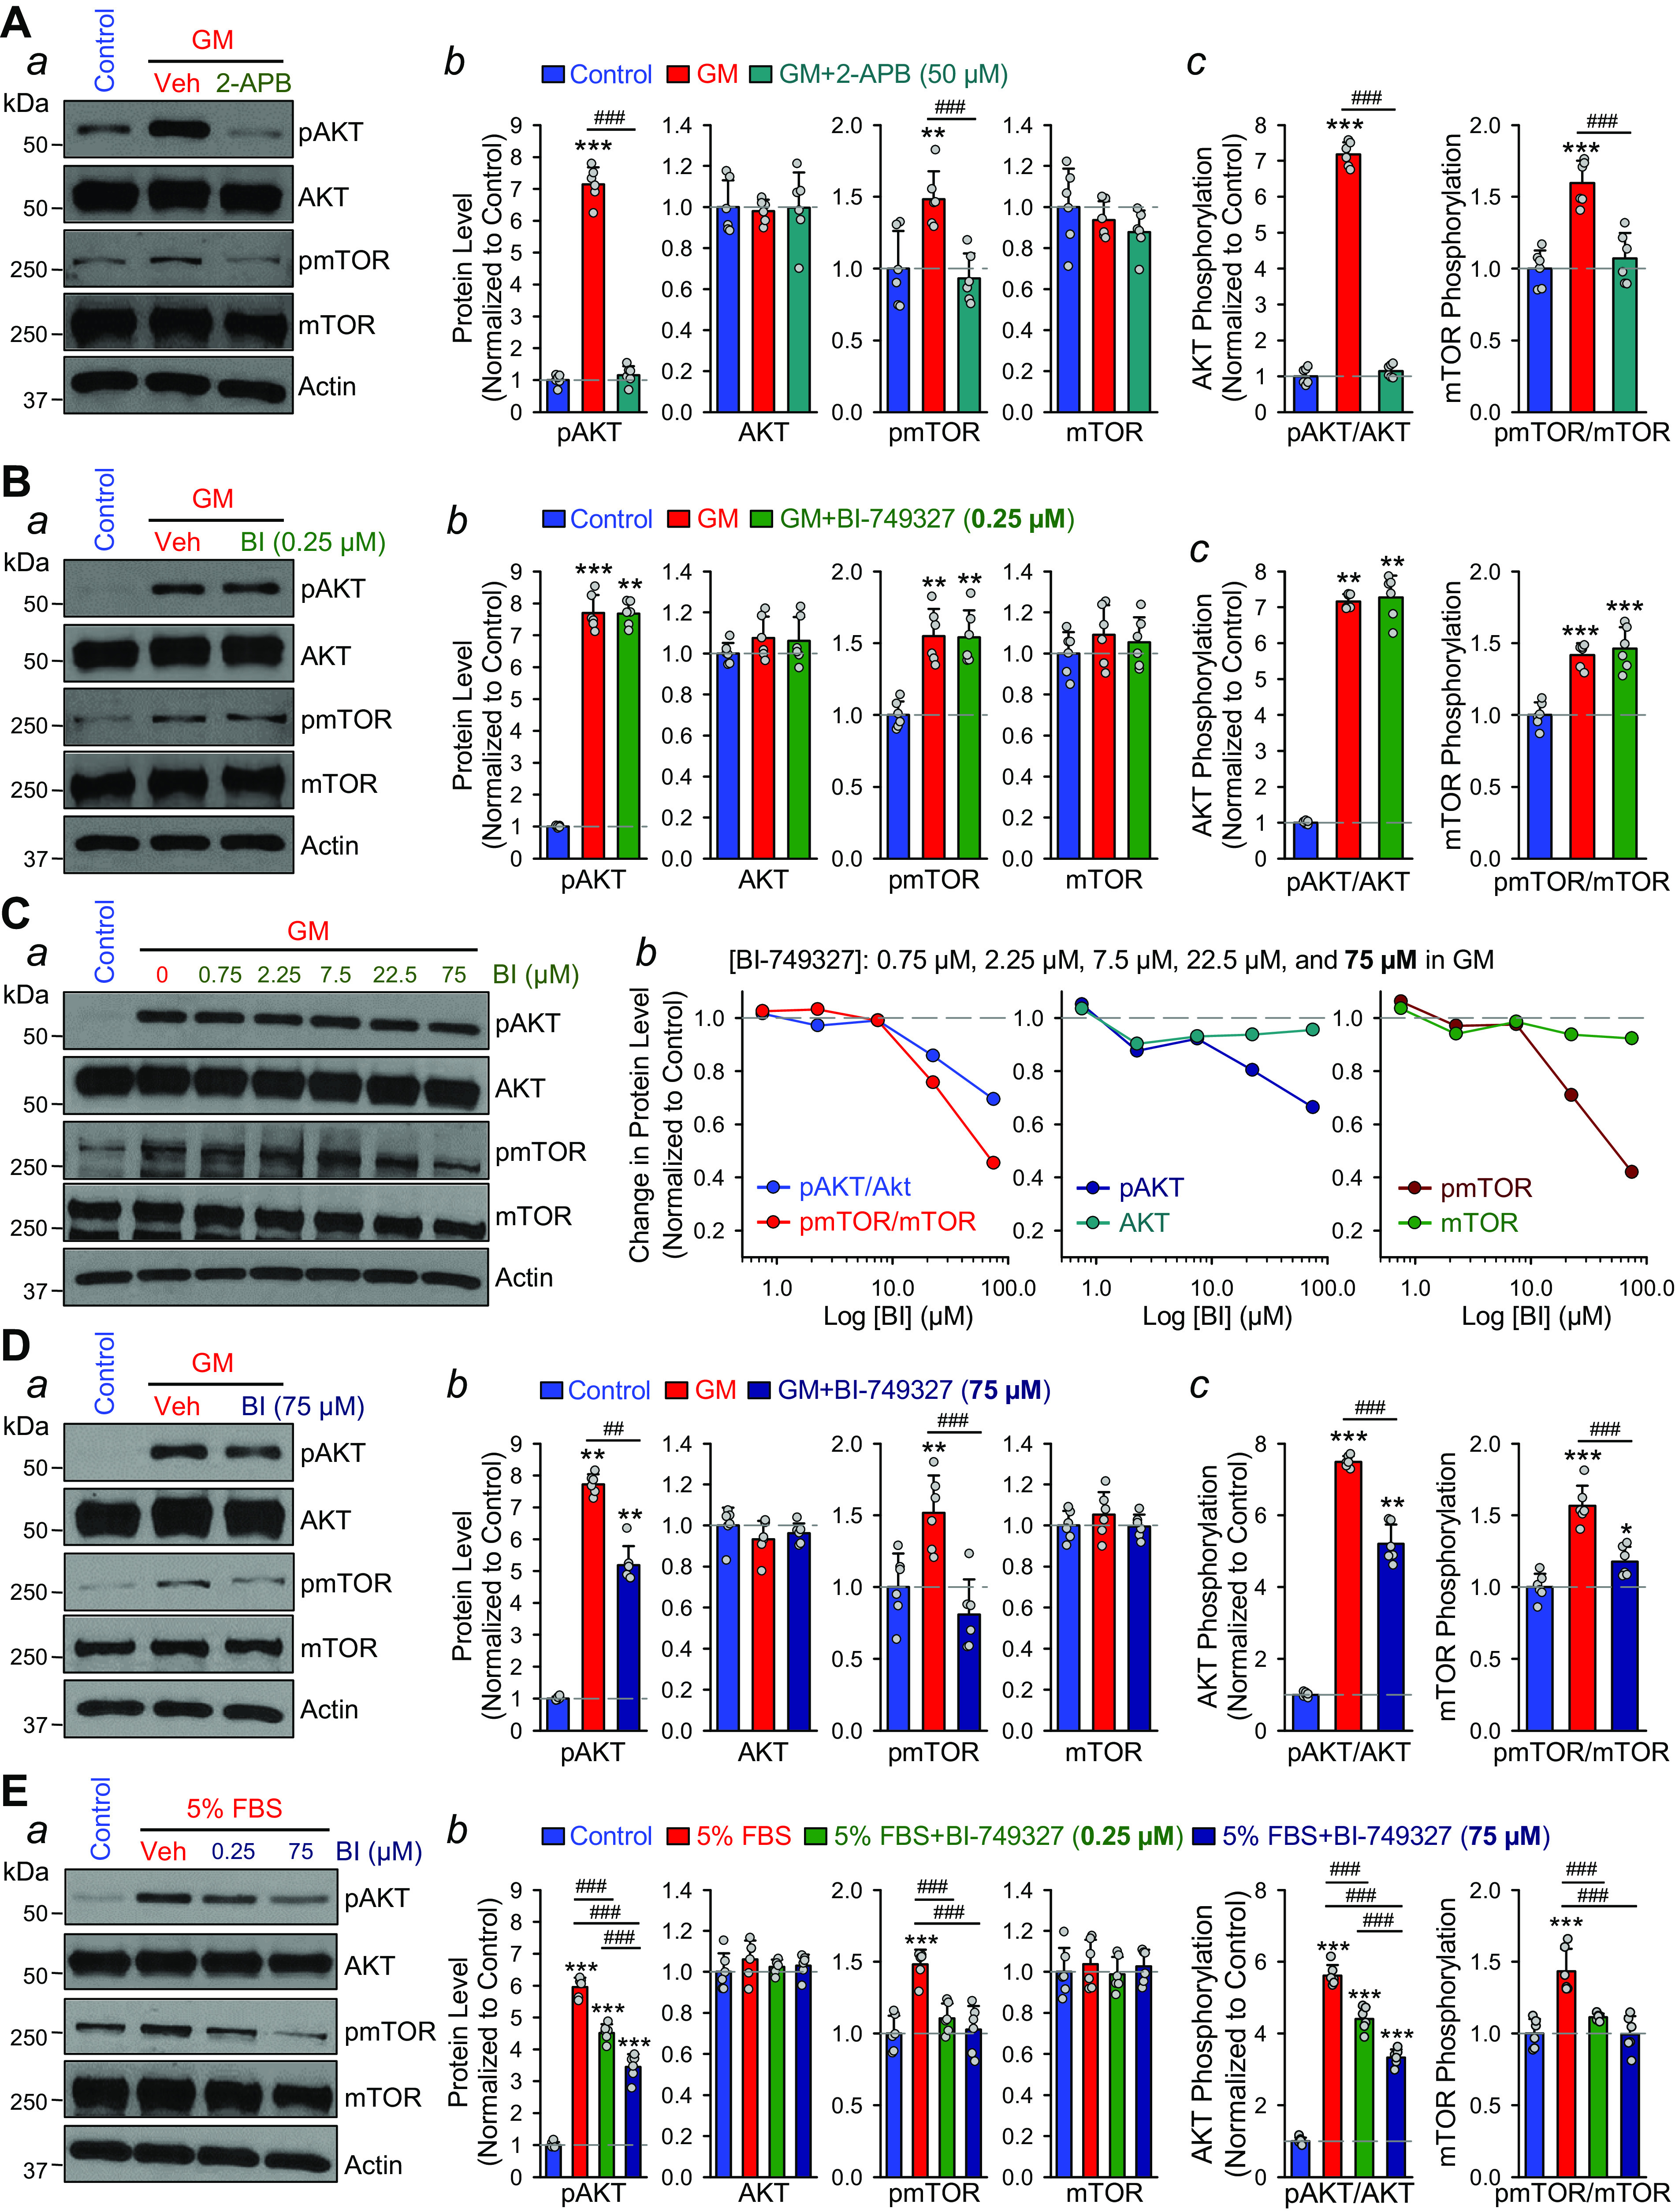
Idiopathic pulmonary arterial hypertension (PAH) is a fatal and progressive disease. Sustained vasoconstriction due to pulmonary arterial smooth muscle cell (PASMC) contraction and concentric arterial remodeling due partially to PASMC proliferation are the major causes for increased pulmonary vascular resistance and increased pulmonary arterial pressure in patients with precapillary pulmonary hypertension (PH) including PAH and PH due to respiratory diseases or hypoxemia. We and others observed upregulation of TRPC6 channels in PASMCs from patients with PAH. A rise in cytosolic Ca2+ concentration ([Ca2+]cyt) in PASMC triggers PASMC contraction and vasoconstriction, while Ca2+-dependent activation of PI3K/AKT/mTOR pathway is a pivotal signaling cascade for cell proliferation and gene expression. Despite evidence supporting a pathological role of TRPC6, no selective and orally bioavailable TRPC6 antagonist has yet been developed and tested for treatment of PAH or PH. In this study, we sought to investigate whether block of receptor-operated Ca2+ channels using a nonselective blocker of cation channels, 2-aminoethyl diphenylborinate (2-APB, administered intraperitoneally) and a selective blocker of TRPC6, BI-749327 (administered orally) can reverse established PH in mice. The results from the study show that intrapulmonary application of 2-APB (40 µM) or BI-749327 (3-10 µM) significantly and reversibly inhibited acute alveolar hypoxia-induced pulmonary vasoconstriction. Intraperitoneal injection of 2-APB (1 mg/kg per day) significantly attenuated the development of PH and partially reversed established PH in mice. Oral gavage of BI-749327 (30 mg/kg, every day, for 2 wk) reversed established PH by ∼50% via regression of pulmonary vascular remodeling. Furthermore, 2-APB and BI-749327 both significantly inhibited PDGF- and serum-mediated phosphorylation of AKT and mTOR in PASMC. In summary, the receptor-operated and mechanosensitive TRPC6 channel is a good target for developing novel treatment for PAH/PH. BI-749327, a selective TRPC6 blocker, is potentially a novel and effective drug for treating PAH and PH due to respiratory diseases or hypoxemia.

Keywords: BI-749327; calcium signaling; hypoxic pulmonary vasoconstriction; pulmonary hypertension; transient receptor potential channel.


Conflict of interest statement

No conflicts of interest, financial or otherwise, are declared by the authors.

Figures

Figure 1.
Figure 1.
BI-749327 (BI) reversibly inhibits cation currents in HEK-293 cells transiently transfected with the human TRPC6 gene. A: representative whole cell cation currents, elicited by depolarization from a holding potential of 0 mV to a series of test potentials ranging from −100 to +100 mV (in 20 mV increment) in mock- (−TRPC6, top) and TRPC6-transfected (+TRPC6, bottom) HEK cells before (Control), during (BI-749327), and after (Washout) extracellular application of 10 nM BI-749327. B: amplitudes of cation currents at −100 mV and +100 mV (means ± SE) in mock (−TRPC6, left) and TRPC6-transfected (+TRPC6, right) HEK cells before (Control), during (BI-749327), and after (Washout) extracellular application of BI-749327. *P < 0.05, ***P < 0.001 vs. Control (blue) and Washout (green); ##P < 0.01 vs. BI-749327 (red) with one-way ANOVA. C: the current-voltage (I-V) relationship curves in mock- (−TRPC6, left) TRPC6-transfected (+TRPC6, right) HEK cells before (Control, blue), during (BI-749327, red) and after (Washout, green) extracellular application of 10 nM BI-749327. Data are expressed as means ± SE (n = 6 cells). The I-V curves obtained from the cells before (Control) and during (BI-749327) treatment with BI-749327 are significantly different (P < 0.05 with one-way ANOVA). D: representative cation currents elicited by a ramp protocol from −100 mV to + 100 mV (for 1,100 ms) in TRPC6-transfected cell before (Cont, blue), during (BI, red), and after (Wash, green) extracellular application of BI-749327. E: representative time-course of BI-749327-mediated decrease in the amplitude of whole cell cation currents elicited by a test potential of +100 mV (from a holding potential of 0 mV). The horizontal bar indicates the time when BI-749327 was superfused to the cell (gray area).
Figure 2.
Figure 2.
Inhibition of TRPC6 channels with BI-749327 (BI) reversibly attenuates acute hypoxia-induced pulmonary vasoconstriction (HPV) in isolated perfused/ventilated mouse lungs. A: representative record showing changes in pulmonary artery pressure (PAP) before, during, and after ventilation of hypoxic gas (H, 1% O2 in N2, for 4 min) when physiological salt solution (PSS) with or without (Ca2+-free) 1.8 mM Ca2+ was perfused into pulmonary artery. B: representative records (left) depicting alveolar hypoxia (H)-induced changes in PAP before, during, and after intrapulmonary perfusion of 2-aminoethyl diphenylborinate (2-APB, 40 µM), a nonselective blocker of cation channels. Summarized data (means ± SE, n = 5 lungs or animals, right) showing the hypoxia-induced increases in PAP before (Cont), during (2-APB), and after (Rec) intrapulmonary superfusion of 2-APB. *P < 0.05 vs. Cont and Rec (ANOVA). C: representative records (left) showing hypoxia (H)-induced PAP changes before, during, and after intrapulmonary perfusion of the selective TRPC6 blocker, BI-749327, at concentrations of 1 (a), 3 (b), or 10 (c) µM, respectively. Summarized data (means ± SE, n = 5 lungs or animals, right) showing the hypoxia-induced increases in PAP before (Cont), during (BI), and after (Rec) intrapulmonary superfusion of 1 (a, n = 7), 3 (b, n = 7), or 10 (c, n = 6 lungs or animals) µM of BI-749327 (BI). **P < 0.01, ***P < 0.001 vs. Cont and Rec (ANOVA). D: dose-response curve depicting the percentage inhibition of hypoxia-induced increases in PAP during intrapulmonary application of 0 (Control), 1, 3, and 10 µM of BI. Data are shown as means ± SE (n = 6–7 lungs or animals). **P < 0.01, ***P < 0.001 vs. 0 µM BI (control); §§P < 0.01 vs. 1 µM BI; ##P < 0.01 vs. 3 µM BI (ANOVA).
Figure 3.
Figure 3.
Block of cation channels with 2-aminoethyl diphenylborinate (2-APB) inhibits the development and progression of hypoxia-induced pulmonary hypertension (HPH) in mice. A: experimental protocol for the prevention experiment using 2-APB. Eight-week-old C57Bl/6 mice are subjected to normoxia (Nor) or hypoxia (10% O2) for 4 wk. 2-APB (1 mg/kg/day) was intraperitoneally injected (ip) at the beginning of hypoxia exposure and continuously injected for 4 wk during hypoxia. B: chemical structure of 2-APB. C, a: representative records of right ventricular pressure (RVP) (top) and right ventricle (RV) contractility (RV-±dP/dt) (bottom) in normoxic (Nor) control mice, hypoxic (Hyp) mice, and Hyp mice receiving 2-APB (1 mg/kg ip, every day). Summarized data (means ± SE, b) showing right ventricular systolic pressure (RVSP), estimated mean pulmonary arterial pressure (mPAP), RV-+(dP/dt)max, RV contractility index [RV-+(dP/dt)max/RVSP], and heart rate in Nor (n = 10), Hyp (n = 10), and Hyp + 2-APB (n = 10) mice. *P < 0.05, ***P < 0.001 vs. Nor; ###P < 0.001 vs. Hyp (ANOVA). D: summarized data (means ± SE) showing Fulton Index, the ratio of the RV weight to the left ventricle (LV) and septum (S) weight [RV/(LV+S)] in Nor (n = 5), Hyp (n = 5), and Hyp + 2-APB (n = 5) mice. ***P < 0.001 vs. Nor; ###P < 0.001 vs. Hyp (ANOVA). E, a: representative images of angiograph of the left lung at ×8 (top) and ×30 (bottom) magnification from Nor, Hyp, and Hyp + 2-APB mice. Summarized data (means ± SE, b) showing the total length of lung vascular branches (left), the number of lung vascular branches (middle), and the number of lung vascular branch junctions (right) per square millimeter of the selected lung area from Nor (n = 5), Hyp (n = 5), and Hyp + 2-APB (n = 5) mice. ***P < 0.001 vs. Nor; ##P < 0.01, ###P < 0.001 vs. Hyp (ANOVA).
Figure 4.
Figure 4.
Inhibition of cation channels with 2-aminoethyl diphenylborinate (2-APB) partially reverses hypoxia-induced pulmonary hypertension (HPH) in mice. A: experimental protocol for the reversal experiment using 2-APB. Eight-week-old C57Bl/6 mice are subjected to normoxia (Nor) or hypoxia (10% O2) for 4 wk at first. 2-APB (1 mg/kg/day) was then intraperitoneally injected (ip) for two more weeks during hypoxia. B: chemical structure of 2-APB. C, a: representative records of right ventricular pressure (RVP) (top) and right ventricle (RV) contractility (RV-±dP/dt) (bottom) in normoxic (Nor) control mice, hypoxic (Hyp), mice and Hyp mice receiving 2-APB (1 mg/kg ip, every day). Summarized data (means ± SE, b) showing right ventricular systolic pressure (RVSP), estimated mean pulmonary arterial pressure (mPAP), RV-+(dP/dt)max, RV contractility index [RV-+(dP/dt)max/RVSP] and heart rate in Nor (n = 10), Hyp (n = 10), and Hyp + 2-APB (n = 10) mice. ***P < 0.001 vs. Nor; ##P < 0.01, ###P < 0.001 vs. Hyp (ANOVA). D: summarized data (means ± SE) showing Fulton Index, the ratio of the RV weight to the left ventricle (LV) and septum (S) weight [RV/(LV+S)] in Nor (n = 5), Hyp (n = 5), and Hyp + 2-APB (n = 5) mice. ***P < 0.001 vs. Nor; ###P < 0.001 vs. Hyp (ANOVA). E, a: representative images of angiograph of the left lung at × (top) and ×30 (bottom) magnification from Nor, Hyp, and Hyp + 2-APB (1 mg/kg/day for 2 wk after 4-wk of hypoxia exposure) mice. Summarized data (means ± SE, b) showing the total length of lung vascular branches (left), the number of lung vascular branches (middle), and the number of lung vascular branch junctions (right) per square millimeter of the selected lung area from Nor (n = 5), Hyp (n = 5), and Hyp + 2-APB (n = 5) mice. ***P < 0.001 vs. Nor; ##P < 0.01, ###P < 0.001 vs. Hyp (ANOVA).
Figure 5.
Figure 5.
Inhibition of TRPC6 channels with BI-749327 (BI) partially reverses hypoxia-induced pulmonary hypertension in mice. A: experimental protocol for the reversal experiment using BI-749327 (BI). Eight-week-old C57Bl/6 mice were subjected to normoxia (Nor) or hypoxia (10% O2) for 4 wk at first. BI-749327 (30 mg/kg/day) was then orally administered (orally) via oral gavage for two more weeks during hypoxia. B: chemical structure of BI-749327. C, a: representative records of right ventricular pressure (RVP) (top) and right ventricle (RV) contractility (RV-±dP/dt) (bottom) in normoxic (Nor) control mice, hypoxic (Hyp) mice, and Hyp mice receiving BI (30 mg/kg, orally, every day for 2 wk). Summarized data (means ± SE, b) showing right ventricular systolic pressure (RVSP), estimated mean pulmonary arterial pressure (mPAP), RV-+(dP/dt)max, RV contractility index [RV-+(dP/dt)max/RVSP], and heart rate in Nor (n = 10), Hyp (n = 8), and Hyp+BI (n = 6) mice. ***P < 0.001 vs. Nor; ##P < 0.05 vs. Hyp (ANOVA). D: summarized data (means ± SE) showing Fulton Index, the ratio of the RV weight to the left ventricle (LV) and septum (S) weight [RV/(LV+S)] in Nor (n = 7), Hyp (n = 6), and Hyp + BI-749327 (n = 5) mice. ***P < 0.001 vs. Nor; ###P < 0.001 vs. Hyp (ANOVA). E, a: representative images of angiograph of the left lung at ×8 (top) and ×30 (middle) magnification from Nor, Hyp, and Hyp + BI (30 mg/kg, orally, every day for 2 wk) mice. Images in the bottom panels are enlarged images from the selected areas of the ×30 images in the middle panels. Summarized data (means ± SE, b) showing the total length of lung vascular branches (top), the number of lung vascular branches (middle), and the number of vascular branch junctions (lower) per square millimeter of the selected lung area from Nor (n = 8), Hyp (n = 7), and Hyp + BI (n = 8) mice. ***P < 0.001 vs. Nor; ##P < 0.01, ###P < 0.001 vs. Hyp (ANOVA).
Figure 6.
Figure 6.
Inhibition of TRPC6 channels with BI-749327 (BI) negligibly affects systemic arterial pressure and heart rate in mice. Summarized data (means ± SE) showing systolic, diastolic, and calculated mean systemic arterial systolic (SAP) (A) and heart rate (B), determined by carotid artery catheterization in normoxic (Nor, n = 5) control mice, hypoxic (Hyp for 6 wk) mice (n = 5), and Hyp (for 6 wk) mice receiving BI (30 mg/kg, orally, every day for 2 wk, n = 5).
Figure 7.
Figure 7.
Growth factor-mediated phosphorylation of AKT and mTOR is dependent of extracellular and intracellular Ca2+ in human pulmonary arterial smooth muscle cells (PASMCs) and inhibition of TRPC6 channels with BI-749327 (BI) attenuates growth factor-mediated PASMC proliferation. A, a: Western blot analysis on phosphorylated AKT (pAKT), total AKT (AKT), phosphorylated mTOR (pmTOR), and total mTOR (mTOR) in control PASMCs and PASMCs treated with growth medium (GM) in the absence (−) and presence (+) of BAPTA (2 mM), a potent Ca2+ chelator that decreases extracellular free Ca2+ concentration to 400–500 nM, and BAPTA-AM (25 µM), a membrane-permeable BAPTA that significantly decreases intracellular free Ca2+ concentration. Summarized data (means ± SE, b) showing the ratio of pAKT/AKT and pmTOR/mTOR in control PASMCs (Control) and GM-treated PASMCs in the absence and presence of BAPTA and/or BAPTA-AM. *P < 0.05 vs. Control; #P < 0.05, ##P < 0.01 vs. GM (ANOVA). B, a: Western blot analysis on pAKT at Ser473 (pAKT-473), pAKT at Ser308 (pAKT-308), AKT, pmTOR, and mTOR in control PASMCs and PASMCs treated with platelet-derived growth factor (PDGF-BB, 10 ng/mL) in the absence (−) and presence (+) of BAPTA and/or BAPTA-AM. Summarized data (means ± SE, b) showing the ratio of pAKT-473/AKT (left), pAKT-308/AKT (middle), and pmTOR/mTOR (right) in control PASMCs (Control) and PDGF-treated PASMCs in the absence and presence of BAPTA and/or BAPTA-AM. *P < 0.05, **P < 0.01, ***P < 0.001 vs. Control; #P < 0.05, ##P < 0.01, ###P < 0.001 vs. PDGF (ANOVA). C: summarized data (means ± SE) showing the changes of number of viable cells in normal human PASMC cultured under basal condition (Basal, 0 h) and in 5% FBS-containing growth media in the absence (Cont) or presence (BI) of BI-749327 (250 nM) for 48 h. ***P < 0.001 vs. Basal; ###P < 0.001 vs. 5% FBS without (Cont) BI.
Figure 8.
Figure 8.
Block of cation channels with 2-aminoethyl diphenylborinate (2-APB) and block of TRPC6 channels with BI-749327 (BI) inhibit PDGF-induced AKT/mTOR phosphorylation in human pulmonary arterial smooth muscle cells (PASMCs). A, a: Western blot analysis on pAKT, AKT, pmTOR, and mTOR in control PASMCs and PASMCs treated with PDGF-BB (10 ng/mL) in the absence (vehicle control, Veh) and presence of 2-APB (50 µM, for 24 h), a nonselective blocker of cation channels. Summarized data (means ± SE) showing the relative protein levels of pAKT, AKT, pmTOR, and mTOR (b, normalized to Control) as well as the ratio of pAKT/AKT and pmTOR/mTOR (c, normalized to Control) in control PASMCs (Control) and PDGF-treated PASMCs in the absence (PDGF-BB) and presence (PDGF-BB + 2-APB) of 50 µM 2-APB. **P < 0.01, ***P < 0.001 vs. Control; ##P < 0.01, ###P < 0.001 vs. PDGF-BB. B: Western blot analysis on pAKT and pmTOR in control PASMCs and PASMCs treated with PDGF-BB (10 ng/mL) in the absence (Veh) and presence of 150 and 250 nM of BI-749327, a selective blocker of TRPC6 channels, for 6 (a), 24 (b), and 48 (c) h. C, a: Western blot analysis on pAKT, AKT, pmTOR, and mTOR in control PASMCs and PASMCs treated with PDGF-BB (10 ng/mL) in the absence (Veh) and presence of BI-749327 (BI, 250 nM for 48 h), a selective blocker of TRPC6 channels. Summarized data (means ± SE) showing the relative protein levels of pAKT, AKT, pmTOR, and mTOR (b, normalized to Control) as well as the ratio of pAKT/AKT and pmTOR/mTOR (c, normalized to Control) in control PASMCs (Control) and PDGF-treated PASMCs in the absence (PDGF-BB) and presence (PDGF-BB + BI-749327) of 250 nM BI-949327. **P < 0.01, ***P < 0.001 vs. Control; #P < 0.05, ##P < 0.01, ###P < 0.001 vs. PDGF-BB.
Figure 9.
Figure 9.
Block of cation channels with 2-aminoethyl diphenylborinate (2-APB) and block of TRPC6 with BI-749327 (BI) inhibit growth media (GM)- and serum (5% FBS)-induced AKT/mTOR phosphorylation in human pulmonary arterial smooth muscle cells (PASMCs). A, a: Western blot analysis on pAKT, AKT, pmTOR, and mTOR in control PASMCs and PASMCs treated with GM (including 5% FBS, SMC basal medium, 5 ng/mL hEGF, 5 ng/mL hFGF-β, 5 μg/mL human insulin, 50 μg/mL ascorbic acid, 10 mM l-glutamine, 30 mg/mL gentamicin, and 15 μg/mL amphotericin B) for 30 min in the absence (vehicle control, Veh) and presence (2-APB) of 2-APB (50 µM for 24 h), a nonselective blocker of cation channels. Summarized data (means ± SE) showing the relative protein levels of pAKT, AKT, pmTOR, and mTOR (b, normalized to Control) as well as the ratio of pAKT/AKT and pmTOR/mTOR (c, normalized to Control) in control PASMCs (Control) and GM-treated PASMCs in the absence (GM) and presence (GM + 2-APB) of 50 µM 2-APB. **P < 0.01, ***P < 0.001 vs. Control; ###P < 0.001 vs. GM (ANOVA). B, a: Western blot analysis on pAKT, AKT, pmTOR, and mTOR in control PASMCs and PASMCs treated with GM (for 30 min) in the absence (Veh) and presence (BI) of BI-749327 (0.25 µM for 48 h), a selective blocker of TRPC6 channels. Summarized data (means ± SE) showing the relative protein levels of pAKT, AKT, pmTOR, and mTOR (b, normalized to Control) as well as the ratio of pAKT/AKT and pmTOR/mTOR (c) in control PASMCs (Control) and GM-treated PASMCs in the absence (GM) and presence (GM + BI 749327) of 0.25 µM BI-749327. **P < 0.01, ***P < 0.001 vs. Control (ANOVA). C, a: Western blot analysis on pAKT, AKT, pmTOR and mTOR in control PASMCs and PASMCs treated with GM (for 30 min) in the absence (Veh) and presence of 0.75, 2.25, 7.5, 22.5, 75 µM BI-749327 (for 48 h). Dose-response curves (b) showing the ratio of pAKT/AKT and pmTOR/mTOR as well as the relative protein levels of pAKT, AKT, pmTOR, and mTOR (normalized to Control) in control PASMCs (Control) and GM-treated PASMCs in the absence (GM) and presence (GM + BI 749327) of 0.75, 2.25, 7.5, 22.5, 75 µM of BI-749327. D, a: Western blot analysis on pAKT, AKT, pmTOR, and mTOR in control PASMCs and PASMCs treated with GM in the absence (Veh) and presence (BI) of 75 µM BI-749327 (for 48 h). Summarized data (means ± SE) showing the relative protein levels of pAKT, AKT, pmTOR, and mTOR (b, normalized to Control) as well as the ratio of pAKT/AKT and pmTOR/mTOR (c) in control PASMCs (Control) and GM-treated PASMCs in the absence (GM) and presence (GM + BI 749327) of 75 µM BI-749327. *P < 0.05, **P < 0.01, ***P < 0.001 vs. Control; ##P < 0.01, ###P < 0.001 vs. GM. E, a: Western blot analysis on pAKT, AKT, pmTOR and mTOR in control PASMCs and PASMCs treated with 5% fetal bovine serum (FBS)-containing medium without growth factors (5% FBS) in the absence (Veh) and presence (BI) of 0.25 and 75 µM BI-749327 (for 48 h). Summarized data (means ± SE, b) showing the relative protein levels of pAKT, AKT, pmTOR, and mTOR (normalized to Control) as well as the ratio of pAKT/AKT and pmTOR/mTOR in control PASMCs (Control) and 5% FBS medium-treated PASMCs in the absence (5% FBS) and presence (5% FBS + BI-749327) of 0.25 and 75 µM BI-749327. ***P < 0.001 vs. Control; ###P < 0.001 vs. 5% FBS (ANOVA).

Similar articles

Cited by

References

    1. Humbert M, Sitbon O, Simonneau G. Treatment of pulmonary arterial hypertension. N Engl J Med 351: 1425–1436, 2004. doi:10.1056/NEJMra040291. - DOI - PubMed
    1. Benza RL, Miller DP, Barst RJ, Badesch DB, Frost AE, McGoon MD. An evaluation of long-term survival from time of diagnosis in pulmonary arterial hypertension from the REVEAL Registry. Chest 142: 448–456, 2012. doi:10.1378/chest.11-1460. - DOI - PubMed
    1. Farber HW, Miller DP, Poms AD, Badesch DB, Frost AE, Muros-Le Rouzic E, Romero AJ, Benton WW, Elliott CG, McGoon MD, Benza RL. Five-year outcomes of patients enrolled in the REVEAL Registry. Chest 148: 1043–1054, 2015. doi:10.1378/chest.15-0300. - DOI - PubMed
    1. Frost AE, Badesch DB, Barst RJ, Benza RL, Elliott CG, Farber HW, Krichman A, Liou TG, Raskob GE, Wason P, Feldkircher K, Turner M, McGoon MD. The changing picture of patients with pulmonary arterial hypertension in the United States: how REVEAL differs from historic and non-US Contemporary Registries. Chest 139: 128–137, 2011. doi:10.1378/chest.10-0075. - DOI - PubMed
    1. Hassoun PM, Mouthon L, Barbera JA, Eddahibi S, Flores SC, Grimminger F, Jones PL, Maitland ML, Michelakis ED, Morrell NW, Newman JH, Rabinovitch M, Schermuly R, Stenmark KR, Voelkel NF, Yuan JX, Humbert M. Inflammation, growth factors, and pulmonary vascular remodeling. J Am Coll Cardiol 54: S10–S19, 2009. doi:10.1016/j.jacc.2009.04.006. - DOI - PubMed

Publication types

MeSH terms