. 2022 Jan;12(1):163-174.
doi: 10.1002/2211-5463.13319. Epub 2021 Nov 8.

Identification and characterization of a novel glutaminase inhibitor

Affiliations

Identification and characterization of a novel glutaminase inhibitor

Henning Cederkvist et al. FEBS Open Bio. 2022 Jan.

Abstract

In humans, there are two forms of glutaminase (GLS), designated GLS1 and GLS2. These enzymes catalyse the conversion of glutamine to glutamate. GLS1 exists as two isozymes: kidney glutaminase (KGA) and glutaminase C (GAC). Several GLS inhibitors have been identified, of which DON (6-diazo-5-oxonorleucine), BPTES (bis-2-(5-phenylacetamido-1, 3, 4-thiadiazol-2-yl) ethyl sulphide), 968 (5-(3-Bromo-4-(dimethylamino)phenyl)-2,2-dimethyl-2,3,5,6-tetrahydrobenzo[a]phenanthridin-4(1H)-one) and CB839 (Telaglenastat) are the most widely used. However, these inhibitors have variable efficacy, specificity and bioavailability in research and clinical settings, implying the need for novel and improved GLS inhibitors. Based on this need, a diverse library of 28,000 compounds from Enamine was screened for inhibition of recombinant, purified GAC. From this library, one inhibitor designated compound 19 (C19) was identified with kinetic features revealing allosteric inhibition of GAC in the µm range. Moreover, C19 inhibits anti-CD3/CD28-induced CD4+ T-cell proliferation and cytokine production with similar or greater potency as compared to BPTES. Taken together, our data suggest that C19 has the potential to modulate GLS1 activity and alter metabolic activity of T cells.

Keywords: BPTES; CB839; CD4+ T cells; GAC; GLS inhibitor; high-throughput screening.


Conflict of interest statement

The authors declare no conflict of interest.

Figures

Fig. 1
Fig. 1
Cloning, expression, purification and functional testing of recombinant human glutaminase Δ129GAC. (A) Schematic representation of the cDNA of Δ16GAC, Δ72GAC and Δ129GAC. (B) Δ16GAC, Δ72GAC and Δ129GAC were PCR amplified from His‐tagged hGAC inserted in the PET24b vector. (C) Expressed recombinant His‐tagged Δ129GAC was purified using a HisTrap 1 mL Ni2+‐NTA affinity column. Protein purity analysed by SDS/PAGE shows a ~ 50 kDa His‐tag Δ129GAC protein. The SDS/PAGE image shown in the figure was cropped from same part of the gel. Full‐length gel image is presented in Fig. S1. (D) Δ129GAC activity was measured in a coupled enzyme assay where glutaminase activity was measured indirectly by monitoring Δ129GAC activity as the production of NADH from the conversion of glutamate to α‐ketoglutarate by GDH (see Material and Methods for details). (E) Δ129GAC activity was measured in a coupled enzyme assay determining NADH production as a function of glutamine conversion to glutamate by Δ129GAC and in turn glutamate to α‐KG with NADH by GDH. Optimal concentration of glutamine was determined by titration of incremental concentrations (3.2–100 mm) and measuring NADH at 340 nm after 5, 10 and 15 min. Glutamine concentrations above 3.5 mm led to substrate inhibition. Measured absorbance from enzyme activity was adjusted by a negative control containing only buffer, protein and substrate. (F) The optimal level of Pi in the assay was determined in the presence of 3.125–100 mm Pi. 50 mm Pi was determined as the optimal concentration for the assay. Measured absorbance from enzyme activity was adjusted by a negative control containing only buffer, protein and substrate. (G) The linearity response of the assay was determined by plotting the raw data subtracted by the blank readings to validate the assay for kinetic studies. Linearity (R 2 = 0.98) was determined in the presence of 4 mm glutamine up to 5 min, implying a robust assay. Data shown are means ± S.D (n = 3).
Fig. 2
Fig. 2
HTS of chemical compounds inhibiting Δ129GAC activity. (A) Incremental doses of the GLS1 inhibitor CB839 (1–1800 nm) were used as a negative control for Δ129GAC enzyme inhibition yielding an IC50‐value 60 nm by nonlinear curve fitting. Data are presented as mean ± S.D (n = 3). (B) GDH activity was measured after 20 min in the presence of 30 nm CB839. CB839 showed no inhibition effect on secondary enzyme (GDH) in the HTS assay. Data are presented as mean ± S.D (n = 3). (C) Validation of the primary screening assay. A test run of the primary screen consisting of 192 wells for both negative control (10 µm CB839, blue) and positive control (normal assay, red) was used and measured after a 20‐min time point to calculate the statistical coefficient, Z‐prime (Z′)‐factor and signal to background noise (S/B) to validate the primary HTS. (D) 28,000 compounds were measured in a total of 80 plates for Δ129GAC specificity. Individual Z′‐factor for each plate is plotted, and after 80 plate readings, it was determined to be 0.78 ± 0.07. (E) (I) through (V) show the numbers of compounds that inhibited Δ129GAC. This shows that 400 compounds exhibit ≥ 30% inhibitory effect in the primary screen and were submitted for counter screen (II). The rescreen (III) was performed with triplicates of 37 compounds after counter screen (step II). From the rescreen (III), 3 compounds were validated by dose response (10 points in duplicates) resulting in 3 positive compounds (IV). After characterization of 3 compounds, C19 was chosen with ≥ 90% inhibition (Step V). (F) Chemical structures of compound C2, C15 and C19, respectively. (G) Characterization of C2, C15 and C19 in the rescreen was performed by 10‐point dose response with twofold serial dilution (0.39–200 µm). IC50 values were determined for C2 to be 2.3 µm, C15 to be 5.7 µm and C19 to be 6.8 µm by nonlinear curve fitting. C2 and 15 in contrast to compound 19 did not inhibit Δ129GAC activity by 100%. Data are mean ± S.D (n = 3).
Fig. 3
Fig. 3
Mode of inhibition of C19 and its quantitative interaction with Δ129GAC. (A) Steady‐state kinetics were employed to determine the mode of inhibition of C19. Inhibitory effects were measured as enzymatic activity of Δ129GAC (6 nm) using the enzyme assay and in the presence of 0, 16, 25 and 30 µm of compound. Km and V max were calculated and indicate that C19 exhibits noncompetitive inhibition as V max, but not Km , is altered by C19. The respective levels of NADH were measured after 5 min of incubation using the extinction coefficient 6220 M−1·cm−1 at 340 nm. Data points shown are mean ± SD (n = 5), and the curves were generated from 12 different substrate concentrations. For calculated Km , V max and K cat values, check Table 1. (B) Quantitative interaction between CB839 and nonlabelled Δ129GAC was performed by MST analysis. Incremental concentrations of CB839 (0–1000 nm) were tested with 100 nm Δ129GAC. Interaction of CB839 and Δ129GAC yielded a Kd ‐value of 25.6 ± 8.4 nm. (C) Using NT‐647‐labelled Δ129GAC (25 nm) yielded a Kd ‐value of 14.74 ± 3.83 µm. All Kd values were determined using nonlinear curve fitting. Data are means ± SD (n = 3). (D) Incremental concentrations of C19 (0–1000 µm) were tested with 100 nm Δ129GAC yielding a Kd ‐value of 20.0 ± 4.8 µm. Experimental conditions were 20% MST power and 20% excitation power at 25 °C.
Fig. 4
Fig. 4
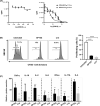
C19 inhibits anti‐CD3/CD28‐induced CD4+ T‐cell proliferation and cytokine secretion superior to BPTES. (A) Activated CD4+ T cells, MD‐468 and MD‐231 TNBC cell lines were treated with control compound CB839, and thymidine incorporation was assayed after 72 h of proliferation. Data are presented as mean ± S.D (n = 3). (B) CFSE‐labelled 1 × 106 purified human CD4+ T cells were treated with C19 (25 µm) and BPTES (25 µm) followed by stimulation with anti‐CD3/CD28 beads for 96 h. At 96 h, cells were subjected to flow cytometry. Representative flow cytometry histograms for a single donor demonstrating proliferation of CFSE‐labelled CD4+ T cells at 96 h in culture with anti‐CD3/CD28 beads, BPTES (25 µm) and C19 (25 µm). Data are presented as the mean of 2 independent experiments ± SD run with triplicates. Measurement bars and numbers represent the percentage of proliferating cells. (C) Levels of TNF‐α, IL‐10, IL‐2, IL‐6, INF‐γ, IL‐17A and IL‐4 were measured in cell culture supernatants on day 3 of α‐CD3/CD28‐stimulated CD4+ T cells in the presence of either BPTES (25 µm) or C19 (25 µm); and data were normalized to stimulated control. All the cytokines showed significant decrease in concentration in the presence of C19 compared to control. Data are means ± SD (n = 9; ****P < 0.001, ***P < 0.005, **P < 0.01, *P < 0.05).

Similar articles

Cited by

References

    1. DeBerardinis RJ, Cheng T. Q's next: the diverse functions of glutamine in metabolism, cell biology and cancer. Oncogene. 2010;29:313–24. - PMC - PubMed
    1. Wang JB, Erickson JW, Fuji R, Ramachandran S, Gao P, Dinavahi R, et al. Targeting mitochondrial glutaminase activity inhibits oncogenic transformation (vol 18, pg 207, 2010). Cancer Cell. 2010;18:397. - PMC - PubMed
    1. Gerriets VA, Rathmell JC. Metabolic pathways in T cell fate and function. Trends Immunol. 2012;33:168–73. - PMC - PubMed
    1. Perera SY, Chen TC, Curthoys NP. Biosynthesis and processing of renal mitochondrial glutaminase in cultured proximal tubular epithelial‐cells and in isolated‐mitochondria. J Biol Chem. 1990;265:17764–70. - PubMed
    1. Shapiro RA, Morehouse RF, Curthoys NP. Inhibition by glutamate of phosphate‐dependent glutaminase of rat kidney. Biochem J. 1982;207:561–6. - PMC - PubMed

Publication types