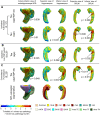
Ex vivo MRI atlas of the human medial temporal lobe: characterizing neurodegeneration due to tau pathology
- PMID: 34689831
- PMCID: PMC8543911
- DOI: 10.1186/s40478-021-01275-7
Ex vivo MRI atlas of the human medial temporal lobe: characterizing neurodegeneration due to tau pathology
Abstract
Tau neurofibrillary tangle (NFT) pathology in the medial temporal lobe (MTL) is closely linked to neurodegeneration, and is the early pathological change associated with Alzheimer's disease (AD). To elucidate patterns of structural change in the MTL specifically associated with tau pathology, we compared high-resolution ex vivo MRI scans of human postmortem MTL specimens with histology-based pathological assessments of the MTL. MTL specimens were obtained from twenty-nine brain donors, including patients with AD, other dementias, and individuals with no known history of neurological disease. Ex vivo MRI scans were combined using a customized groupwise diffeomorphic registration approach to construct a 3D probabilistic atlas that captures the anatomical variability of the MTL. Using serial histology imaging in eleven specimens, we labelled the MTL subregions in the atlas based on cytoarchitecture. Leveraging the atlas and neuropathological ratings of tau and TAR DNA-binding protein 43 (TDP-43) pathology severity, morphometric analysis was performed to correlate regional MTL thickness with the severity of tau pathology, after correcting for age and TDP-43 pathology. We found significant correlations between tau pathology and thickness in the entorhinal cortex (ERC) and stratum radiatum lacunosum moleculare (SRLM). When focusing on cases with low levels of TDP-43 pathology, we found strong associations between tau pathology and thickness in the ERC, SRLM and the subiculum/cornu ammonis 1 (CA1) subfields of the hippocampus, consistent with early Braak stages.
Keywords: Alzheimer’s disease; Biomarkers; Co-morbidities; Ex vivo MRI; Neurodegeneration; Neurofibrillary tangles.
© 2021. The Author(s).
Conflict of interest statement
D.A.W has received grant support from Merck, Biogen, and Eli Lilly/Avid. D.A.W received consultation fees from Neuronix and is on the DSMB for a clinical trial run by Functional Neuromodulation. L.X. received personal consultation fees from Galileo CDS, Inc. J.Q.T. may accrue revenue in the future on patents submitted by the University of Pennsylvania wherein he is co-Inventor and he received revenue from the sale of Avid to Eli Lily as co-inventor on imaging related patents submitted by the University of Pennsylvania.
Figures


Similar articles
-
Downstream effects of polypathology on neurodegeneration of medial temporal lobe subregions.Acta Neuropathol Commun. 2021 Jul 21;9(1):128. doi: 10.1186/s40478-021-01225-3. Acta Neuropathol Commun. 2021. PMID: 34289895 Free PMC article.
-
Three-dimensional mapping of neurofibrillary tangle burden in the human medial temporal lobe.Brain. 2021 Oct 22;144(9):2784-2797. doi: 10.1093/brain/awab262. Brain. 2021. PMID: 34259858 Free PMC article.
-
Postmortem imaging reveals patterns of medial temporal lobe vulnerability to tau pathology in Alzheimer's disease.Nat Commun. 2024 Jun 5;15(1):4803. doi: 10.1038/s41467-024-49205-0. Nat Commun. 2024. PMID: 38839876 Free PMC article.
-
Morphometry of medial temporal lobe subregions using high-resolution T2-weighted MRI in ADNI3: Why, how, and what's next?Alzheimers Dement. 2024 Sep 16. doi: 10.1002/alz.14161. Online ahead of print. Alzheimers Dement. 2024. PMID: 39279366 Review.
-
In vivo tau PET imaging in dementia: Pathophysiology, radiotracer quantification, and a systematic review of clinical findings.Ageing Res Rev. 2017 Jul;36:50-63. doi: 10.1016/j.arr.2017.03.002. Epub 2017 Mar 15. Ageing Res Rev. 2017. PMID: 28315409 Review.
Cited by
-
Automated deep learning segmentation of high-resolution 7 Tesla postmortem MRI for quantitative analysis of structure-pathology correlations in neurodegenerative diseases.Imaging Neurosci (Camb). 2024 May 8;2:1-30. doi: 10.1162/imag_a_00171. eCollection 2024 May 1. Imaging Neurosci (Camb). 2024. PMID: 39301426 Free PMC article.
-
Association of quantitative histopathology measurements with antemortem medial temporal lobe cortical thickness in the Alzheimer's disease continuum.Acta Neuropathol. 2024 Sep 3;148(1):37. doi: 10.1007/s00401-024-02789-9. Acta Neuropathol. 2024. PMID: 39227502 Free PMC article.
-
Entorhinal vessel density correlates with phosphorylated tau and TDP-43 pathology.Alzheimers Dement. 2024 Jul;20(7):4649-4662. doi: 10.1002/alz.13896. Epub 2024 Jun 14. Alzheimers Dement. 2024. PMID: 38877668 Free PMC article.
-
Olfactory deficit: a potential functional marker across the Alzheimer's disease continuum.Front Neurosci. 2024 Feb 16;18:1309482. doi: 10.3389/fnins.2024.1309482. eCollection 2024. Front Neurosci. 2024. PMID: 38435057 Free PMC article. Review.
-
Tau-neurodegeneration mismatch reveals vulnerability and resilience to comorbidities in Alzheimer's continuum.Alzheimers Dement. 2024 Mar;20(3):1586-1600. doi: 10.1002/alz.13559. Epub 2023 Dec 5. Alzheimers Dement. 2024. PMID: 38050662 Free PMC article.
References
-
- Hyman BT, Phelps CH, Beach TG, Bigio EH, Cairns NJ, Carrillo MC, Dickson DW, Duyckaerts C, Frosch MP, Masliah E, Mirra SS, Nelson PT, Schneider JA, Thal DR, Thies B, Trojanowski JQ, Vinters HV, Montine TJ. National Institute on Aging–Alzheimer’s Association guidelines for the neuropathologic assessment of Alzheimer’s disease. Alzheimer’s Dement. 2012;8:1–13. doi: 10.1016/j.jalz.2011.10.007. - DOI - PMC - PubMed
-
- Jack CR, Bennett DA, Blennow K, Carrillo MC, Dunn B, Haeberlein SB, Holtzman DM, Jagust W, Jessen F, Karlawish J, Liu E, Molinuevo JL, Montine T, Phelps C, Rankin KP, Rowe CC, Scheltens P, Siemers E, Snyder HM, Sperling R, Elliott C, Masliah E, Ryan L, Silverberg N. NIA-AA research framework: toward a biological definition of Alzheimer’s disease. Alzheimer’s Dement. 2018;14:535–562. doi: 10.1016/j.jalz.2018.02.018. - DOI - PMC - PubMed
-
- Bobinski M, Wegiel J, Tarnawski M, Bobinksi M, Reisberg B, De Leon MJ, Miller DC, Wisniewski HM. Relationships between regional neuronal loss and neurofibrillary changes in the hippocampal formation and duration and severity of Alzheimer disease. J Neuropathol Exp Neurol. 1997;56:414–420. doi: 10.1097/00005072-199704000-00010. - DOI - PubMed
Publication types
MeSH terms
Substances
Grants and funding
LinkOut - more resources
Full Text Sources
Miscellaneous

