. 2021 Oct 2;10(10):2638.
doi: 10.3390/cells10102638.

CDK1-Mediated Phosphorylation of BAG3 Promotes Mitotic Cell Shape Remodeling and the Molecular Assembly of Mitotic p62 Bodies

Affiliations

CDK1-Mediated Phosphorylation of BAG3 Promotes Mitotic Cell Shape Remodeling and the Molecular Assembly of Mitotic p62 Bodies

Carole Luthold et al. Cells. .

Abstract

The cochaperone BCL2-associated athanogene 3 (BAG3), in complex with the heat shock protein HSPB8, facilitates mitotic rounding, spindle orientation, and proper abscission of daughter cells. BAG3 and HSPB8 mitotic functions implicate the sequestosome p62/SQSTM1, suggesting a role for protein quality control. However, the interplay between this chaperone-assisted pathway and the mitotic machinery is not known. Here, we show that BAG3 phosphorylation at the conserved T285 is regulated by CDK1 and activates its function in mitotic cell shape remodeling. BAG3 phosphorylation exhibited a high dynamic at mitotic entry and both a non-phosphorylatable BAG3T285A and a phosphomimetic BAG3T285D protein were unable to correct the mitotic defects in BAG3-depleted HeLa cells. We also demonstrate that BAG3 phosphorylation, HSPB8, and CDK1 activity modulate the molecular assembly of p62/SQSTM1 into mitotic bodies containing K63 polyubiquitinated chains. These findings suggest the existence of a mitotically regulated spatial quality control mechanism for the fidelity of cell shape remodeling in highly dividing cells.

Keywords: BAG3 1; CDK1 4; HSPB8 2; K63 polyubiquitin chain 8; actin 7; mitotic cell rounding 6; p62/SQSTM1 bodies 3; protein quality control 9; spindle positioning 5.


Conflict of interest statement

The authors declare no conflict of interest. The funders had no role in the design of the study; in the collection, analyses, or interpretation of data; in the writing of the manuscript, or in the decision to publish the results.

Figures

Figure 1
Figure 1
BAG3 is phosphorylated at T285 during mitosis. (A) Schematic representation of BAG3 modular domains and phosphorylated residues, as identified by AP-MS. See also Figure S1 for MS data. Sequence alignments show the interspecies conservation of the identified phosphorylated motif. BAG3-GFPDMB and BAG3-GFPQMB constructs were generated by alanine substitution of designated residues (box). (B) Western blots of BAG3-GFP IPs prepared from HeLa-RFP-H2B cells growing asynchronously (AS) or arrested in mitosis by nocodazole treatment (M) and recovered by a mitotic shake-off, showing the mitotic mobility shift of BAG3-GFP constructs. Cells were transfected with BAG3-specific siRNA and transduced with Ad-BAG3-GFP. (C) Representative Western blots of HeLa cell extracts that have been transfected with control siRNA or BAG3-specific siRNA targeting BAG3 open reading frame (siBAG3 [ORF]), showing the pT285-BAG3 antibody specificity; M: nocodazole-arrested cells recovered by a mitotic shake-off; AS: asynchronous cells; levels of total BAG3 and GAPDH (loading control) are shown. (D) BAG3-GFP IPs were prepared from asynchronous (AS) or from mitotic HeLa-RFP-H2B cells synchronized by nocodazole and recovered by mitotic shake-off after transduction of cells with Ad-GFP-BAG3, as indicated; Western blots show total levels of GFP-BAG3 proteins and pT285-BAG3. (E) Extracts were prepared from asynchronous (AS) or from mitotic HeLa-RFP-H2B cells synchronized in early mitosis by nocodazole or arrested at the G2/M stage by RO3306. Western blots of endogenous proteins were performed as indicated; GAPDH: loading control. (F) Schematic of the protocol used. HeLa-RFP-H2B cells synchronized in mitosis by nocodazole, were recovered by a mitotic shake-off, and then seeded on poly-L-lysine-coated dishes in fresh medium, with or without MG132 (5 µM) to inhibit mitotic exit. (G) Cells were collected at different times and extracts were analyzed by Western blots, as indicated; GAPDH: loading control.
Figure 2
Figure 2
CDK1 regulates BAG3 phosphorylation dynamic at T285. (A) Schematic of the protocol used. Extracts were prepared from mitotic HeLa-RFP-H2B incubated for 1 h in the presence of chemical inhibitors of the following kinases: RO3306 (CDK1, 8 µM), Purvanolol A (CDKs, 10 µM), MLN8237 (Aurora A, 1 µM), and BI2536 (PLK1, 1 µM) or the vehicle only (DMSO); mitotic cells were collected by a mitotic shake-off. Immunoblotting was performed as indicated; GAPDH: loading control. See also Figure S2. (B) Autoradiogram showing phosphorylation of recombinant GST-BAG3 by a purified CDK1-cyclin B1 complex in the presence of 32 P-ATP; positive control: Histone H1; negative control: GST. (C) Immunoblotting of in vitro phosphorylated BAG3 using the phospho-specific pT285-BAG3 antibody; total levels of GST-BAG3 are shown. (D) BAG3-GFP IPs were prepared from asynchronous (AS) or mitotic HeLa-Flp-In T-REx- BAG3-GFPWT (nocodazole-arrested) transfected with BAG3-specific siRNA (siBAG3 [3′UTR_1], 48 h) and treated with doxycycline to induce BAG3-GFP expression (1 ng/mL, 16 h). Western blots of the GFP IPs were performed as indicated; levels of CDK1, pY15-CDK1 (inactive CDK1), p62, and BAG3-GFP in total cell extracts are shown (Input).
Figure 3
Figure 3
Non-phosphorylatable BAG3-GFPDMB expression in BAG3-depleted cells, as phospho-mimetic BAG3-GFPT285D, cannot rescue spindle dynamics and mitotic rounding defects. (A) Depletion-rescue experiments were performed in HeLa-RFP-H2B transfected with siBAG3 (3’UTR_1) or control siRNA and transduced with recombinant adenoviruses driving expression of BAG3-GFP proteins. Cells were synchronized in mitosis by a double thymidine block. (B) Total cell extracts were analyzed by Western blots using anti-BAG3 and anti-GAPDH; levels of endogenous BAG3 depletion (>75% reduction) and exogenous BAG3-GFP levels were estimated by loading increasing amounts of control cell extract (siCtl, 1/8, 1/4, 1/2, 1), or from an extract of BAG3-depleted cells transduced with Ad-BAG3-GFP, respectively. (C) Representative spinning disk confocal time-lapse sequences of cells from (B) transduced with BacMam-RFP-α-tubulin, showing normalization of spindle dynamics in BAG3-depleted cells upon reintroduction of BAG3-GFPWT, but not by non-phosphorylatable BAG3-GFPDMB expression or phosphomimetic BAG3-GFPT285D. The green asterisks designate a spindle pole showing normal dynamic in a BAG3-depleted cells expressing wild-type BAG3-GFP, while magenta asterisks designate a spindle pole showing abnormal motility in a BAG3-depleted cell expressing BAG3-GFPDMB; Bar: 10 μm. The graph shows quantification of percentages of rounded cells with spindle dynamic defects defined as spindle rocking or stalled in mitosis ± spindle rocking; means ± SE of 92 to 525 cells from at least 3 independent experiments. Statistical significance was analyzed with the Fisher Exact Test ****: p < 0.0001. See also Videos S1–S5 for representative phenotypes. (D) Epifluorescence images showing the representative phenotype of a rounded mitotic cell at metaphase (siCtl) compared to a flat mitotic cell at metaphase (siBAG3 [3′UTR_2]); F-actin, tubulin, and DNA were stained using phalloidin (green), α-tubulin antibody (magenta) and Hoechst (white), Bar: 10 μm. The graph depicts percentages of cells with mitotic cell rounding defects; means ± SE of 600 to 622 cells from 3 independent experiments. Statistical significance was analyzed by the Fisher Exact Test ****: p < 0.0001; ns, not significant. See also Figure S2A for Western blots of BAG3 depletion levels and Figure S3 for impacts of BAG3-GFP constructs on the aggresomal targeting of ubiquitinated proteins.
Figure 4
Figure 4
BAG3 phosphorylation at T285 is regulated by p62 during mitosis. (A) Western blots of extracts from asynchronous (AS) or mitotic HeLa cells (M) synchronized in mitosis by nocodazole and collected by mitotic shake-off. Cells were transfected with control siRNA (siCtl) or p62-specific siRNAs (sip62) and levels of pT285-BAG3, BAG3, p62, and GAPDH (loading control) are shown. Graph depicting the fold change in pT285-BAG3 levels, as estimated relative to cells transfected with control siRNA and normalized relative to GAPDH levels; means ± SE from 3 independent experiments. Statistical significance was analyzed by the Student′s t-Test ****: p < 0.0001. See also Figure S4B that depicts the fold change in BAG3 total levels as estimated relative to cells transfected with control siRNA and normalized relative to GAPDH levels. (B) Western blots of cell extracts prepared from asynchronous (AS) or from mitotic HeLa cells (M) synchronized in mitosis by nocodazole and collected by mitotic shake-off; cells were transfected with control siRNA (siCtl) or BAG3-specific siRNA (siBAG3 [ORF]) or HSPB8-specific siRNAs, and protein levels are shown as indicated. Graphs depicting the fold change in total p62 levels (p62) normalized relative to GAPDH levels, and the fold change in pT269-S272-p62 levels (p-p62) normalized relative p62 total levels, as estimated relative to cells transfected with control siRNA. Data are means ± SE from 3 independent experiments. (C) Scheme recapitulating putative functional relationships: CDK1 phosphorylates p62 that in turn enhances CDK1 activity [59]; the increased mitotic association between the BAG3-HSPB8 chaperone complex and p62 may promote BAG3 phosphorylation and stabilize p62 during mitosis.
Figure 5
Figure 5
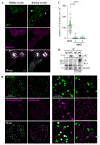
The sequestosome p62 forms mitotic inclusion bodies (MIBS) enriched in CDK1-phosphorylated p62 and K63 polyubiquitin chains. (A) Representative single-plane confocal images of HeLa cells synchronized in mitosis by a double thymidine block, showing staining of p62, K63 polyubiquitin (K63-Ub), and DNA (Hoechst) in cells at different mitotic stages compared to a cell in interphase; M: metaphase; A: anaphase; I: interphase. Bar: 10 μm. (B) Deconvolved single-plane confocal images of a representative HeLa cell at metaphase from a non-synchronized cell population, showing staining of pT269-S272-p62 (CDK1-induced), pS403-p62 (stress-induced), and total p62. Enlarged views of the boxed regions emphasize MIBS spherical shape and enrichment in p62 phosphorylated at mitotic sites (T269-S272) but not at the canonical stress-induced site (S403); Bars: 10 μm or 2.5 µm. (C) Quantification of polyubiquitin clusters in non-synchronized HeLa cells at prometaphase-metaphase. Cells were transfected with control siRNA or p62-specific siRNAs and stained using anti-α-tubulin and anti-ubiquitin antibodies, means ± SE from 102 to 136 cells from at least 4 independent experiments. Statistical significance was analyzed using the Kruskal–Wallis test and Dunn′s multiple comparisons: ****, p < 0.0001. See also Figure S5A for the representative phenotype in p62-depleted cells and Figure S5B for MIBS staining in other cell types. (D) p62 or control IPs were prepared using anti-p62 or rabbit IgG, respectively, from mitotic HeLa cells (nocodazole-treated and recovered by a mitotic shake-off); cells were treated with a reversible crosslinker (DTME) or the vehicle prior to cell lysis and p62 IPs were analyzed by Western blot using anti-p62, anti-BAG3, and anti-K63 polyubiquitin.
Figure 6
Figure 6
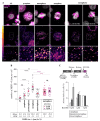
MIBS assembly is regulated by CDK1 activity. (A) Maximum intensity projections of confocal image stacks from representative HeLa-RFP-H2B cells synchronized in mitosis by a double thymidine block, showing staining of p62, β-tubulin, and DNA (Hoechst); cells were treated or not with low doses of the CDK1 inhibitor RO3306 for 3 h before cell fixation. Enlarged views of boxed regions are shown to emphasize MIBS assembly until metaphase and their disassembly at anaphase, and inhibition of MIBS assembly by the CDK1 inhibitor. A heatmap pseudo-color intensity scale was applied to the p62 staining channel to underscore MIBS assembly dynamics; Bars: 10 µm or 5 µm. (B) Quantification of cells from (A), indicating MIBS number per cell and their mean size during mitotic progression, means ± SE from 11 to 59 cells from 2 representative experiments. Statistical significance was analyzed with the Kruskal–Wallis test: ****, p < 0.0001; ***, p < 0.001; **: p < 0.005; ns, not significant. (C) Schematic of the protocol used. Quantification of cells from (A), showing percentages of cells treated with RO3306 or the vehicle (DMSO) at distinct mitotic stages, means ± SE from 411 to 438 cells from 2 representative experiments.
Figure 7
Figure 7
The molecular assembly of p62-MIBS depends on BAG3 phosphorylation and HSPB8. (A) Quantification of MIBS number per cell (prometaphase-metaphase) in HeLa cells transfected with control siRNA (siCtl) or BAG3-specific siRNAs or HSPB8-specific siRNAs, and stained for endogenous p62, α-tubulin, and DNA; means ± SE from 70 to 136 cells from at least 3 independent experiments. Statistical significance was analyzed with the Kruskal–Wallis test and Dunn′s multiple comparisons: ****, p < 0,0001. (B) Schematic of the protocol used for depletion-rescue analyses of MIBS assembly in Flp-In T-Rex HeLa cell lines. Western blots of extracts from cells treated with BAG3-specific siRNA (3′UTR_2) and doxycycline (1 ng/mL, 16 h), showing levels of BAG3-GFPWT, BAG3-GFPDMB, and BAG3-GFPT285D as compared to endogenous BAG3 levels, as estimated by loading increasing amounts of control Flp-In T-Rex HeLa cell extract (1, 1/4, 1/2, 1/8); HSPB8 and GAPDH levels (loading controls) are shown. (C) Maximum intensity projections of confocal image stacks from mitotic Flp-In T-Rex HeLa cell lines expressing GFP as a control or the indicated BAG3-GFP constructs; cells were treated as in (B) and stained for p62, DNA (Hoechst), and β-tubulin (spindle, not shown). A heatmap pseudo-color intensity scale was applied to the p62 staining channel to emphasize impacts on MIBS number and size; Bar: 10 μm. Cells were synchronized in mitosis with a double thymidine block and BAG3-GFP proteins were induced with doxycycline (1 ng/mL, 16 h) during the first thymidine block. The graph shows MIBS number per cell, as quantified in cells at prometaphase-metaphase, means ± SE from 50 to 86 cells from 2 representative experiments. Statistical significance was analyzed with the Kruskal–Wallis test: ****, p < 0.0001; *, p < 0.05.

Similar articles

Cited by

References

    1. Taubenberger A.V., Baum B., Matthews H.K. The Mechanics of Mitotic Cell Rounding. Front. Cell Dev. Biol. 2020;8:687. doi: 10.3389/fcell.2020.00687. - DOI - PMC - PubMed
    1. Ramkumar N., Baum B. Coupling changes in cell shape to chromosome segregation. Nat. Rev. Mol. Cell Biol. 2016;17:511–521. doi: 10.1038/nrm.2016.75. - DOI - PubMed
    1. Kakihana A., Oto Y., Saito Y., Nakayama Y. Heat shock-induced mitotic arrest requires heat shock protein 105 for the activation of spindle assembly checkpoint. FASEB J. 2019;33:3936–3953. doi: 10.1096/fj.201801369R. - DOI - PubMed
    1. Fang C.T., Kuo H.H., Pan T.S., Yu F.C., Yih L.H. HSP70 regulates the function of mitotic centrosomes. Cell Mol. Life Sci. 2016;73:3949–3960. doi: 10.1007/s00018-016-2236-8. - DOI - PMC - PubMed
    1. Yang Y., Wang W., Li M., Gao Y., Zhang W., Huang Y., Zhuo W., Yan X., Liu W., Wang F., et al. NudCL2 is an Hsp90 cochaperone to regulate sister chromatid cohesion by stabilizing cohesin subunits. Cell Mol. Life Sci. 2018 doi: 10.1007/s00018-018-2957-y. - DOI - PMC - PubMed

Publication types

MeSH terms

LinkOut - more resources