. 2021 Oct 1;10(10):2616.
doi: 10.3390/cells10102616.

1,8-Cineole Affects Agonists-Induced Platelet Activation, Thrombus Formation and Haemostasis

Affiliations

1,8-Cineole Affects Agonists-Induced Platelet Activation, Thrombus Formation and Haemostasis

Kahdr A Alatawi et al. Cells. .

Abstract

1,8-cineole, a monoterpenoid is a major component of eucalyptus oil and has been proven to possess numerous beneficial effects in humans. Notably, 1,8-cineole is the primary active ingredient of a clinically approved drug, Soledum® which is being mainly used for the maintenance of sinus and respiratory health. Due to its clinically valuable properties, 1,8-cineole has gained significant scientific interest over the recent years specifically to investigate its anti-inflammatory and antioxidant effects. However, the impact of 1,8-cineole on the modulation of platelet activation, thrombosis and haemostasis was not fully established. Therefore, in this study, we demonstrate the effects of 1,8-cineole on agonists-induced platelet activation, thrombus formation under arterial flow conditions and haemostasis in mice. 1,8-cineole largely inhibits platelet activation stimulated by glycoprotein VI (GPVI) agonists such as collagen and cross-linked collagen-related peptide (CRP-XL), while it displays minimal inhibitory effects on thrombin or ADP-induced platelet aggregation. It inhibited inside-out signalling to integrin αIIbβ3 and outside-in signalling triggered by the same integrin as well as granule secretion and intracellular calcium mobilisation in platelets. 1,8-cineole affected thrombus formation on collagen-coated surface under arterial flow conditions and displayed a minimal effect on haemostasis of mice at a lower concentration of 6.25 µM. Notably, 1,8-cineole was found to be non-toxic to platelets up to 50 µM concentration. The investigation on the molecular mechanisms through which 1,8-cineole inhibits platelet function suggests that this compound affects signalling mediated by various molecules such as AKT, Syk, LAT, and cAMP in platelets. Based on these results, we conclude that 1,8-cineole may act as a potential therapeutic agent to control unwarranted platelet reactivity under various pathophysiological settings.

Keywords: 1,8-cineole; collagen; haemostasis; platelet reactivity; platelets; signalling; thrombosis.


Conflict of interest statement

The authors declare no conflict of interest. The funders had no role in the design of the study; in the collection, analyses, or interpretation of data; in the writing of the manuscript, or in the decision to publish the results.

Figures
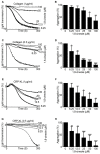
Figure 1
Figure 1
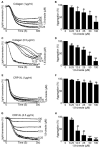
Effect of 1,8-cineole on GPVI agonists-stimulated aggregation in human isolated platelets. A vehicle control [0.1% (v/v) ethanol] or various concentrations of 1,8-cineole were incubated with human isolated platelets for 5 min prior to stimulation of aggregation with 1 µg/mL (A,B) or 0.5 µg/mL (C,D) collagen, and 1 µg/mL (E,F) or 0.5 µg/mL (G,H) CRP-XL. The level of aggregation was monitored for 5 min in an optical aggregometer. The aggregation traces shown are representative of five separate experiments. The percentage of aggregation for 1,8-cineole-treated samples was calculated by considering the level of aggregation obtained with the vehicle control (0) as 100%. Data represent mean ± SEM (n = 5). The p values shown (* p < 0.05, ** p < 0.01, *** p < 0.001 and **** p < 0.0001) are as calculated by one-way ANOVA followed by Bonferroni post hoc test.
Figure 2
Figure 2
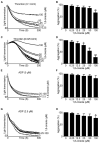
Impact of 1,8-cineole on GPVI agonists-stimulated aggregation in human PRP. Human PRP was treated with a vehicle control [0.1% (v/v) ethanol] or various concentrations of 1,8-cineole for 5 min prior to stimulation of aggregation with 1 µg/mL (A,B) or 0.5 µg/mL (C,D) of collagen, and 1 µg/mL (E,F) or 0.5 µg/mL (G,H) of CRP-XL. The level of aggregation was monitored for 5 min by optical aggregometry. The aggregation traces shown are representative of five separate experiments. The percentage of aggregation for 1,8-cineole-treated samples was calculated by considering the level of aggregation obtained with the vehicle control (0) as 100%. Data represent mean ± SEM (n = 5). The p values shown (* p < 0.05, ** p < 0.01, *** p < 0.001 and **** p < 0.0001) are as calculated by one-way ANOVA followed by Bonferroni post hoc test.
Figure 3
Figure 3
Effect of 1,8-cineole on thrombin- and ADP-stimulated aggregation in human platelets. Human isolated platelets were incubated with a vehicle control [0.1% (v/v) ethanol] or various concentrations of 1,8-cineole for 5 min prior to stimulation of aggregation with 0.1 U/mL (A,B) or 0.025 U/mL (C,D) thrombin. Similarly, human PRP was incubated with various concentrations of 1,8-cineole for 5 min prior to inducing platelet aggregation with 5 µM (E,F) or 2.5 µM (G,H) ADP. The level of aggregation was monitored for 5 min by optical aggregometry. The aggregation traces shown are representative of four separate experiments. The percentage of aggregation for 1,8-cineole-treated samples was calculated by considering the level of aggregation obtained with the vehicle control (0) as 100%. Data represent mean ± SEM (n = 4). The p values shown (* p < 0.05, ** p < 0.01 and *** p < 0.001) are as calculated by one-way ANOVA followed by Bonferroni post hoc test.
Figure 4
Figure 4
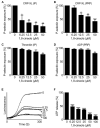
Effect of 1,8-cineole on inside-out signalling to integrin αIIbβ3 in human platelets. Human isolated platelets (IP) or PRP were incubated with a vehicle control [0.01% (v/v) ethanol] or various concentrations of 1,8-cineole for 5 min prior to addition of CRP-XL (0.5 μg/mL) (A,B), thrombin (0.025 U/mL) (C) or ADP (2.5 μM) (D) and further incubation for 20 min at room temperature. The level of fibrinogen binding (as a marker for inside-out signalling to integrin αIIbβ3) on the platelet surface was quantified using FITC-conjugated anti-human fibrinogen antibodies by flow cytometry. The bar graph indicates the percentage of fibrinogen binding as calculated with respect to the vehicle (0) control (considered as 100%). Data represent mean ± SEM. (n = 5). The p values shown (* p < 0.05, ** p < 0.01 and *** p < 0.001) are as calculated by one-way ANOVA followed by Bonferroni post hoc test.
Figure 5
Figure 5
Impact of 1,8-cineole on granule secretion in human platelets. Human isolated platelets (IP) or PRP were incubated with a vehicle control [0.01% (v/v) ethanol] or various concentrations of 1,8-cineole for 5 min prior to the addition of CRP-XL (0.5 μg/mL) (A,B), thrombin (0.025 U/mL) (C) or ADP (2.5 μM) (D) and further incubation for 20 min at room temperature. The level of α-granule secretion in platelets was determined by quantifying the amount of P-selectin exposed (as a marker for α-granule secretion) on the platelet surface upon activation using PE/Cy5-conjugated anti-human P-selectin antibodies by flow cytometry. The bar graphs show the effects of various concentrations of 1,8-cineole on α-granule secretion in human isolated platelets or PRP upon stimulation with different agonists. Moreover, the effect of 1,8-cineole on dense granule secretion was quantified by measuring the level of ATP release upon activation of platelets. The human isolated platelets were incubated with different concentrations of 1,8-cineole or a vehicle control [0.01% (v/v) ethanol] for 5 min in the presence of the Chrono-lume luciferin-luciferase reagent and the level of ATP released upon platelet activation with 0.5 µg/mL CRP-XL was monitored using lumi-aggregometry. The traces (E) shown are representative of four separate experiments. The cumulative data (F) shown demonstrate the effect of 1,8-cineole on dense granule secretion in platelets as calculated by considering the level of ATP release observed with the vehicle control as 100%. Data represent mean ± SEM. (n = 4). The p values shown (* p < 0.05, ** p < 0.01, *** p < 0.001 and **** p < 0.0001) are as calculated by one-way ANOVA followed by Bonferroni post hoc test.
Figure 6
Figure 6
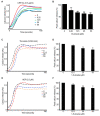
Effect of 1,8-cineole on intracellular calcium mobilisation in human platelets. Human PRP (A,E) or isolated platelets (C) treated with Fluo-4 AM dye were incubated with a vehicle control or various concentrations of 1,8-cineole for 5 min prior to stimulation of calcium release with CRP-XL (0.5 µg/mL) (A,B), thrombin (0.025 U/mL) (C,D) or ADP (2.5 µM) (E,F). The level of calcium release was monitored for 3 min by spectrofluorimetry. The traces shown are representative of four separate experiments. The cumulative data were calculated by taking the peak calcium released in the vehicle control as 100%. Data represent mean ± SEM. (n = 4). The p values shown (* p < 0.05 and ** p < 0.01) are as calculated by one-way ANOVA followed by Bonferroni post hoc test.
Figure 7
Figure 7
Effect of 1,8-cineole on integrin αIIbβ3-mediated outside-in signalling in human platelets. Human isolated platelets (at a density of 2x10⁷ cells/mL) were incubated with a vehicle control (0) or different concentrations of 1,8-cineole for 5 min and added onto fibrinogen- (100 μg/mL) coated coverslips and allowed them to spread for 45 min. Following fixation with 0.2% (v/v) formyl saline followed by permeabilisation with 0.2% (v/v) Triton X-100, the platelets were stained with Alexa Fluor 488-conjugated phalloidin for visualisation. Platelet spreading was analysed using a 100x oil immersion lens on a Nikon A1-R confocal microscope. Ten random images of view were recorded and for each sample, random locations on the slides were analysed. The number of platelets at different stages of spreading was determined by analysing the images using ImageJ. (A) representative images captured at 45 min of platelet spreading in the absence and presence of different concentrations of 1,8-cineole. (Bi) the cumulative data showing the number of platelets adhered to fibrinogen in control and 1,8-cineole treated samples. (Bii), the relative percentage of adhered platelets that progressed to filopodia and full spread stages on fibrinogen at 45 min. Data represent mean ± SEM (n = 4 individual experiments using platelets obtained from four volunteers, and for each, 10 images were used for analysis). (C) to determine the impact of 1,8-cineole on clot retraction, human PRP was treated with various concentrations of 1,8-cineole prior to addition of 1 U/mL thrombin and monitoring of clot retraction for 2 h. The images shown are representative of four separate experiments. The data shown were calculated by measuring the remaining clot weights after 2 h of retraction. Data represent mean ± SEM (n = 4). The p values shown (* p < 0.05, ** p < 0.001 and *** p < 0.001) are as calculated by one-way ANOVA followed by Bonferroni post hoc test.
Figure 8
Figure 8
Impact of 1,8-cineole on thrombus formation and haemostasis. DiOC6 (a lipophilic dye) (5 μM)-labelled human whole blood was incubated with a vehicle or different concentrations of 1,8-cineole for 5 min and perfused through microfluidic channels (Vena8 BioChips) coated with collagen (400 μg/mL). Thrombus formation was observed using a 20 × objective on a Nikon A1-R confocal microscope, with images captured every 30 s up to 10 min (A). Quantified data represent median fluorescence intensity of thrombi formed at 10 min in control and 1,8-cineole-treated samples as calculated using NIS elements software (Nikon) and normalised to the level of median fluorescence intensity obtained for thrombi at 10 min in the vehicle treated sample (B). Data represents mean ± SEM (n = 3). The p values (* p < 0.05, and ** p < 0.01) shown are as calculated by one-way ANOVA with Dunnett’s post hoc test. (C) Effect of 1,8-cineole on haemostasis in mice was analysed using a tail bleeding assay. Mice (n = 6 per group) were anaesthetised and a vehicle control [0.01% (v/v) ethanol] or 1,8-cineole (6.25 µM or 12.5 µM) was administered via femoral artery. After 5 minutes of incubation, 3 mm of tail tip was dissected, and the tail tip was placed in sterile PBS. The time for cessation of bleeding was measured up to 20 minutes. Data represent mean ± SEM (n = 6). The p values shown (** p < 0.01 and *** p < 0.001) are as calculated by non-parametric Kruskal–Wallis test. (D) To determine whether 1,8-cineole exerts any cytotoxic effects on human platelets, human isolated platelets were exposed to a positive control, a vehicle control [0.1% (v/v) ethanol] or various concentrations of 1,8-cineole for 30 min and the amount of LDH released (a marker for cytotoxicity) was measured at 490 nm and 650 nm using spectrophotometry. The maximum LDH release obtained with the positive control was taken as 100% and the level of LDH release for 1,8-cineole treated samples was calculated accordingly. Data represent mean ± SEM (n = 3). The p value shown (* p < 0.05) was calculated by one-way ANOVA with post hoc Dunnett’s test.
Figure 9
Figure 9
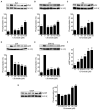
Effect of 1,8-cineole on specific signalling proteins and cAMP levels in platelets. Human isolated platelets (4 × 10⁸ cells/mL) were treated with a vehicle control (0) or various concentrations of 1,8-cineole for 5 min before stimulation with CRP-XL (0.5 µg/mL) for 5 min in an aggregometer at 37°C. Then, the cells were lysed using reducing sample treatment buffer and analysed in SDS-PAGE followed by immunoblots using various phospho-specific antibodies. The impact of 1,8-cineole on the phosphorylation of pSyk (Y525/526) (A), pLAT (Y200) (B), pAKT (S473) (C), pp38 (D), and pERK1/2 (E) was analysed using selective phospho-specific antibodies for these proteins in immunoblots. (F) the level of cAMP in platelets that were treated with a vehicle control or various concentrations of 1,8-cineole was measured using a cAMP ELISA kit in line with the manufacturer’s instructions. Data represent mean ± SEM. (n = 4). (G), the phosphorylation of VASP (S157) was analysed using platelets that were treated with a vehicle control or different concentrations of 1,8-cineole. The level of 14-3-3ζ was detected as a loading control in all these blots. The blots shown are representative of three separate experiments. Data represent mean ± SEM (n = 3), normalised to loading control. The p values shown (* p < 0.05, ** p < 0.01 and *** p < 0.001) are as calculated by one way-ANOVA followed by Bonferroni’s correction for multiple comparisons.

Similar articles

Cited by

References

    1. Gibbins J.M. Platelet adhesion signalling and the regulation of thrombus formation. J. Cell Sci. 2004;117:3415–3425. doi: 10.1242/jcs.01325. - DOI - PubMed
    1. Barrett N.E., Holbrook L., Jones S., Kaiser W.J., Moraes L.A., Rana R., Sage T., Stanley R.G., Tucker K.L., Wright B., et al. Future innovations in anti-platelet therapies. Br. J. Pharmacol. 2008;154:918–939. doi: 10.1038/bjp.2008.151. - DOI - PMC - PubMed
    1. Cragg G.M., Newman D.J. Natural products: A continuing source of novel drug leads. Biochim. Biophys. Acta Gen. Subj. 2013;1830:3670–3695. doi: 10.1016/j.bbagen.2013.02.008. - DOI - PMC - PubMed
    1. Dhifi W., Bellili S., Jazi S., Bahloul N., Mnif W. Essential Oils’ Chemical Characterization and Investigation of Some Biological Activities: A Critical Review. Medicines. 2016;3:25. doi: 10.3390/medicines3040025. - DOI - PMC - PubMed
    1. Dagli N., Dagli R.J., Mahmoud R.S., Baroudi K. Essential oils, their therapeutic properties, and implication in dentistry: A review. J. Int. Soc. Prev. Community Dent. 2015;5:335–340. doi: 10.4103/2231-0762.165933. - DOI - PMC - PubMed

Publication types