Nano DNA Vaccine Encoding Toxoplasma gondii Histone Deacetylase SIR2 Enhanced Protective Immunity in Mice
- PMID: 34683874
- PMCID: PMC8538992
- DOI: 10.3390/pharmaceutics13101582
Nano DNA Vaccine Encoding Toxoplasma gondii Histone Deacetylase SIR2 Enhanced Protective Immunity in Mice
Abstract
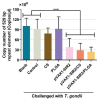
The pathogen of toxoplasmosis, Toxoplasma gondii (T. gondii), is a zoonotic protozoon that can affect the health of warm-blooded animals including humans. Up to now, an effective vaccine with completely protection is still inaccessible. In this study, the DNA vaccine encoding T. gondii histone deacetylase SIR2 (pVAX1-SIR2) was constructed. To enhance the efficacy, chitosan and poly (d, l-lactic-co-glycolic)-acid (PLGA) were employed to design nanospheres loaded with the DNA vaccine, denoted as pVAX1-SIR2/CS and pVAX1-SIR2/PLGA nanospheres. The pVAX1-SIR2 plasmids were transfected into HEK 293-T cells, and the expression was evaluated by a laser scanning confocal microscopy. Then, the immune protections of pVAX1-SIR2 plasmid, pVAX1-SIR2/CS nanospheres, and pVAX1-SIR2/PLGA nanospheres were evaluated in a laboratory animal model. The in vivo findings indicated that pVAX1-SIR2/CS and pVAX1-SIR2/PLGA nanospheres could generate a mixed Th1/Th2 immune response, as indicated by the regulated production of antibodies and cytokines, the enhanced maturation and major histocompatibility complex (MHC) expression of dendritic cells (DCs), the induced splenocyte proliferation, and the increased percentages of CD4+ and CD8+ T lymphocytes. Furthermore, this enhanced immunity could obviously reduce the parasite burden in immunized animals through a lethal dose of T. gondii RH strain challenge. All these results propose that pVAX1-SIR2 plasmids entrapped in chitosan or PLGA nanospheres could be the promising vaccines against acute T. gondii infections and deserve further investigations.
Keywords: PLGA; SIR2; Toxoplasma gondii; chitosan; histone deacetylase; immune protection.
Conflict of interest statement
The authors declare no conflict of interest.
Figures


Similar articles
-
With Chitosan and PLGA as the Delivery Vehicle, Toxoplasma gondii Oxidoreductase-Based DNA Vaccines Decrease Parasite Burdens in Mice.Front Immunol. 2021 Aug 27;12:726615. doi: 10.3389/fimmu.2021.726615. eCollection 2021. Front Immunol. 2021. PMID: 34512659 Free PMC article.
-
Nano vaccines for T. gondii Ribosomal P2 Protein With Nanomaterials as a Promising DNA Vaccine Against Toxoplasmosis.Front Immunol. 2022 Feb 21;13:839489. doi: 10.3389/fimmu.2022.839489. eCollection 2022. Front Immunol. 2022. PMID: 35265084 Free PMC article.
-
Nanospheres as the delivery vehicle: novel application of Toxoplasma gondii ribosomal protein S2 in PLGA and chitosan nanospheres against acute toxoplasmosis.Front Immunol. 2024 Oct 1;15:1475280. doi: 10.3389/fimmu.2024.1475280. eCollection 2024. Front Immunol. 2024. PMID: 39416787 Free PMC article.
-
The Virulence-Related MYR1 Protein of Toxoplasma gondii as a Novel DNA Vaccine Against Toxoplasmosis in Mice.Front Microbiol. 2019 Apr 9;10:734. doi: 10.3389/fmicb.2019.00734. eCollection 2019. Front Microbiol. 2019. PMID: 31024505 Free PMC article.
-
GRA24-Based DNA Vaccine Prolongs Survival in Mice Challenged With a Virulent Toxoplasma gondii Strain.Front Immunol. 2019 Mar 6;10:418. doi: 10.3389/fimmu.2019.00418. eCollection 2019. Front Immunol. 2019. PMID: 30894865 Free PMC article.
Cited by
-
Interaction of γ-Polyglutamic Acid/Polyethyleneimine/Plasmid DNA Ternary Complexes with Serum Components Plays a Crucial Role in Transfection in Mice.Pharmaceutics. 2024 Apr 9;16(4):522. doi: 10.3390/pharmaceutics16040522. Pharmaceutics. 2024. PMID: 38675183 Free PMC article.
-
Protective efficacy of Toxoplasma gondii GRA12 or GRA7 recombinant proteins encapsulated in PLGA nanoparticles against acute Toxoplasma gondii infection in mice.Front Cell Infect Microbiol. 2023 Jul 12;13:1209755. doi: 10.3389/fcimb.2023.1209755. eCollection 2023. Front Cell Infect Microbiol. 2023. PMID: 37502604 Free PMC article.
-
PLGA Nanoparticles as an Efficient Platform in Protein Vaccines Against Toxoplasma gondii.Acta Parasitol. 2022 Jun;67(2):582-591. doi: 10.1007/s11686-021-00499-w. Epub 2022 Jan 11. Acta Parasitol. 2022. PMID: 35013939 Review.
-
Protective Efficacy of a Novel DNA Vaccine with a CL264 Molecular Adjuvant against Toxoplasma gondii in a Murine Model.Vaccines (Basel). 2024 May 25;12(6):577. doi: 10.3390/vaccines12060577. Vaccines (Basel). 2024. PMID: 38932306 Free PMC article.
-
Synthesis and In vitro evaluation of bichalcones as novel anti-toxoplasma agents.Front Chem. 2024 Jul 22;12:1406307. doi: 10.3389/fchem.2024.1406307. eCollection 2024. Front Chem. 2024. PMID: 39104777 Free PMC article.
References
Grants and funding
- 2020AB025/The Key Scientific and Technological Project of XPCC
- 202010307099/College Students' innovation and entrepreneurship training program
- None/Supported by the State Key Laboratory of Veterinary Etiological Biology, Lanzhou Veterinary Research Institute, Chinese Academy of Agricultural Sciences
LinkOut - more resources
Full Text Sources
Research Materials
Miscellaneous

